Cited by 112

The DOI matches its Crossref record; 9 of the 9 references it cites were found in a registry or an index.

Environmental sensing by mature B cells is controlled by the transcription factors PU.1 and SpiB

Willis, Simon N., Tellier, Julie, Liao, Yang, Trezise, Stephanie, Light, Amanda, O’Donnell, Kristy, Garrett-Sinha, Lee Ann, Shi, Wei, Tarlinton, David M., Nutt, Stephen L.·2017·Nature Communications

Abstract

Humoral immunity requires B cells to respond to multiple stimuli, including antigen, membrane and soluble ligands, and microbial products. Ets family transcription factors regulate many aspects of haematopoiesis, although their functions in humoral immunity are difficult to decipher as a result of redundancy between the family members. Here we show that mice lacking both PU.1 and SpiB in mature B cells do not generate germinal centers and high-affinity antibody after protein immunization. PU.1 and SpiB double-deficient B cells have a survival defect after engagement of CD40 or Toll-like receptors (TLR), despite paradoxically enhanced plasma cell differentiation. PU.1 and SpiB regulate the expression of many components of the B cell receptor signaling pathway and the receptors for CD40L, BAFF and TLR ligands. Thus, PU.1 and SpiB enable B cells to appropriately respond to environmental cues.

Overview

The claims and statistics of this paper haven’t been checked yet.

Run the check — free, no account needed. It reads the open-access text and checks the sources it cites.

A few free checks a day · papers already verified open instantly · results are public

Integrity signals

Registry

Crossref · 10.1038/s41467-017-01605-1

Cites

9 of 9 references verified0 citation errors · 0 not checkable

Statistics

Figures

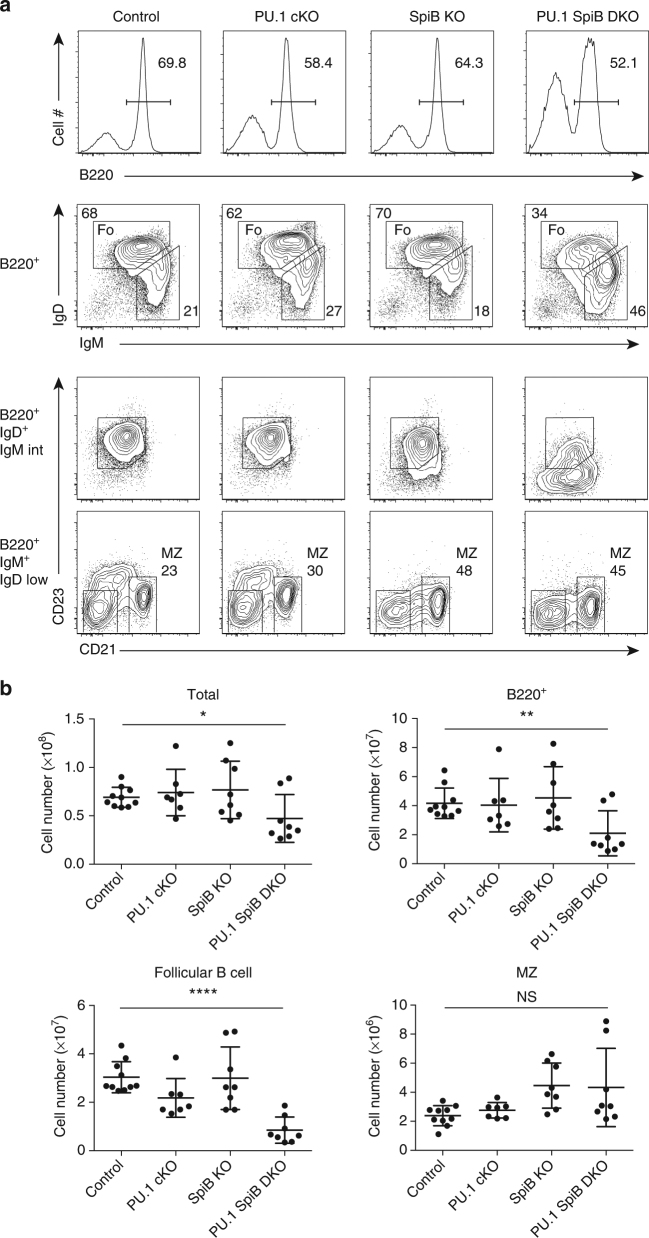
Fig. 1 PU.1 and SpiB regulate follicular B cell numbers. a Flow cytometric analysis of splenocytes from control (Cd23 T/+), PU.1 cKO (Spi1 fl/fl Cd23 T/+), SpiB KO (Spi1 fl/fl Cd23 +/+ Spib −/−) and PU.1 SpiB DKO (Spi1 fl/fl Cd23 T/+ Spib −/−) mice showing the abbreviated gating strategy for the detection of follicular (Fo) B cells (B220+ IgD+ IgMint) and MZ (B220+ IgM+ IgDlow CD21+) B cells. As the loss of PU.1 and SpiB leads to the downregulation of CD23 expression, follicular B cell numbers were based on the gate for B220+ IgD+ IgMint. The full gating strategy is shown in Supplementary Fig. 8A. Data are representative of 7–10 mice per genotype. b Absolute cell numbers are graphed as the mean ± s.d. P-values compare the indicated samples (two tailed t-test). Each circle represents the results from an individual mouse. *P < 0.05, **P < 0.01, ****P < 0.0001
Fig. 1 PU.1 and SpiB regulate follicular B cell numbers. a Flow cytometric analysis of splenocytes from control (Cd23 T/+), PU.1 cKO (Spi1 fl/fl Cd23 T/+), SpiB KO (Spi1 fl/fl Cd23 +/+ Spib −/−) and PU.1 SpiB DKO (Spi1 fl/fl Cd23 T/+ Spib −/−) mice showing the abbreviated gating strategy for the detection of follicular (Fo) B cells (B220+ IgD+ IgMint) and MZ (B220+ IgM+ IgDlow CD21+) B cells. As the loss of PU.1 and SpiB leads to the downregulation of CD23 expression, follicular B cell numbers were based on the gate for B220+ IgD+ IgMint. The full gating strategy is shown in Supplementary Fig. 8A. Data are representative of 7–10 mice per genotype. b Absolute cell numbers are graphed as the mean ± s.d. P-values compare the indicated samples (two tailed t-test). Each circle represents the results from an individual mouse. *P < 0.05, **P < 0.01, ****P < 0.0001CC BY · PubMed Central
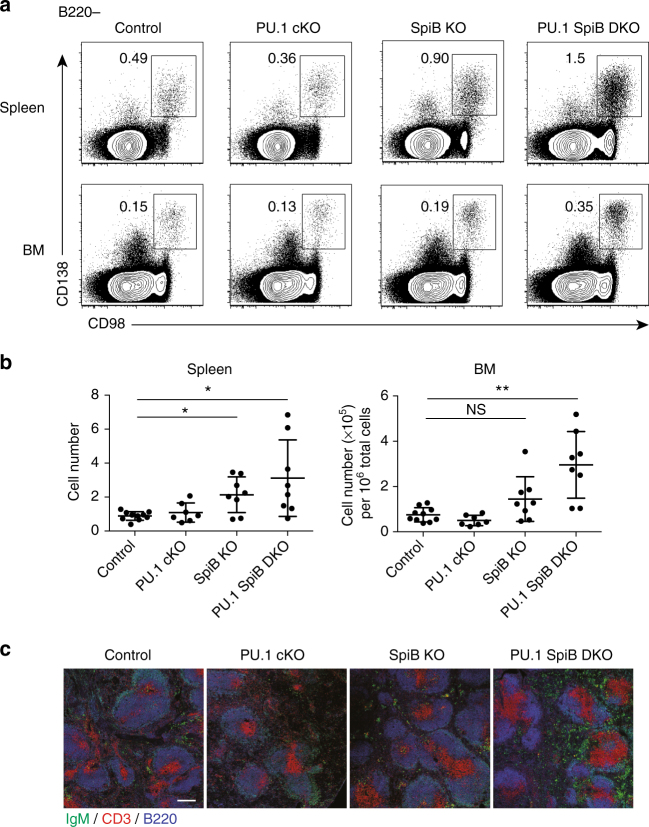
Fig. 2 Increased plasma cell frequency in PU.1 SpiB DKO mice. a Flow cytometric analysis of splenocytes and bone marrow from mice of the indicated genotype for the detection of plasma cells (B220− CD138+ CD98+). Data are representative of 7–10 mice per genotype. The full gating strategy is shown in Supplementary Fig. 8B. b Absolute numbers (for spleen) and proportion (for bone marrow) of plasma cells are graphed as the mean ± s.d. P-values compare the indicated samples (two tailed t-test). Each circle represents the results from an individual mouse. *P < 0.05, **P < 0.01. c Immunofluorescence of spleen sections of each of the four genotypes stained for T cells (CD3, red), B cells (B220, blue) and antibody-secreting cells (IgMhigh, green). Scale bar = 200 μm
Fig. 2 Increased plasma cell frequency in PU.1 SpiB DKO mice. a Flow cytometric analysis of splenocytes and bone marrow from mice of the indicated genotype for the detection of plasma cells (B220− CD138+ CD98+). Data are representative of 7–10 mice per genotype. The full gating strategy is shown in Supplementary Fig. 8B. b Absolute numbers (for spleen) and proportion (for bone marrow) of plasma cells are graphed as the mean ± s.d. P-values compare the indicated samples (two tailed t-test). Each circle represents the results from an individual mouse. *P < 0.05, **P < 0.01. c Immunofluorescence of spleen sections of each of the four genotypes stained for T cells (CD3, red), B cells (B220, blue) and antibody-secreting cells (IgMhigh, green). Scale bar = 200 μmCC BY · PubMed Central
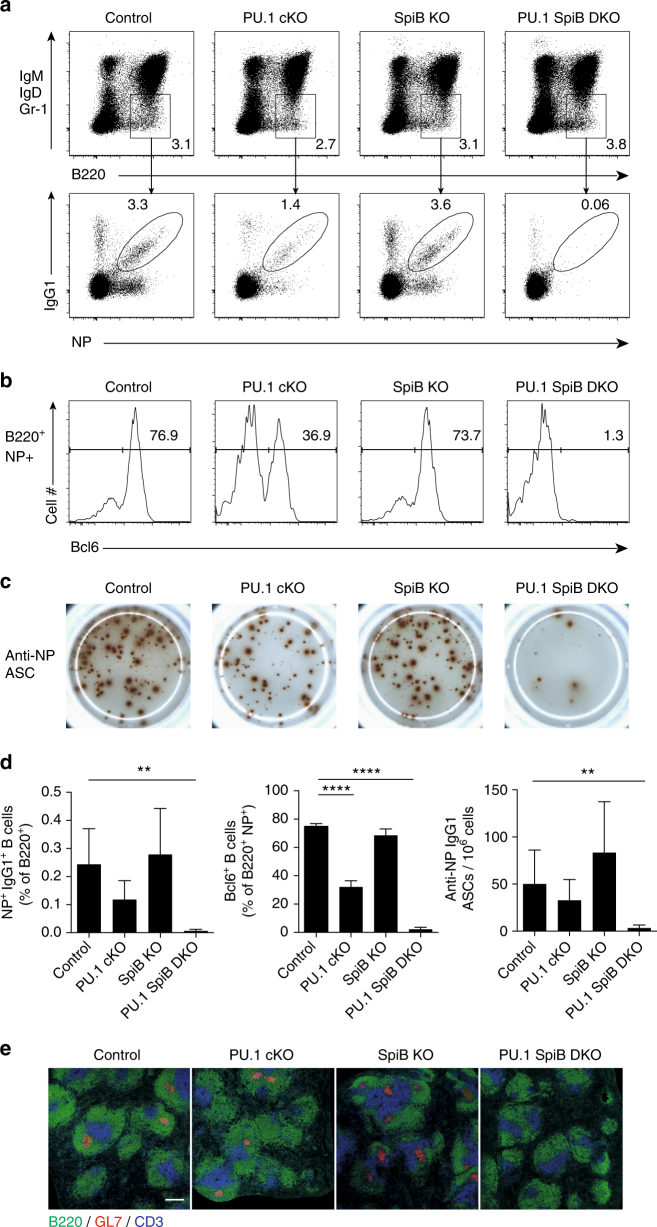
Fig. 3 Deletion of PU.1 and SpiB abrogates the GC response. Mice of the indicated genotypes were immunized with NP-KLH in alum and analyzed 14 days later. a, b Flow cytometric analysis of splenocytes. Isotype switched B cells (B220+IgM− IgD−Gr-1−) were analyzed for a NP+ IgG1+ status and b Bcl6. Numbers in a, b are the proportion of cells in the indicated gates. The full gating strategies are shown in Supplementary Fig. 8C, D. c Representative ELISpots show the number of NP-specific IgG1+ antibody-secreting cells (ASC) per million splenocytes plated. Data are representative of 5 or 6 mice per genotype from 2 independent experiments d Frequencies of NP+ IgG1+ B cells are shown relative to total B220+ cells (left), proportion of B220+ NP+ cells expressing Bcl6 (middle), frequency of total NP-specific IgG1 secreting ASC in the spleen per million cells (right) are shown. Data are graphed as mean ± s.d. of between five and six mice per genotype from two independent experiments. P-values compare the indicated samples (two tailed t-test). **P < 0.01, ****P < 0.0001. e Spleen sections from mice of each of the genotypes examined mice were stained with antibodies to CD3 to detect T cells (blue), B220 to identify B cell follicles (green) and GL7 for GCs (red). Scale bar = 200 μm
Fig. 3 Deletion of PU.1 and SpiB abrogates the GC response. Mice of the indicated genotypes were immunized with NP-KLH in alum and analyzed 14 days later. a, b Flow cytometric analysis of splenocytes. Isotype switched B cells (B220+IgM− IgD−Gr-1−) were analyzed for a NP+ IgG1+ status and b Bcl6. Numbers in a, b are the proportion of cells in the indicated gates. The full gating strategies are shown in Supplementary Fig. 8C, D. c Representative ELISpots show the number of NP-specific IgG1+ antibody-secreting cells (ASC) per million splenocytes plated. Data are representative of 5 or 6 mice per genotype from 2 independent experiments d Frequencies of NP+ IgG1+ B cells are shown relative to total B220+ cells (left), proportion of B220+ NP+ cells expressing Bcl6 (middle), frequency of total NP-specific IgG1 secreting ASC in the spleen per million cells (right) are shown. Data are graphed as mean ± s.d. of between five and six mice per genotype from two independent experiments. P-values compare the indicated samples (two tailed t-test). **P < 0.01, ****P < 0.0001. e Spleen sections from mice of each of the genotypes examined mice were stained with antibodies to CD3 to detect T cells (blue), B220 to identify B cell follicles (green) and GL7 for GCs (red). Scale bar = 200 μmCC BY · PubMed Central
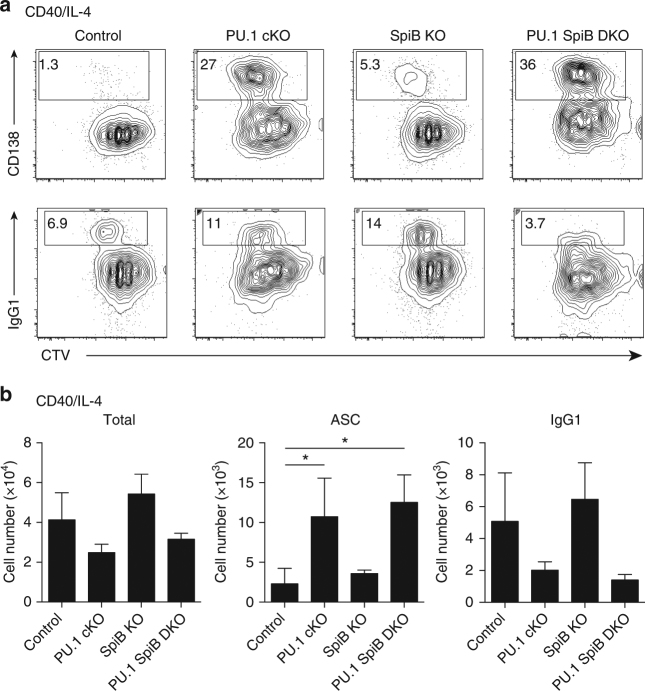
Fig. 4 PU.1 and SpiB repress antibody-secreting cell differentiation in vitro. a Resting lymph node B cells from mice of the indicated genotype were labeled with CTV and cultured in the presence of CD40 L + IL-4 for 4d before flow cytometric analysis. Numbers in the boxes are the proportion of CD138+ ASC or IgG1+ B cells. The full gating strategy is shown in Supplementary Fig. 9A. Data are representative of three independent experiments. b Quantitation of the total cell number (left), total number of ASCs (middle) and IgG1+ cells (right) cultured as in a is shown after 4d of culture. Data are the mean ± s.d. for three independent experiments. P-values compare the indicated samples (two tailed t-test). *P < 0.05
Fig. 4 PU.1 and SpiB repress antibody-secreting cell differentiation in vitro. a Resting lymph node B cells from mice of the indicated genotype were labeled with CTV and cultured in the presence of CD40 L + IL-4 for 4d before flow cytometric analysis. Numbers in the boxes are the proportion of CD138+ ASC or IgG1+ B cells. The full gating strategy is shown in Supplementary Fig. 9A. Data are representative of three independent experiments. b Quantitation of the total cell number (left), total number of ASCs (middle) and IgG1+ cells (right) cultured as in a is shown after 4d of culture. Data are the mean ± s.d. for three independent experiments. P-values compare the indicated samples (two tailed t-test). *P < 0.05CC BY · PubMed Central
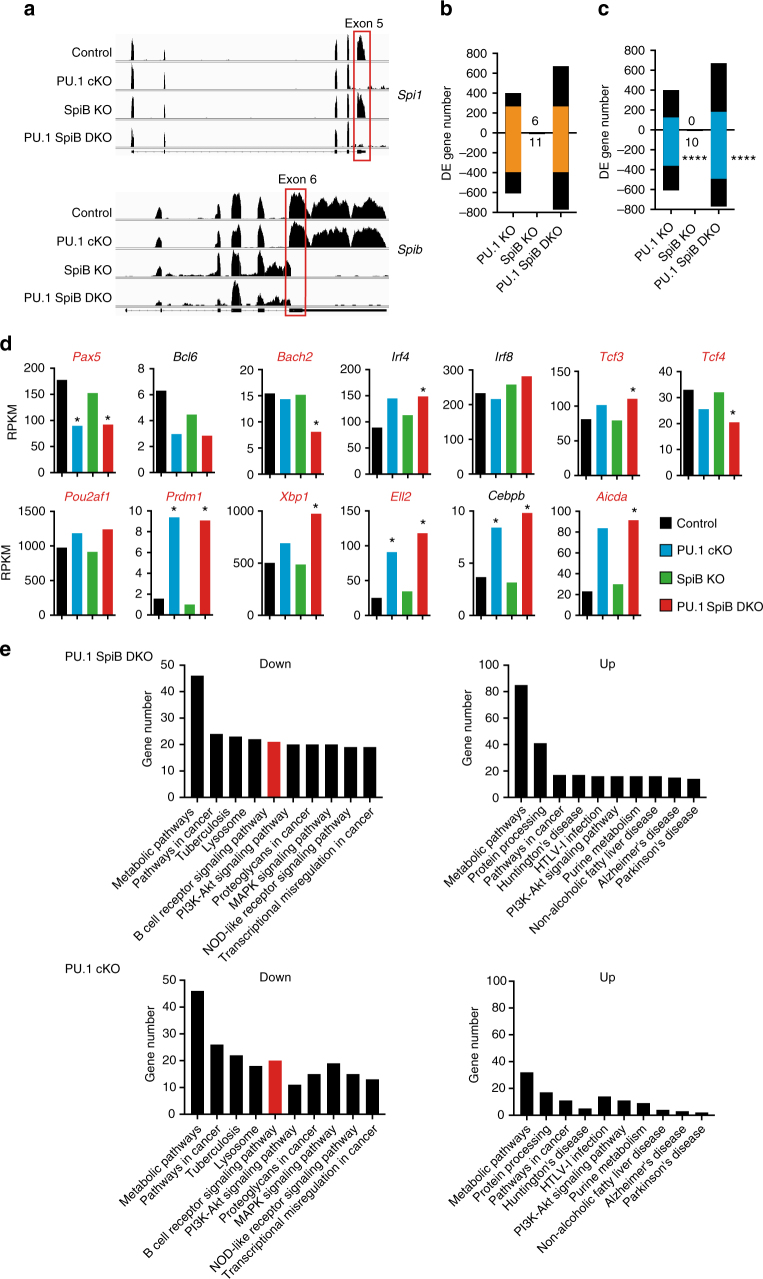
Fig. 5 The transcriptional changes associated with the loss of PU.1 and SpiB. Resting lymph node B cells from mice of the indicated genotype were cultured in the presence of CD40 L + IL-4 for 48 h. RNA was extracted and whole transcriptome sequencing performed on duplicates of each cell population. a The read coverage showing deletion of exon 5 of Spi1 (PU.1) and exon 6 of Spib in the appropriate genotypes is shown mapped to the exon-intron structure. b, c The number of differentially expressed (DE) genes (defined as log2 fold change >0.6-fold, log2 RPKM (reads per kilobase of exon model per million mapped reads) >0, P < 0.15) identified for each genotype is shown relative to control B cells. Genes upregulated in the absence of the indicated transcription factor(s) are shown by bars above the line while genes down regulated are shown below. Values indicate the number of DE genes from SpiB KO cells. The identity of the DE genes is provided in Supplementary Data. b Orange bars show the number of DE genes common between the PU.1 cKO and PU.1 SpiB DKO genotypes. c Blue bars show the number of DE genes that have PU.1 peaks (P < 10−6). P-values indicate the enrichment of PU.1 binding in down regulated DE genes compared to the total binding of PU.1 in non-DE genes using a Chi-square test. ****P < 0.0001. d The expression (in RPKM) of important regulators of mature B cell and antibody-secreting cell biology is shown for each of the four genotypes examined. *Indicates genes that are DE relative to controls (as defined in a). Gene names with PU.1 peaks (P < 10−6) are indicated in red. e KEGG pathway analysis of genes regulated by PU.1 and PU.1/SpiB. Genes were first divided into those that were down or upregulated in the indicated genotypes. The number of genes that are associated with each statistically enriched (P < 0.05) functional category is shown
Fig. 5 The transcriptional changes associated with the loss of PU.1 and SpiB. Resting lymph node B cells from mice of the indicated genotype were cultured in the presence of CD40 L + IL-4 for 48 h. RNA was extracted and whole transcriptome sequencing performed on duplicates of each cell population. a The read coverage showing deletion of exon 5 of Spi1 (PU.1) and exon 6 of Spib in the appropriate genotypes is shown mapped to the exon-intron structure. b, c The number of differentially expressed (DE) genes (defined as log2 fold change >0.6-fold, log2 RPKM (reads per kilobase of exon model per million mapped reads) >0, P < 0.15) identified for each genotype is shown relative to control B cells. Genes upregulated in the absence of the indicated transcription factor(s) are shown by bars above the line while genes down regulated are shown below. Values indicate the number of DE genes from SpiB KO cells. The identity of the DE genes is provided in Supplementary Data. b Orange bars show the number of DE genes common between the PU.1 cKO and PU.1 SpiB DKO genotypes. c Blue bars show the number of DE genes that have PU.1 peaks (P < 10−6). P-values indicate the enrichment of PU.1 binding in down regulated DE genes compared to the total binding of PU.1 in non-DE genes using a Chi-square test. ****P < 0.0001. d The expression (in RPKM) of important regulators of mature B cell and antibody-secreting cell biology is shown for each of the four genotypes examined. *Indicates genes that are DE relative to controls (as defined in a). Gene names with PU.1 peaks (P < 10−6) are indicated in red. e KEGG pathway analysis of genes regulated by PU.1 and PU.1/SpiB. Genes were first divided into those that were down or upregulated in the indicated genotypes. The number of genes that are associated with each statistically enriched (P < 0.05) functional category is shownCC BY · PubMed Central
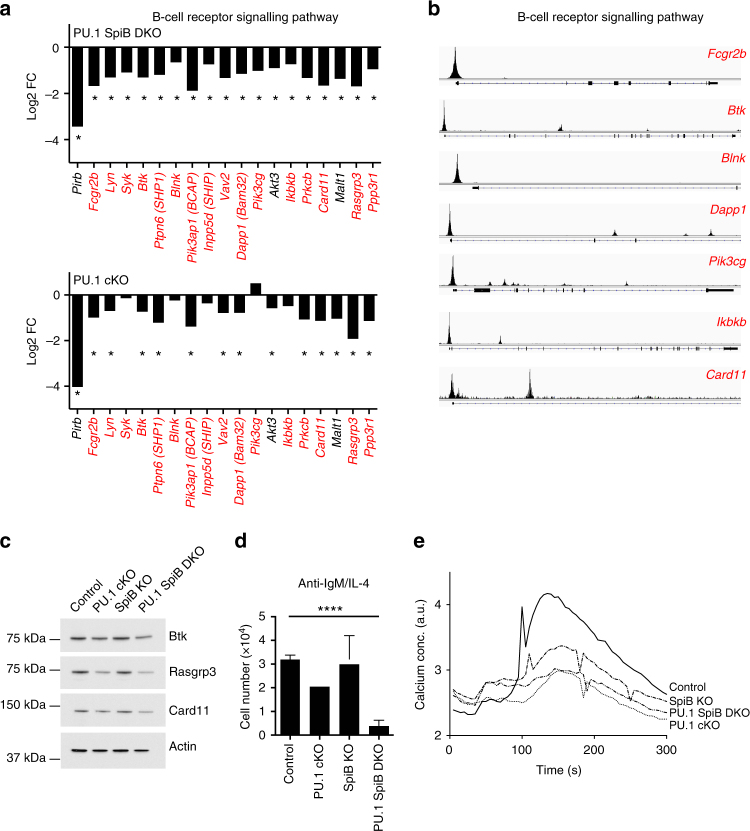
Fig. 6 PU.1 and SpiB maintain expression of multiple BCR components. a Gene expression (from Fig. 5) for the indicated genotype is plotted as the mean fold change (log2, from 2 experiments) relative to the expression in the control genotype. *Indicates genes that are DE relative to controls (defined as log2 fold change >0.6-fold, log2 RPKM (reads per kilobase of exon model per million mapped reads) >0, P < 0.15). b PU.1 ChIPseq identifies promoter-binding sites for PU.1 in many components of the BCR signaling pathway. Gene structures are shown below. Gene names in a, b with PU.1 peaks (P < 10−6) are indicated in red. c Lysates were generated from activated B cells (cultured for 48 h in CD40 L + IL-4) of the indicated genotype. Western blotting was performed for the indicated proteins. Actin serves as a control for protein loading. Data in b, c are representative of two experiments each. d Loss of PU.1 and SpiB leads to decreased viability in response to BCR signaling. Resting lymph node B cells from mice of the indicated genotype were labeled with CTV and cultured in the presence of anti-IgM + IL-4 for 3d before flow cytometric analysis. The number of live cells is plotted for each genotype examined. Data are the mean ± s.d. for three independent experiments. P-values compare the indicated samples (two tailed t-test). ****P < 0.0001. e Resting B cells of the indicated genotype were cultured with CD40 L + IL-4 for 48 h before being washed and rested for one hour. Cells were then loaded with Indo-1 AM before basal fluorescence was measured for 30 s. Anti-IgM was then added and fluorescence changes recorded for an additional 2.5 min. Results are presented as arbitrary units of changes in fluorescence ratio over time. Data are representative of two experiments
Fig. 6 PU.1 and SpiB maintain expression of multiple BCR components. a Gene expression (from Fig. 5) for the indicated genotype is plotted as the mean fold change (log2, from 2 experiments) relative to the expression in the control genotype. *Indicates genes that are DE relative to controls (defined as log2 fold change >0.6-fold, log2 RPKM (reads per kilobase of exon model per million mapped reads) >0, P < 0.15). b PU.1 ChIPseq identifies promoter-binding sites for PU.1 in many components of the BCR signaling pathway. Gene structures are shown below. Gene names in a, b with PU.1 peaks (P < 10−6) are indicated in red. c Lysates were generated from activated B cells (cultured for 48 h in CD40 L + IL-4) of the indicated genotype. Western blotting was performed for the indicated proteins. Actin serves as a control for protein loading. Data in b, c are representative of two experiments each. d Loss of PU.1 and SpiB leads to decreased viability in response to BCR signaling. Resting lymph node B cells from mice of the indicated genotype were labeled with CTV and cultured in the presence of anti-IgM + IL-4 for 3d before flow cytometric analysis. The number of live cells is plotted for each genotype examined. Data are the mean ± s.d. for three independent experiments. P-values compare the indicated samples (two tailed t-test). ****P < 0.0001. e Resting B cells of the indicated genotype were cultured with CD40 L + IL-4 for 48 h before being washed and rested for one hour. Cells were then loaded with Indo-1 AM before basal fluorescence was measured for 30 s. Anti-IgM was then added and fluorescence changes recorded for an additional 2.5 min. Results are presented as arbitrary units of changes in fluorescence ratio over time. Data are representative of two experimentsCC BY · PubMed Central
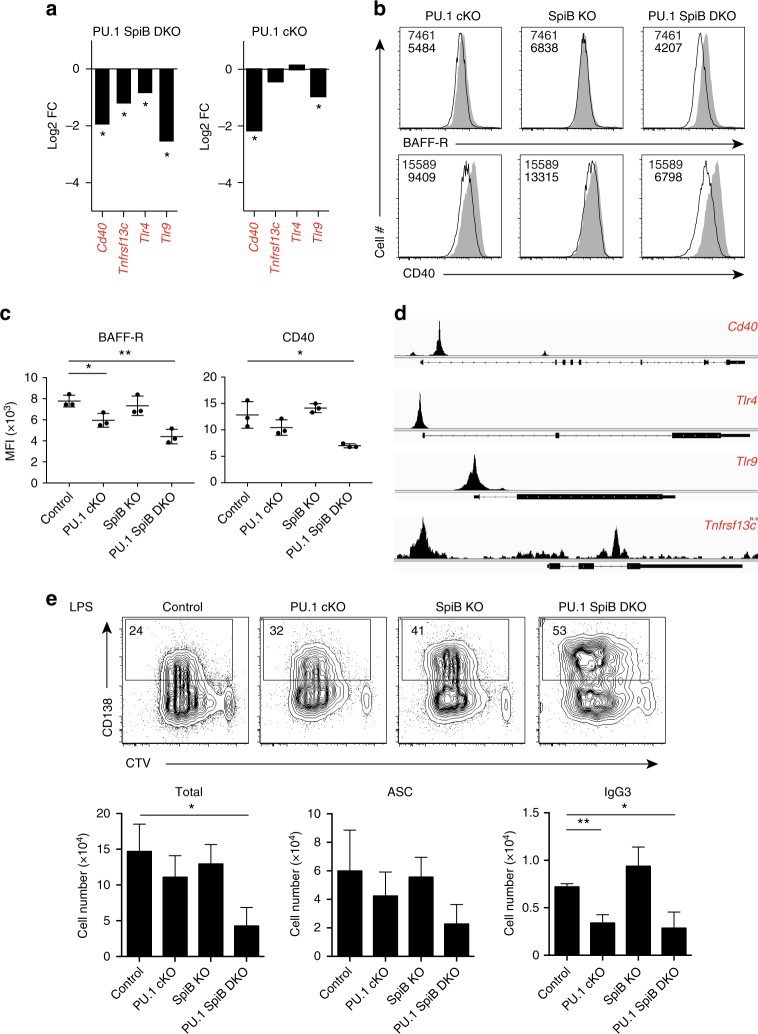
Fig. 7 PU.1 and SpiB are required to maintain the expression of several immune sensors. a Gene expression (from Fig. 5) for the indicated genotype is plotted as the mean fold change (log2, from 2 experiments) relative to the expression in the control genotype. *Indicates genes that are DE relative to controls (defined as log2 fold change >0.6-fold, log2 RPKM (reads per kilobase of exon model per million mapped reads) >0, P < 0.15). b Flow cytometric analysis showing the expression of BAFF-R or CD40 on activated B cells of the indicated genotype (black line), relative to control B cells (solid gray), 48 h after stimulation with CD40 L + IL-4. c Mean fluorescence intensity (MFI) is graphed as the mean ± s.d. Each circle represents the results from an individual mouse. P-values compare the indicated samples (two tailed t-test). *P < 0.05, **P < 0.01. Data in b, c are from 3 experiments. d ChIPseq identifies proximal promoter-binding sites for PU.1 for the genes shown in a. Gene structures are shown below. Gene names in a, d with PU.1 peaks (P < 10−6) are indicated in red. Data are representative of two experiments. e Impaired survival of PU.1 SpiB DKO B cells in response to the TLR4 agonist LPS. Resting lymph node B cells from mice of the indicated genotype were labeled with CTV and cultured in the presence of LPS for 4d before flow cytometric analysis. Numbers in the boxes are the proportion of CD138+ antibody-secreting cells (ASC). Data are representative of 3 experiments. Quantitation of the total cell number (left), total number of ASCs (middle) and IgG3+ cells (right) is shown in the lower graphs. Data are the mean ± s.d. for three independent experiments. P-values compare the indicated samples (two tailed t-test). *P < 0.05, **P < 0.01. The full gating strategies are shown in Supplementary Fig. 9A and B, respectively
Fig. 7 PU.1 and SpiB are required to maintain the expression of several immune sensors. a Gene expression (from Fig. 5) for the indicated genotype is plotted as the mean fold change (log2, from 2 experiments) relative to the expression in the control genotype. *Indicates genes that are DE relative to controls (defined as log2 fold change >0.6-fold, log2 RPKM (reads per kilobase of exon model per million mapped reads) >0, P < 0.15). b Flow cytometric analysis showing the expression of BAFF-R or CD40 on activated B cells of the indicated genotype (black line), relative to control B cells (solid gray), 48 h after stimulation with CD40 L + IL-4. c Mean fluorescence intensity (MFI) is graphed as the mean ± s.d. Each circle represents the results from an individual mouse. P-values compare the indicated samples (two tailed t-test). *P < 0.05, **P < 0.01. Data in b, c are from 3 experiments. d ChIPseq identifies proximal promoter-binding sites for PU.1 for the genes shown in a. Gene structures are shown below. Gene names in a, d with PU.1 peaks (P < 10−6) are indicated in red. Data are representative of two experiments. e Impaired survival of PU.1 SpiB DKO B cells in response to the TLR4 agonist LPS. Resting lymph node B cells from mice of the indicated genotype were labeled with CTV and cultured in the presence of LPS for 4d before flow cytometric analysis. Numbers in the boxes are the proportion of CD138+ antibody-secreting cells (ASC). Data are representative of 3 experiments. Quantitation of the total cell number (left), total number of ASCs (middle) and IgG3+ cells (right) is shown in the lower graphs. Data are the mean ± s.d. for three independent experiments. P-values compare the indicated samples (two tailed t-test). *P < 0.05, **P < 0.01. The full gating strategies are shown in Supplementary Fig. 9A and B, respectivelyCC BY · PubMed Central

Verification

Claims the paper makes

The claims and statistics of this paper haven’t been checked yet.

Run the check — free, no account needed. It reads the open-access text and checks the sources it cites.

A few free checks a day · papers already verified open instantly · results are public

Claims other papers make about this one

Each is checked against this paper’s own text: does it say what the citing paper says it does?

Self-check

Percentages, sums and reported differences re-computed from the paper’s own numbers.

The self-check needs the paper’s full text.

Citations

Cites

Show all 9 references

Research works printed but not linked: 42

  1. Rickert, R. C., Jellusova, J. & Miletic, A. V. Signaling by the tumor necrosis factor receptor superfamily in B-cell biology and disease. Immunol. Rev. 244, 115–133 (2011). · DOI
  2. Igarashi, K., Ochiai, K., Itoh-Nakadai, A. & Muto, A. Orchestration of plasma cell differentiation by Bach2 and its gene regulatory network. Immunol. Rev. 261, 116–125 (2014). · DOI
  3. Nera, K. P., Kylaniemi, M. K. & Lassila, O. Regulation of B cell to plasma cell transition within the follicular B cell response. Scand. J. Immunol. 82, 225–234 (2015). · DOI
  4. Nutt, S. L., Hodgkin, P. D., Tarlinton, D. M. & Corcoran, L. M. The generation of antibody-secreting plasma cells. Nat. Rev. Immunol. 15, 160–171 (2015). · DOI
  5. Carotta, S. et al. The transcription factors IRF8 and PU.1 negatively regulate plasma cell differentiation. J. Exp. Med. 211, 2169–2181 (2014). · DOI
  6. Xu, H. et al. Regulation of bifurcating B cell trajectories by mutual antagonism between transcription factors IRF4 and IRF8. Nat. Immunol. 16, 1274–1281 (2015). · DOI
  7. Turkistany, S. A. & DeKoter, R. P. The transcription factor PU.1 is a critical regulator of cellular communication in the immune system. Arch. Immunol. Ther. Exp. 59, 431–440 (2011). · DOI · Paper page
  8. Scott, E. W. et al. PU.1 functions in a cell-autonomous manner to control the differentiation of multipotential lymphoid-myeloid progenitors. Immunity 6, 437–447 (1997). · DOI · Paper page
  9. Scott, E. W., Simon, M. C., Anastasi, J. & Singh, H. Requirement of transcription factor PU.1 in the development of multiple hematopoietic lineages. Science 265, 1573–1577 (1994). · DOI · Paper page
  10. Polli, M. et al. The development of functional B lymphocytes in conditional PU.1 knock-out mice. Blood 106, 2083–2090 (2005). · DOI
  11. Sokalski, K. M. et al. Deletion of genes encoding PU.1 and Spi-B in B cells impairs differentiation and induces pre-B cell acute lymphoblastic leukemia. Blood 118, 2801–2808 (2011). · DOI
  12. Ye, M., Ermakova, O. & Graf, T. PU.1 is not strictly required for B cell development and its absence induces a B-2 to B-1 cell switch. J. Exp. Med. 202, 1411–1422 (2005). · DOI
  13. Ray-Gallet, D., Mao, C., Tavitian, A. & Moreau-Gachelin, F. DNA binding specificities of Spi-1/PU.1 and Spi-B transcription factors and identification of a Spi-1/Spi-B binding site in the c-fes/c-fps promoter. Oncogene 11, 303–313 (1995).
  14. Solomon, L. A., Li, S. K., Piskorz, J., Xu, L. S. & DeKoter, R. P. Genome-wide comparison of PU.1 and Spi-B binding sites in a mouse B lymphoma cell line. BMC Genomics 16, 76 (2015). · DOI
  15. Garrett-Sinha, L. A. et al. PU.1 and Spi-B are required for normal B cell receptor-mediated signal transduction. Immunity 10, 399–408 (1999). · DOI
  16. Lu, R., Medina, K. L., Lancki, D. W. & Singh, H. IRF-4,8 orchestrate the pre-B-to-B transition in lymphocyte development. Genes Dev. 17, 1703–1708 (2003). · DOI
  17. Kwon, K. et al. Instructive role of the transcription factor E2A in early B lymphopoiesis and germinal center B cell development. Immunity 28, 751–762 (2008). · DOI
  18. Su, G. H. et al. Defective B cell receptor-mediated responses in mice lacking the Ets protein, Spi-B. EMBO J. 16, 7118–7129 (1997). · DOI · Paper page
  19. DeKoter, R. P. et al. Regulation of follicular B cell differentiation by the related E26 transformation-specific transcription factors PU.1, Spi-B, and Spi-C. J. Immunol. 185, 7374–7384 (2010). · DOI
  20. Oliver, A. M., Martin, F., Gartland, G. L., Carter, R. H. & Kearney, J. F. Marginal zone B cells exhibit unique activation, proliferative and immunoglobulin secretory responses. Eur. J. Immunol. 27, 2366–2374 (1997). · DOI
  21. Lu, D. et al. The miR-155-PU.1 axis acts on Pax5 to enable efficient terminal B cell differentiation. J. Exp. Med. 211, 2183–2198 (2014). · DOI
  22. Hasbold, J., Corcoran, L. M., Tarlinton, D. M., Tangye, S. G. & Hodgkin, P. D. Evidence from the generation of immunoglobulin G-secreting cells that stochastic mechanisms regulate lymphocyte differentiation. Nat. Immunol. 5, 55–63 (2004). · DOI
  23. Minnich, M. et al. Multifunctional role of the transcription factor Blimp-1 in coordinating plasma cell differentiation. Nat. Immunol. 17, 331–343 (2016). · DOI
  24. Muto, A. et al. Bach2 represses plasma cell gene regulatory network in B cells to promote antibody class switch. EMBO J. 29, 4048–4061 (2010). · DOI
  25. Elgueta, R. et al. Molecular mechanism and function of CD40/CD40L engagement in the immune system. Immunol. Rev. 229, 152–172 (2009). · DOI
  26. Tellier, J. et al. Blimp-1 controls plasma cell function through the regulation of immunoglobulin secretion and the unfolded protein response. Nat. Immunol. 17, 323–330 (2016). · DOI
  27. Li, S. K., Abbas, A. K., Solomon, L. A., Groux, G. M. & DeKoter, R. P. Nfkb1 activation by the E26 transformation-specific transcription factors PU.1 and Spi-B promotes Toll-like receptor-mediated splenic B cell proliferation. Mol. Cell. Biol. 35, 1619–1632 (2015). · DOI
  28. Xu, L. S. et al. Regulation of B cell linker protein transcription by PU.1 and Spi-B in murine B cell acute lymphoblastic leukemia. J. Immunol. 189, 3347–3354 (2012). · DOI
  29. Mackay, F., Figgett, W. A., Saulep, D., Lepage, M. & Hibbs, M. L. B-cell stage and context-dependent requirements for survival signals from BAFF and the B-cell receptor. Immunol. Rev. 237, 205–225 (2010). · DOI
  30. Christie, D. A. et al. PU.1 opposes IL-7-dependent proliferation of developing B cells with involvement of the direct target gene bruton tyrosine kinase. J. Immunol. 194, 595–605 (2015). · DOI
  31. Muller, S. et al. Synergistic activation of the human Btk promoter by transcription factors Sp1/3 and PU.1. Biochem. Biophys. Res. Commun. 259, 364–369 (1999). · DOI
  32. Pillai, S. & Cariappa, A. The follicular versus marginal zone B lymphocyte cell fate decision. Nat. Rev. Immunol. 9, 767–777 (2009). · DOI
  33. Sasaki, I. et al. Spi-B is critical for plasmacytoid dendritic cell function and development. Blood 120, 4733–4743 (2012). · DOI
  34. DeKoter, R. P. et al. Regulation of the interleukin-7 receptor alpha promoter by the Ets transcription factors PU.1 and GA-binding protein in developing B cells. J. Biol. Chem. 282, 14194–14204 (2007). · DOI
  35. Zhang, D. E. et al. Function of PU.1 (Spi-1), C/EBP, and AML1 in early myelopoiesis: regulation of multiple myeloid CSF receptor promoters. Curr. Top. Microbiol. Immunol. 211, 137–147 (1996).
  36. Liao, Y., Smyth, G. K. & Shi, W. The Subread aligner: fast, accurate and scalable read mapping by seed-and-vote. Nucleic Acids Res. 41, e108 (2013). · DOI · Paper page
  37. Liao, Y., Smyth, G. K. & Shi, W. featureCounts: an efficient general purpose program for assigning sequence reads to genomic features. Bioinformatics 30, 923–930 (2014). · DOI · Paper page
  38. Law, C. W., Chen, Y., Shi, W. & Smyth, G. K. Voom: precision weights unlock linear model analysis tools for RNA-seq read counts. Genome Biol. 15, R29 (2014). · DOI · Paper page
  39. Ritchie, M. E. et al. limma powers differential expression analyses for RNA-sequencing and microarray studies. Nucleic Acids Res. 43, e47 (2015). · DOI · Paper page
  40. Smyth, G. K. Linear models and empirical bayes methods for assessing differential expression in microarray experiments. Stat. Appl. Genet. Mol. Biol. 3, Article3 (2004). · DOI · Paper page
  41. Kanehisa, M., Sato, Y., Kawashima, M., Furumichi, M. & Tanabe, M. KEGG as a reference resource for gene and protein annotation. Nucleic Acids Res. 44, D457–D462 (2016). · DOI · Paper page
  42. Kuleshov, M. V. et al. Enrichr: a comprehensive gene set enrichment analysis web server 2016 update. Nucleic Acids Res. 44, W90–W97 (2016). · DOI · Paper page

Cited by

Sorted by citations

Metadata

Authors
Willis, S. N., Tellier, J., Liao, Y., Trezise, S., Light, A., O’Donnell, K., Garrett-Sinha, L. A., Shi, W., Tarlinton, D. M., & Nutt, S. L.
Venue
Nature Communications
Published
2017-11-10
Volume
8
Issue
1
ISSN
2041-1723
Cited by
112
References
9
Language
en

About these checks

Registry, retraction, Cites and statistics results are computed, not judged, with one exception: a printed reference that no index lists is read once by a model before it counts as a citation error. Claims are extracted by a model and kept only when their quote appears verbatim in the text; each cited source is then checked, with a model’s help, for whether it says what the claim relies on. Those verdicts can be wrong — read the claim’s quote and the cited source before relying on one.

Statistics and arithmetic are recomputed, not judged.

Confidence bands are shown only for fields calibrated on our annotated test set. None is calibrated yet, so no band is shown.

What counts as a claim ›How we measure confidence ›How we check this ›

Are you an author, or do you see a problem with this page? Request a review