Cited by 101Muscle Physiology and DisordersNutrition and Health in AgingProtein Degradation and Inhibitors

The DOI matches its Crossref record; 71 of the 71 references it cites were found in a registry or an index.

Epigenetic targeting of bromodomain protein BRD4 counteracts cancer cachexia and prolongs survival

Open access

Abstract

Cancer cachexia is a devastating metabolic syndrome characterized by systemic inflammation and massive muscle and adipose tissue wasting. Although it is responsible for approximately one-third of cancer deaths, no effective therapies are available and the underlying mechanisms have not been fully elucidated. We previously identified the bromodomain and extra-terminal domain (BET) protein BRD4 as an epigenetic regulator of muscle mass. Here we show that the pan-BET inhibitor (+)-JQ1 protects tumor-bearing mice from body weight loss and muscle and adipose tissue wasting. Remarkably, in C26-tumor-bearing mice (+)-JQ1 administration dramatically prolongs survival, without directly affecting tumor growth. By ChIP-seq and ChIP analyses, we unveil that BET proteins directly promote the muscle atrophy program during cachexia. In addition, BET proteins are required to coordinate an IL6-dependent AMPK nuclear signaling pathway converging on FoxO3 transcription factor. Overall, these findings indicate that BET proteins may represent a promising therapeutic target in the management of cancer cachexia.

Overview

The claims and statistics of this paper haven’t been checked yet.

Run the check — free, no account needed. It reads the open-access text and checks the sources it cites.

A few free checks a day · papers already verified open instantly · results are public

Integrity signals

Registry

Crossref · 10.1038/s41467-017-01645-7

Cites

71 of 71 references verified0 citation errors · 0 not checkable

Statistics

Figures

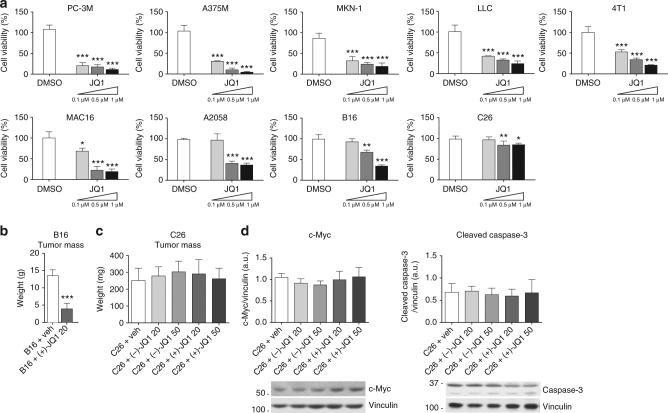
Fig. 1 Response to JQ1 in cancer cell lines used to study cancer cachexia. a Viability rates of JQ1-treated cells, calculated by measuring the viable cell number after 72 h in culture. Results are normalized to the proliferation of vehicle/DMSO-treated cells, set to 100% (n = 3). Statistical analysis was performed by using one-way ANOVA followed by Tukey’s post hoc test. Data represent means ± SD. *p < 0.05; **p < 0.01; ***p < 0.001 vs. DMSO. b Ten days after B16-tumor cells inoculation, mice were treated either with vehicle or (+)-JQ1 (20 mg/kg/day) for 10 days. Tumor weight after necropsy is shown. Animals per group: n = 7. Data represent means ± SD. Statistical analysis was performed by using Student’s unpaired t-test. ***p < 0.001 indicates statistical significance vs. B16 + veh. c Tumor weight at the day of sacrifice (day 12) in C26-tumor-bearing mice (animals per group: n = 10). Data represent means ± SD. Statistical analysis was performed by using one-way ANOVA followed by Tukey’s post hoc test. d c-Myc and cleaved-Caspase-3 levels were quantified by immunoblots using tumor whole extracts (animals per group: n = 4)
Fig. 1 Response to JQ1 in cancer cell lines used to study cancer cachexia. a Viability rates of JQ1-treated cells, calculated by measuring the viable cell number after 72 h in culture. Results are normalized to the proliferation of vehicle/DMSO-treated cells, set to 100% (n = 3). Statistical analysis was performed by using one-way ANOVA followed by Tukey’s post hoc test. Data represent means ± SD. *p < 0.05; **p < 0.01; ***p < 0.001 vs. DMSO. b Ten days after B16-tumor cells inoculation, mice were treated either with vehicle or (+)-JQ1 (20 mg/kg/day) for 10 days. Tumor weight after necropsy is shown. Animals per group: n = 7. Data represent means ± SD. Statistical analysis was performed by using Student’s unpaired t-test. ***p < 0.001 indicates statistical significance vs. B16 + veh. c Tumor weight at the day of sacrifice (day 12) in C26-tumor-bearing mice (animals per group: n = 10). Data represent means ± SD. Statistical analysis was performed by using one-way ANOVA followed by Tukey’s post hoc test. d c-Myc and cleaved-Caspase-3 levels were quantified by immunoblots using tumor whole extracts (animals per group: n = 4)CC BY · PubMed Central
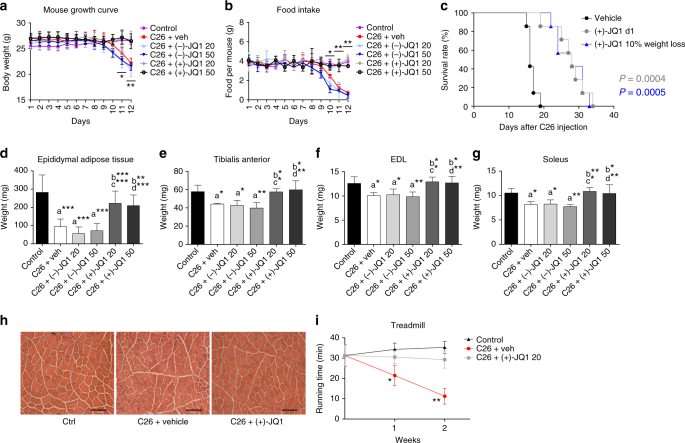
Fig. 2 JQ1 prolongs survival, and prevents muscle and white fat wasting. a Body weight chart of control, vehicle, (−)-JQ1, and (+)-JQ1-treated C26-tumor-bearing mice. Day 0: tumor implantation. Day 1: JQ1 treatment started. Age-matched normal control mice were treated with vehicle (animals per group: n = 10). Data represent means ± SD. Statistical significance refers to (+)-JQ1-treated animals vs. vehicle and (−)-JQ1-treated animals. b Chart displaying food intake in the six animal groups described in a. Data represent means ± SD. Statistical significance refers to (+)-JQ1-treated animals vs. vehicle and (−)-JQ1-treated animals. c Survival rate of C26-tumor-bearing mice was measured in two animal groups: vehicle (veh) and (+)-JQ1 20 mg/kg/day. Treatment was started either at day 1 (gray line) or when the average weight loss was 10% (blue line) (animals per group: n = 7). d Epididymal adipose tissue was weighted at day of sacrifice (day 12) in the six animal groups (animals per group: n = 10). Data represent means ± SD. e–g TA, EDL, and soleus were weighted 12 days after C26 cell implantation (animals per group: n = 10). Data represent means ± SD. h TA muscle morphology of Ctrl and C26-tumor-bearing mice treated with vehicle and (+)-JQ1 (animals per group: n = 3). (+)-JQ1 was administered at the dose of 20 mg/kg/day. Scale bar: 100 μm. i Treadmill test was performed on control and C26-tumor-bearing mice treated with (−)-JQ1 and (+)-JQ1 (20 mg/kg/day) at days 7 and 14 (animals per group: n = 4). Data represent means ± SD. Statistical significance refers to (+)-JQ1-treated animals vs. vehicle and (−)-JQ1-treated animals. *p < 0.05; **p < 0.01; ***p < 0.001. “a” indicates statistical significance compared to control; “b” indicates statistical significance compared to C26 + vehicle; “c” indicates statistical significance compared to C26 + (−)-JQ1 20 mg/kg/day; “d” indicates statistical significance compared to C26 + (−)-JQ1 50 mg/kg/day. Statistical analysis was performed by using one-way ANOVA followed by Tukey’s post hoc test in a, b, d–g, and i log-rank (Mantel–Cox) test in c
Fig. 2 JQ1 prolongs survival, and prevents muscle and white fat wasting. a Body weight chart of control, vehicle, (−)-JQ1, and (+)-JQ1-treated C26-tumor-bearing mice. Day 0: tumor implantation. Day 1: JQ1 treatment started. Age-matched normal control mice were treated with vehicle (animals per group: n = 10). Data represent means ± SD. Statistical significance refers to (+)-JQ1-treated animals vs. vehicle and (−)-JQ1-treated animals. b Chart displaying food intake in the six animal groups described in a. Data represent means ± SD. Statistical significance refers to (+)-JQ1-treated animals vs. vehicle and (−)-JQ1-treated animals. c Survival rate of C26-tumor-bearing mice was measured in two animal groups: vehicle (veh) and (+)-JQ1 20 mg/kg/day. Treatment was started either at day 1 (gray line) or when the average weight loss was 10% (blue line) (animals per group: n = 7). d Epididymal adipose tissue was weighted at day of sacrifice (day 12) in the six animal groups (animals per group: n = 10). Data represent means ± SD. e–g TA, EDL, and soleus were weighted 12 days after C26 cell implantation (animals per group: n = 10). Data represent means ± SD. h TA muscle morphology of Ctrl and C26-tumor-bearing mice treated with vehicle and (+)-JQ1 (animals per group: n = 3). (+)-JQ1 was administered at the dose of 20 mg/kg/day. Scale bar: 100 μm. i Treadmill test was performed on control and C26-tumor-bearing mice treated with (−)-JQ1 and (+)-JQ1 (20 mg/kg/day) at days 7 and 14 (animals per group: n = 4). Data represent means ± SD. Statistical significance refers to (+)-JQ1-treated animals vs. vehicle and (−)-JQ1-treated animals. *p < 0.05; **p < 0.01; ***p < 0.001. “a” indicates statistical significance compared to control; “b” indicates statistical significance compared to C26 + vehicle; “c” indicates statistical significance compared to C26 + (−)-JQ1 20 mg/kg/day; “d” indicates statistical significance compared to C26 + (−)-JQ1 50 mg/kg/day. Statistical analysis was performed by using one-way ANOVA followed by Tukey’s post hoc test in a, b, d–g, and i log-rank (Mantel–Cox) test in cCC BY · PubMed Central
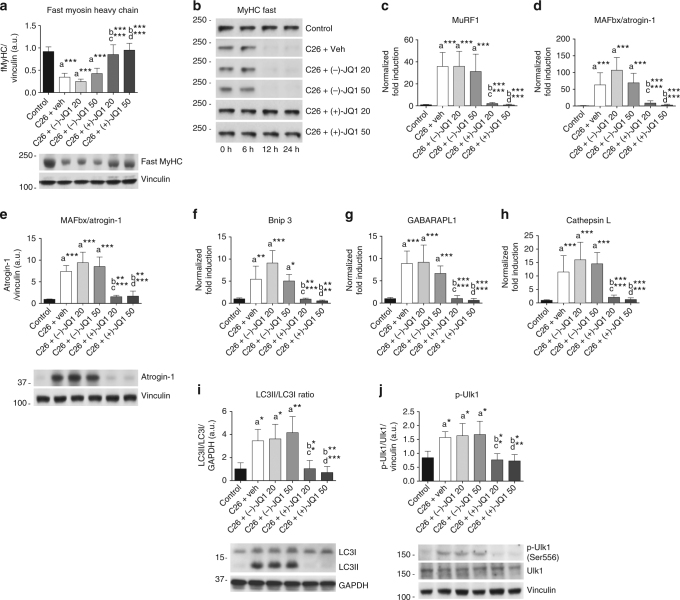
Fig. 3 Muscle proteolysis and autophagy are hindered by JQ1 administration. a Representative immunoblot showing fast myosin heavy chain (MyHC) protein expression in TA whole extracts from the six animal groups. Upper panel shows quantification of immunoblot bands from four animals per group. Data represent means ± SD. b TA extracts from control and C26-tumor-bearing mice (animals per group: n = 3) were used in an in vitro degradation assay to reveal fast MyHC degradation in control vs. tumor-bearing mice treated with vehicle or JQ1 (−/+). c, d Total RNA was extracted from TA muscles from control and C26-tumor-bearing mice (animals per group: n = 10) treated with vehicle or JQ1 (−/+) and expression levels of MuRF1, MAFbx/Atrogin-1 were measured by quantitative RT-PCR. Data represent means ± SD. e Representative western blot of MAFbx/Atrogin-1 on TA whole extracts (animals per group: n = 4). Bands quantifications are shown in the upper panel. Data represent means ± SD. f–h Quantitative RT-PCR of autophagy genes (Bnip3, GABARAPL1, Cathepsin L) from control and C26-tumor-bearing mice. Ten animals were used for each experimental group. Data represent means ± SD. i, j Representative western blot for LC3 and p-Ulk1 in TA extracts of control and C26-tumor-bearing mice (animals per group: n = 4). Upper panel: quantification of normalized band intensity. Data represent means ± SD. Statistical analysis was performed by using one-way ANOVA followed by Tukey’s post hoc test. *p < 0.05; **p < 0.01; ***p < 0.001. “a” indicates statistical significance compared to control; “b” indicates statistical significance compared to C26 + vehicle; “c” indicates statistical significance compared to C26 + (−)-JQ1 20 mg/kg/day; “d” indicates statistical significance compared to C26 + (−)-JQ1 50 mg/kg/day
Fig. 3 Muscle proteolysis and autophagy are hindered by JQ1 administration. a Representative immunoblot showing fast myosin heavy chain (MyHC) protein expression in TA whole extracts from the six animal groups. Upper panel shows quantification of immunoblot bands from four animals per group. Data represent means ± SD. b TA extracts from control and C26-tumor-bearing mice (animals per group: n = 3) were used in an in vitro degradation assay to reveal fast MyHC degradation in control vs. tumor-bearing mice treated with vehicle or JQ1 (−/+). c, d Total RNA was extracted from TA muscles from control and C26-tumor-bearing mice (animals per group: n = 10) treated with vehicle or JQ1 (−/+) and expression levels of MuRF1, MAFbx/Atrogin-1 were measured by quantitative RT-PCR. Data represent means ± SD. e Representative western blot of MAFbx/Atrogin-1 on TA whole extracts (animals per group: n = 4). Bands quantifications are shown in the upper panel. Data represent means ± SD. f–h Quantitative RT-PCR of autophagy genes (Bnip3, GABARAPL1, Cathepsin L) from control and C26-tumor-bearing mice. Ten animals were used for each experimental group. Data represent means ± SD. i, j Representative western blot for LC3 and p-Ulk1 in TA extracts of control and C26-tumor-bearing mice (animals per group: n = 4). Upper panel: quantification of normalized band intensity. Data represent means ± SD. Statistical analysis was performed by using one-way ANOVA followed by Tukey’s post hoc test. *p < 0.05; **p < 0.01; ***p < 0.001. “a” indicates statistical significance compared to control; “b” indicates statistical significance compared to C26 + vehicle; “c” indicates statistical significance compared to C26 + (−)-JQ1 20 mg/kg/day; “d” indicates statistical significance compared to C26 + (−)-JQ1 50 mg/kg/dayCC BY · PubMed Central
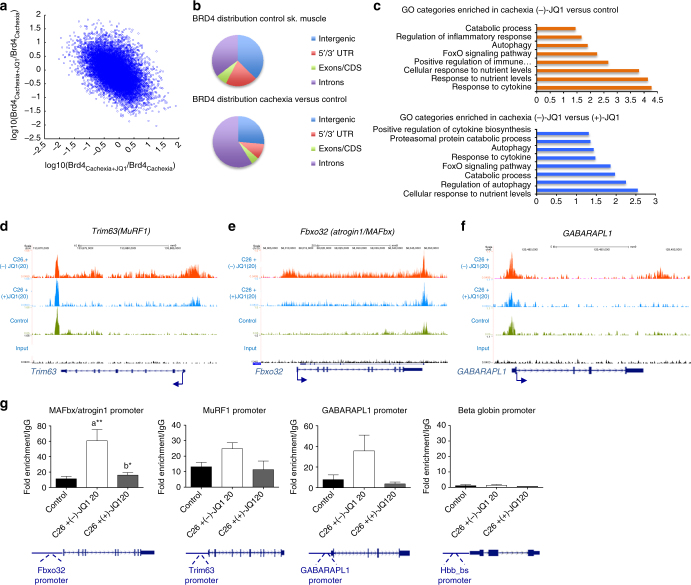
Fig. 4 BRD4 occupies catabolic genes regulatory regions in cachexia and its recruitment is impaired by JQ1 administration. a Scatter plot of log10 fold changes between BRD4cachexia and BRD4ctrl vs. fold changes between BRD4cachexia+JQ1 and BRD4cachexia for all enriched regions. The negative slope indicates the inhibitory effect of (+)-JQ1 on BRD4 occupancy reversing the cachexia effect on BRD4 occupancy. b Pie chart showing BRD4 distribution in control skeletal muscle (left panel) and cachectic muscles vs. control (right panel). c Selected functional categories of genes with higher BRD4 in skeletal muscle of (−)-JQ1-treated C26-tumor-bearing mice vs. control muscles (top panel) and in muscles from (−)-JQ1 vs. JQ1(+)-treated C26-tumor-bearing mice (bottom panel). d–f BRD4 ChIP-seq tracks of Trim63 (MuRF1), Fbxo32 (Atrogin1/MAFbx), and GABARAPL1 loci. Bottom to top: input, control muscles, muscles from C26-tumor-bearing mice treated with (+)-JQ1 and (−)-JQ1 (top). g RNAPolII ChIP qPCR at promoters of muscle catabolic genes. Beta globin gene was used as a negative control. IgG was used as a reference. n = 3.Statistical analysis was performed by using one-way ANOVA followed by Tukey’s post hoc test. Data represent means ± SEM. *p < 0.05; **p < 0.01. “a” indicates statistical significance compared to control; “b” indicates statistical significance compared to C26 + (−)-JQ1 20 mg/kg/day
Fig. 4 BRD4 occupies catabolic genes regulatory regions in cachexia and its recruitment is impaired by JQ1 administration. a Scatter plot of log10 fold changes between BRD4cachexia and BRD4ctrl vs. fold changes between BRD4cachexia+JQ1 and BRD4cachexia for all enriched regions. The negative slope indicates the inhibitory effect of (+)-JQ1 on BRD4 occupancy reversing the cachexia effect on BRD4 occupancy. b Pie chart showing BRD4 distribution in control skeletal muscle (left panel) and cachectic muscles vs. control (right panel). c Selected functional categories of genes with higher BRD4 in skeletal muscle of (−)-JQ1-treated C26-tumor-bearing mice vs. control muscles (top panel) and in muscles from (−)-JQ1 vs. JQ1(+)-treated C26-tumor-bearing mice (bottom panel). d–f BRD4 ChIP-seq tracks of Trim63 (MuRF1), Fbxo32 (Atrogin1/MAFbx), and GABARAPL1 loci. Bottom to top: input, control muscles, muscles from C26-tumor-bearing mice treated with (+)-JQ1 and (−)-JQ1 (top). g RNAPolII ChIP qPCR at promoters of muscle catabolic genes. Beta globin gene was used as a negative control. IgG was used as a reference. n = 3.Statistical analysis was performed by using one-way ANOVA followed by Tukey’s post hoc test. Data represent means ± SEM. *p < 0.05; **p < 0.01. “a” indicates statistical significance compared to control; “b” indicates statistical significance compared to C26 + (−)-JQ1 20 mg/kg/dayCC BY · PubMed Central
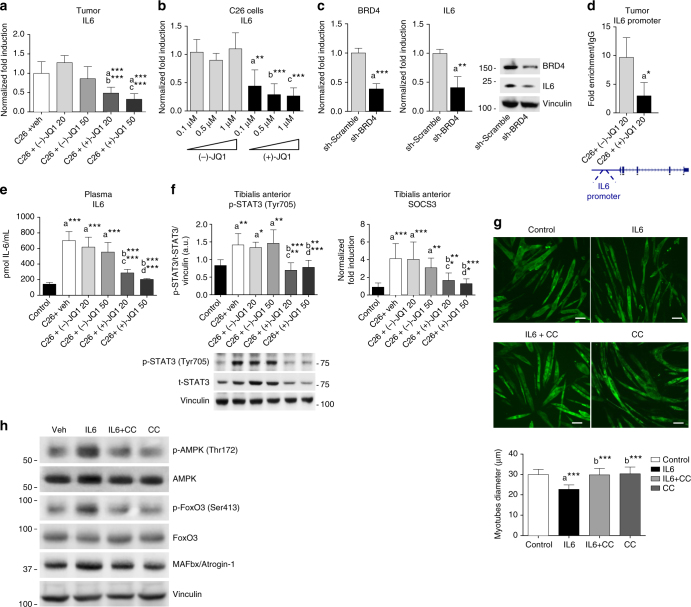
Fig. 5 JQ1 administration lowers circulating and tumor-producing IL6 levels. a Tumor-derived IL6 transcripts (means ± SD) were measured by quantitative RT-PCR. Statistical analysis: one-way ANOVA, Tukey’s post hoc test. ***p < 0.001. “a”, “b”, “c” indicate statistical significance vs. C26 + vehicle, C26 + (−)-JQ1 20 mg/kg/day and C26 + (−)-JQ1 50 mg/kg/day, respectively. b C26 cells were treated with different doses of (−)-JQ1 and (+)-JQ1, and IL6 transcripts were measured by qRT-PCR. Mean ± SD, n = 5. Statistical analysis: one-way ANOVA, Tukey’s post hoc test. **p < 0.01; ***p < 0.001. “a”, “b”, “c” indicate statistical significance vs. C26 cells treated with (−)-JQ1 0.1, 0.5, and 1 μM, respectively. c C26 cells were transduced with Sh-scramble or Sh-BRD4 retroviruses, and BRD4 and IL6 transcripts were measured by qRT-PCR. Mean ± SD, n = 5. Statistical analysis: Student’s unpaired t-test. **p < 0.01; ***p < 0.001. Right panel: BRD4 and IL6 immunoblots of Sh-Scramble and Sh-BRD4 C26 cells. d BRD4 recruitment at IL6 promoter was measured by ChIP in tumors from (−)-JQ1- and (+)-JQ1-treated (20 mg/kg/day) mice. Means ± SEM, n = 3. Statistical analysis: Student’s unpaired t-test. *p < 0.05. e ELISA on plasma IL6 in control and C26-bearing mice treated with vehicle, (−)-JQ1 and (+)-JQ1 at 20 and 50 mg/kg/day. n = 5. Statistical analysis: one-way ANOVA, Tukey’s post hoc test. ***p < 0.001. Data represent means ± SD. “a”, “b”, “c”, and “d” indicate statistical significance vs. control, C26 + vehicle, C26 + (−)-JQ1 20 mg/kg/day and C26 + (−)-JQ1 50 mg/kg/day, respectively. f p-STAT3 and SOCS3 were analyzed in TAs. Left panel: p-STAT3 (Tyr705) and t-STAT3 were evaluated by western blot. Means ± SD, n = 6. Right panel: SOCS3 levels were quantified by quantitative RT-PCR. Means ± SD, n = 8. Statistical analysis: one-way ANOVA, Tukey’s post hoc test. *p < 0.05; **p < 0.01; ***p < 0.001. “a”, “b”, “c”, and “d” indicate statistical significance as in e. g C2C12 myotubes were treated with IL6, Compound C/IL6, or Compound C alone for 48 h. Cells were immunostained with MyHC (MF20) antibody. Scale bar: 50 μm. Lower panel: average diameter size of myotubes. Means ± SD, n = 3. Statistical analysis: one-way ANOVA, Tukey’s post hoc test. ***p < 0.001. “a”, “b” indicates statistical significance vs. control and IL6-treated cells, respectively. h Cells were treated as in g and p-AMPK (Thr172), total AMPK, p-FoxO3 (Ser413), total FoxO3, and Atrogin1/MAFbx were analyzed by western blot. GAPDH serves as loading control (n = 3)
Fig. 5 JQ1 administration lowers circulating and tumor-producing IL6 levels. a Tumor-derived IL6 transcripts (means ± SD) were measured by quantitative RT-PCR. Statistical analysis: one-way ANOVA, Tukey’s post hoc test. ***p < 0.001. “a”, “b”, “c” indicate statistical significance vs. C26 + vehicle, C26 + (−)-JQ1 20 mg/kg/day and C26 + (−)-JQ1 50 mg/kg/day, respectively. b C26 cells were treated with different doses of (−)-JQ1 and (+)-JQ1, and IL6 transcripts were measured by qRT-PCR. Mean ± SD, n = 5. Statistical analysis: one-way ANOVA, Tukey’s post hoc test. **p < 0.01; ***p < 0.001. “a”, “b”, “c” indicate statistical significance vs. C26 cells treated with (−)-JQ1 0.1, 0.5, and 1 μM, respectively. c C26 cells were transduced with Sh-scramble or Sh-BRD4 retroviruses, and BRD4 and IL6 transcripts were measured by qRT-PCR. Mean ± SD, n = 5. Statistical analysis: Student’s unpaired t-test. **p < 0.01; ***p < 0.001. Right panel: BRD4 and IL6 immunoblots of Sh-Scramble and Sh-BRD4 C26 cells. d BRD4 recruitment at IL6 promoter was measured by ChIP in tumors from (−)-JQ1- and (+)-JQ1-treated (20 mg/kg/day) mice. Means ± SEM, n = 3. Statistical analysis: Student’s unpaired t-test. *p < 0.05. e ELISA on plasma IL6 in control and C26-bearing mice treated with vehicle, (−)-JQ1 and (+)-JQ1 at 20 and 50 mg/kg/day. n = 5. Statistical analysis: one-way ANOVA, Tukey’s post hoc test. ***p < 0.001. Data represent means ± SD. “a”, “b”, “c”, and “d” indicate statistical significance vs. control, C26 + vehicle, C26 + (−)-JQ1 20 mg/kg/day and C26 + (−)-JQ1 50 mg/kg/day, respectively. f p-STAT3 and SOCS3 were analyzed in TAs. Left panel: p-STAT3 (Tyr705) and t-STAT3 were evaluated by western blot. Means ± SD, n = 6. Right panel: SOCS3 levels were quantified by quantitative RT-PCR. Means ± SD, n = 8. Statistical analysis: one-way ANOVA, Tukey’s post hoc test. *p < 0.05; **p < 0.01; ***p < 0.001. “a”, “b”, “c”, and “d” indicate statistical significance as in e. g C2C12 myotubes were treated with IL6, Compound C/IL6, or Compound C alone for 48 h. Cells were immunostained with MyHC (MF20) antibody. Scale bar: 50 μm. Lower panel: average diameter size of myotubes. Means ± SD, n = 3. Statistical analysis: one-way ANOVA, Tukey’s post hoc test. ***p < 0.001. “a”, “b” indicates statistical significance vs. control and IL6-treated cells, respectively. h Cells were treated as in g and p-AMPK (Thr172), total AMPK, p-FoxO3 (Ser413), total FoxO3, and Atrogin1/MAFbx were analyzed by western blot. GAPDH serves as loading control (n = 3)CC BY · PubMed Central
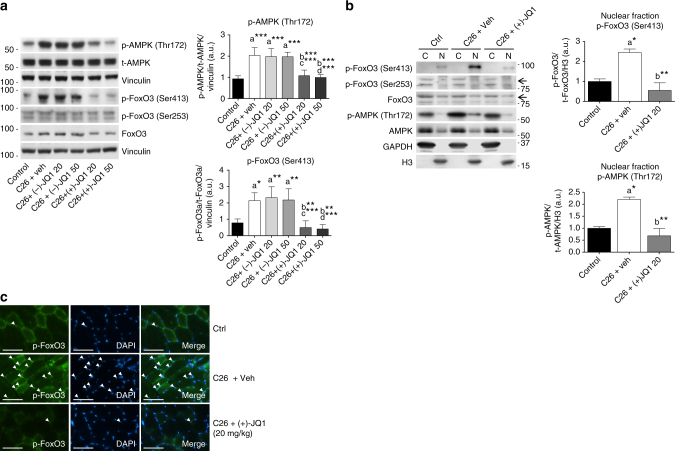
Fig. 6 p-FoxO3Ser413 and p-AMPKThr172 levels increase in muscles from cachectic mice. a Left panel: representative western blot of p-AMPK (Thr172) and total AMPK, p-FoxO3 (Ser413), p-FoxO3 (Ser253), total FoxO3 levels in TA extracts from control animals and tumor-bearing mice treated with vehicle, (−)-JQ1, and (+)-JQ1. Vinculin serves as loading control. Middle panel: average normalized values of band intensity for p-AMPK (Thr172). Right panel: average normalized values of band intensity for p-FoxO3 (Ser413) (animals per group: n = 4–6). Data represent means ± SD. Statistical analysis was performed by using one-way ANOVA followed by Tukey’s post hoc test. *p < 0.05; **p < 0.01; ***p < 0.001. “a” indicates statistical significance compared to control; “b” indicates statistical significance compared to C26 + vehicle; “c” indicates statistical significance compared to C26 + (−)-JQ1 20 mg/kg/day; “d” indicates statistical significance compared to C26 + (−)-JQ1 50 mg/kg/day. b Left panel: representative western blot analysis of p-FoxO3 (Ser413), p-FoxO3 (Ser253), total FoxO3, p-AMPK (Thr172) and total AMPK in nuclear/cytoplasmic extracts of TAs from control and tumor-bearing mice treated with vehicle or (+)-JQ1 (20 mg/ml/day). Three animals were used for each experimental group. Middle panel: average normalized values of band intensity for p-FoxO3 (Ser413) in nuclear fraction. Right panel: average normalized values of band intensity for p-AMPK (Thr172) in nuclear extracts. Statistical analysis was performed by using one-way ANOVA followed by Tukey’s post hoc test. *p < 0.05; **p < 0.01. “a” indicates statistical significance compared to control; “b” indicates statistical significance compared to C26 + vehicle. c Frozen TA sections (animals per group: n = 3) were stained with antibodies raised against p-FoxO3 (Ser413) antibodies. Arrowheads point at nuclei positive for p-FoxO3. Scale bar: 50 μm
Fig. 6 p-FoxO3Ser413 and p-AMPKThr172 levels increase in muscles from cachectic mice. a Left panel: representative western blot of p-AMPK (Thr172) and total AMPK, p-FoxO3 (Ser413), p-FoxO3 (Ser253), total FoxO3 levels in TA extracts from control animals and tumor-bearing mice treated with vehicle, (−)-JQ1, and (+)-JQ1. Vinculin serves as loading control. Middle panel: average normalized values of band intensity for p-AMPK (Thr172). Right panel: average normalized values of band intensity for p-FoxO3 (Ser413) (animals per group: n = 4–6). Data represent means ± SD. Statistical analysis was performed by using one-way ANOVA followed by Tukey’s post hoc test. *p < 0.05; **p < 0.01; ***p < 0.001. “a” indicates statistical significance compared to control; “b” indicates statistical significance compared to C26 + vehicle; “c” indicates statistical significance compared to C26 + (−)-JQ1 20 mg/kg/day; “d” indicates statistical significance compared to C26 + (−)-JQ1 50 mg/kg/day. b Left panel: representative western blot analysis of p-FoxO3 (Ser413), p-FoxO3 (Ser253), total FoxO3, p-AMPK (Thr172) and total AMPK in nuclear/cytoplasmic extracts of TAs from control and tumor-bearing mice treated with vehicle or (+)-JQ1 (20 mg/ml/day). Three animals were used for each experimental group. Middle panel: average normalized values of band intensity for p-FoxO3 (Ser413) in nuclear fraction. Right panel: average normalized values of band intensity for p-AMPK (Thr172) in nuclear extracts. Statistical analysis was performed by using one-way ANOVA followed by Tukey’s post hoc test. *p < 0.05; **p < 0.01. “a” indicates statistical significance compared to control; “b” indicates statistical significance compared to C26 + vehicle. c Frozen TA sections (animals per group: n = 3) were stained with antibodies raised against p-FoxO3 (Ser413) antibodies. Arrowheads point at nuclei positive for p-FoxO3. Scale bar: 50 μmCC BY · PubMed Central
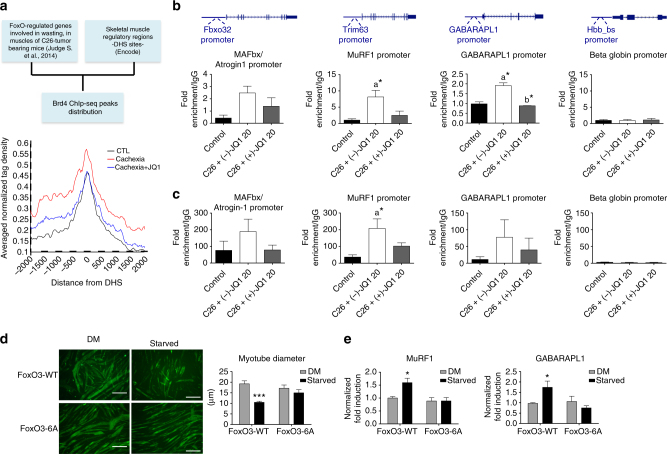
Fig. 7 FoxO3 and AMPK directly associate to catabolic genes promoters in skeletal muscles of cachectic mice. a Left panel: scheme of the bioinformatics analysis used to generate the average profile of BRD4 ChIP-seq tag counts around ±2 kb of DHSs neighboring a subset of FoxO-regulated genes in control, Cachexia, and Cachexia/JQ1 + mice (right panel). b FoxO3 ChIP qPCR at promoters of muscle catabolic genes and beta globin gene as a negative control. IgG was used as a reference; n = 3. Data represent means ± SEM. Statistical analysis was performed by using one-way ANOVA followed by Tukey’s post hoc test. *p < 0.05; “a” indicates statistical significance compared to control; “b” indicates statistical significance compared to C26 + (−)-JQ1 20 mg/kg/day. c p-AMPK(Thr172) ChIP qPCR at promoters of muscle catabolic genes. Beta globin gene is employed as a negative control. IgG was used as a reference. Animals per group: n = 3. Data represent means ± SEM. Statistical analysis was performed by using one-way ANOVA followed by Tukey’s post hoc test. *p < 0.05; “a” indicates statistical significance compared to control. d C2C12 were transduced with FoxO3-WT or FoxO3-6A retroviruses and allowed to differentiate for 4 days. Myotubes were then maintained in a DM medium with 25 mM glucose or starved in a medium with 0.5 mM glucose and 0.1% horse serum, for 24 h. Immunofluorescence was performed with ant-MyHC antibody (MF20). Scale bar: 50 μm. Right panel: mean diameter of FoxO3-WT and FoxO3-6A myotubes is shown. Data represent means ± SEM. Statistical analysis was performed by using one-way ANOVA followed by Tukey’s post hoc test. ***p < 0.001 vs. FoxO3-WT in DM. e Total RNA from myotubes treated as in d was extracted, and MuRF1 and GABARAPL1 transcript levels were measured by quantitative RT-PCR. Data represent means ± SD. Statistical analysis was performed by using one-way ANOVA followed by Tukey’s post hoc test. *p < 0.05 vs. FoxO3-WT in DM
Fig. 7 FoxO3 and AMPK directly associate to catabolic genes promoters in skeletal muscles of cachectic mice. a Left panel: scheme of the bioinformatics analysis used to generate the average profile of BRD4 ChIP-seq tag counts around ±2 kb of DHSs neighboring a subset of FoxO-regulated genes in control, Cachexia, and Cachexia/JQ1 + mice (right panel). b FoxO3 ChIP qPCR at promoters of muscle catabolic genes and beta globin gene as a negative control. IgG was used as a reference; n = 3. Data represent means ± SEM. Statistical analysis was performed by using one-way ANOVA followed by Tukey’s post hoc test. *p < 0.05; “a” indicates statistical significance compared to control; “b” indicates statistical significance compared to C26 + (−)-JQ1 20 mg/kg/day. c p-AMPK(Thr172) ChIP qPCR at promoters of muscle catabolic genes. Beta globin gene is employed as a negative control. IgG was used as a reference. Animals per group: n = 3. Data represent means ± SEM. Statistical analysis was performed by using one-way ANOVA followed by Tukey’s post hoc test. *p < 0.05; “a” indicates statistical significance compared to control. d C2C12 were transduced with FoxO3-WT or FoxO3-6A retroviruses and allowed to differentiate for 4 days. Myotubes were then maintained in a DM medium with 25 mM glucose or starved in a medium with 0.5 mM glucose and 0.1% horse serum, for 24 h. Immunofluorescence was performed with ant-MyHC antibody (MF20). Scale bar: 50 μm. Right panel: mean diameter of FoxO3-WT and FoxO3-6A myotubes is shown. Data represent means ± SEM. Statistical analysis was performed by using one-way ANOVA followed by Tukey’s post hoc test. ***p < 0.001 vs. FoxO3-WT in DM. e Total RNA from myotubes treated as in d was extracted, and MuRF1 and GABARAPL1 transcript levels were measured by quantitative RT-PCR. Data represent means ± SD. Statistical analysis was performed by using one-way ANOVA followed by Tukey’s post hoc test. *p < 0.05 vs. FoxO3-WT in DMCC BY · PubMed Central
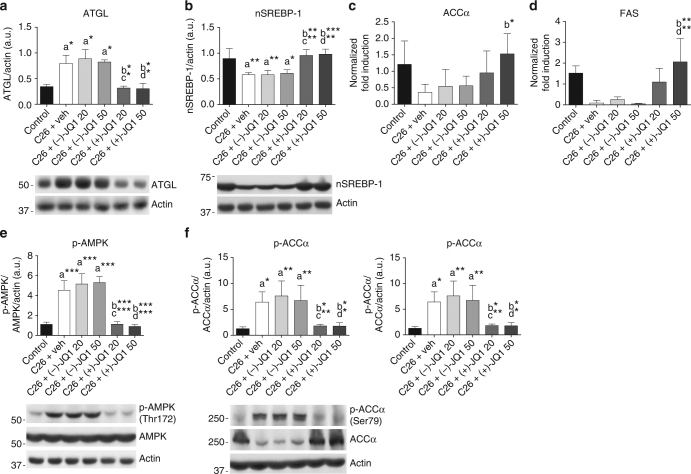
Fig. 8 JQ1 administration blocks epididymal adipose tissue wasting. a Representative western blot and densitometric analysis of ATGL expression in epididymal adipose tissue (eAT) from control animals and C26-tumor-bearing mice treated with vehicle, (−)-JQ1, and (+)-JQ1 (animals per group: n = 3). Data represent means ± SD. b Representative western blot and densitometric analysis of the nuclear and transcriptionally active fragment of SREBP-1 (nSREBP-1) in the eAT of control and C26-tumor-bearing mice treated with vehicle, (−)-JQ1, and (+)-JQ1. Four animals were used for each experimental condition. Data represent means ± SD. c, d Total RNA was extracted from eAT of control and C26-tumor-bearing mice (animals per group: n = 5) treated with vehicle or JQ1 (−/+) and expression levels of ACCα and FAS were measured by quantitative RT-PCR. Data represent means ± SD. e Representative western blot and densitometric analysis of p-AMPK (Thr172) in eAT of the six experimental groups described in a. Four mice were used for each experimental group. Data represent means ± SD. f Representative western blot and densitometric analysis of ACCα protein expression and p-ACCα inhibitory phosphorylation (Ser79) in eAT of control and C26 tumor-bearing mice (animals per group: n = 4) treated with vehicle or JQ1 (−/+). Data represent means ± SD. Statistical analysis was performed by using one-way ANOVA followed by Tukey’s post hoc test. *p < 0.05; **p < 0.01; ***p < 0.001. “a” indicates statistical significance compared to control; “b” indicates statistical significance compared to C26+ vehicle; “c” indicates statistical significance compared to C26+ (−)-JQ1 20 mg/kg/day; “d” indicates statistical significance compared to C26+ (−)-JQ1 50 mg/kg/day
Fig. 8 JQ1 administration blocks epididymal adipose tissue wasting. a Representative western blot and densitometric analysis of ATGL expression in epididymal adipose tissue (eAT) from control animals and C26-tumor-bearing mice treated with vehicle, (−)-JQ1, and (+)-JQ1 (animals per group: n = 3). Data represent means ± SD. b Representative western blot and densitometric analysis of the nuclear and transcriptionally active fragment of SREBP-1 (nSREBP-1) in the eAT of control and C26-tumor-bearing mice treated with vehicle, (−)-JQ1, and (+)-JQ1. Four animals were used for each experimental condition. Data represent means ± SD. c, d Total RNA was extracted from eAT of control and C26-tumor-bearing mice (animals per group: n = 5) treated with vehicle or JQ1 (−/+) and expression levels of ACCα and FAS were measured by quantitative RT-PCR. Data represent means ± SD. e Representative western blot and densitometric analysis of p-AMPK (Thr172) in eAT of the six experimental groups described in a. Four mice were used for each experimental group. Data represent means ± SD. f Representative western blot and densitometric analysis of ACCα protein expression and p-ACCα inhibitory phosphorylation (Ser79) in eAT of control and C26 tumor-bearing mice (animals per group: n = 4) treated with vehicle or JQ1 (−/+). Data represent means ± SD. Statistical analysis was performed by using one-way ANOVA followed by Tukey’s post hoc test. *p < 0.05; **p < 0.01; ***p < 0.001. “a” indicates statistical significance compared to control; “b” indicates statistical significance compared to C26+ vehicle; “c” indicates statistical significance compared to C26+ (−)-JQ1 20 mg/kg/day; “d” indicates statistical significance compared to C26+ (−)-JQ1 50 mg/kg/dayCC BY · PubMed Central
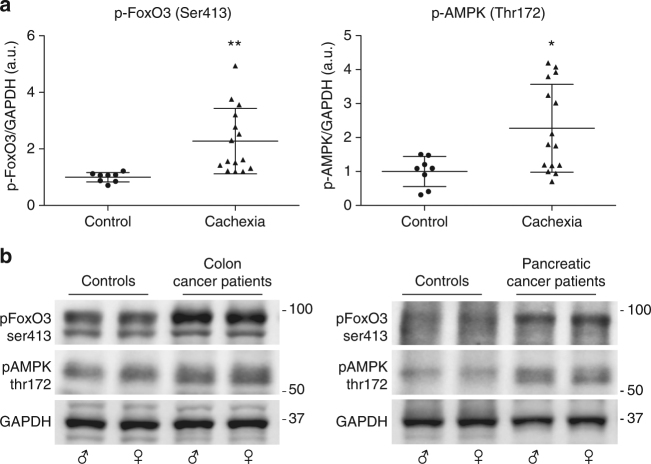
Fig. 9 Cachectic cancer patients show increased levels of p-FoxO3Ser413 and p-AMPKThr172 in rectus abdominis muscle. a p-FoxO3 (Ser413) and p-AMPK (Thr172) levels were measured by immunoblot in rectus abdominis muscles from non-neoplastic patients (n = 8) and cachectic cancer patients (n = 15). GAPDH serves as loading control. Data are presented in scatter dot plot, lines at means ± SD. Statistical analysis was performed by using Student’s unpaired t-test. *p < 0.05; **p < 0.01. b Representative western blots from non-neoplastic patients (controls), colon cancer, and pancreatic cancer patients are shown
Fig. 9 Cachectic cancer patients show increased levels of p-FoxO3Ser413 and p-AMPKThr172 in rectus abdominis muscle. a p-FoxO3 (Ser413) and p-AMPK (Thr172) levels were measured by immunoblot in rectus abdominis muscles from non-neoplastic patients (n = 8) and cachectic cancer patients (n = 15). GAPDH serves as loading control. Data are presented in scatter dot plot, lines at means ± SD. Statistical analysis was performed by using Student’s unpaired t-test. *p < 0.05; **p < 0.01. b Representative western blots from non-neoplastic patients (controls), colon cancer, and pancreatic cancer patients are shownCC BY · PubMed Central
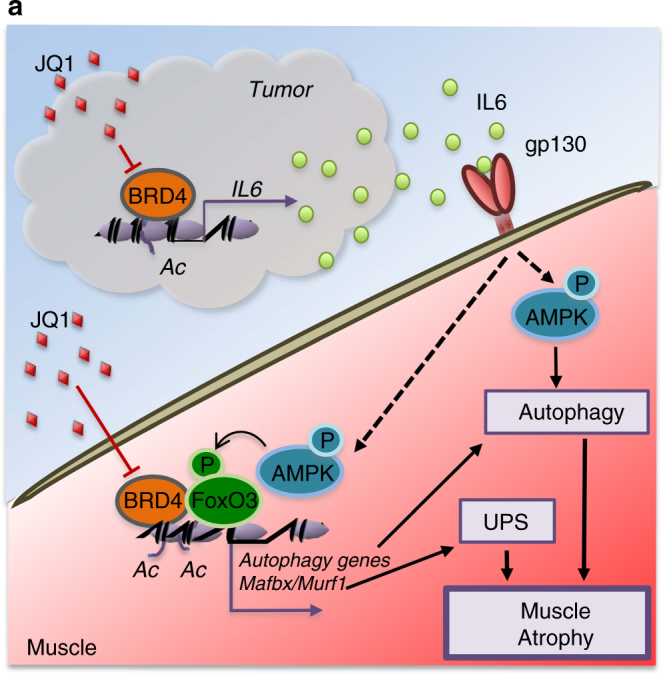
Fig. 10 Proposed mechanism for BRD4 and JQ1 regulation of muscle atrophy during cachexia. a Schematic presentation of BRD4 functions in tumor and muscle, during cancer cachexia
Fig. 10 Proposed mechanism for BRD4 and JQ1 regulation of muscle atrophy during cachexia. a Schematic presentation of BRD4 functions in tumor and muscle, during cancer cachexiaCC BY · PubMed Central

Verification

Claims the paper makes

The claims and statistics of this paper haven’t been checked yet.

Run the check — free, no account needed. It reads the open-access text and checks the sources it cites.

A few free checks a day · papers already verified open instantly · results are public

Claims other papers make about this one

Each is checked against this paper’s own text: does it say what the citing paper says it does?

Self-check

Percentages, sums and reported differences re-computed from the paper’s own numbers.

The self-check needs the paper’s full text.

Citations

Cites

Show all 71 references

Cited by

Sorted by citations

Items 101–101 of 101

Metadata

Authors
Segatto, M., Fittipaldi, R., Pin, F., Sartori, R., Dae Ko, K., Zare, H., Fenizia, C., Zanchettin, G., Pierobon, E. S., Hatakeyama, S., Sperti, C., Merigliano, S., Sandri, M., Filippakopoulos, P., Costelli, P., Sartorelli, V., & Caretti, G.
Affiliations
  • University of Milan (IT)
  • University of Turin (IT)
  • University of Padua (IT)
  • National Institutes of Health (US)
  • Novartis (Switzerland) (CH)
  • University of Oxford (GB)
Corresponding author
Caretti, Giuseppina
Venue
Nature Communications
Published
2017-11-22
Volume
8
Issue
1
Pages
1707-1707
ISSN
2041-1723 (ISSN-L)
OpenAlex
W2768531312
Cited by
101
References
71
Citations by year
2026: 5 · 2025: 8 · 2024: 5 · 2023: 16 · 2022: 9 · 2021: 15 · 2020: 18 · 2019: 14 · 2018: 11
FWCI
4.80
Type
journal article
Language
en
Open access
Locations
  • Nature Communications (publishedVersion, cc-by)
  • Europe PMC (PubMed Central) (publishedVersion, cc-by)
  • PubMed Central (publishedVersion, cc-by)
  • PubMed (publishedVersion)
  • Archivio Istituzionale della Ricerca (Universita Degli Studi Di Milano) (submittedVersion, cc-by)
  • IRIS Research product catalog (Sapienza University of Rome) (submittedVersion, cc-by-nc-nd)
  • Institutional Research Information System University of Turin (University of Turin) (submittedVersion, cc-by)
  • Padua Research Archive (University of Padova) (submittedVersion, cc-by)
  • RePEc: Research Papers in Economics (submittedVersion)
  • DOAJ (DOAJ: Directory of Open Access Journals) (submittedVersion)
  • DOAJ (DOAJ: Directory of Open Access Journals) (submittedVersion, cc-by-sa)
  • Archivio Istituzionale della Ricerca - Università degli Studi del Molise (submittedVersion)
Funders
  • Wellcome Trust (106169/Z/14/Z, 095751/Z/11/Z)
  • Associazione Italiana per la Ricerca sul Cancro
  • Fondazione Italiana per la Ricerca sul Cancro
  • National Institutes of Health
  • Medical Research Council (MR/N010051/1)
  • National Institute of Arthritis and Musculoskeletal and Skin Diseases
Topics
  • Life Sciences › Biochemistry, Genetics and Molecular Biology › Molecular Biology › Muscle Physiology and Disorders
  • Health Sciences › Medicine › Physiology (medical) › Nutrition and Health in Aging
  • Life Sciences › Biochemistry, Genetics and Molecular Biology › Molecular Biology › Protein Degradation and Inhibitors
Keywords
cancer cachexia, BRD4, BET proteins, JQ1, BET inhibitors, muscle atrophy, adipose tissue wasting, interleukin-6, AMPK signaling, FOXO3, epigenetic regulation, survival
MeSH terms
Forkhead Box Protein O3, Bromodomain Containing Proteins, Animals, Azepines, Cachexia, Gene Expression Regulation, Humans, Male, Muscular Atrophy, Neoplasms, Experimental, Nuclear Proteins, Transcription Factors, Triazoles, Interleukin-6, Muscle, Skeletal, Cell Cycle Proteins, Epigenesis, Genetic, Cell Line, Tumor, Mice, Metabolic Networks and Pathways, AMP-Activated Protein Kinases

About these checks

Registry, retraction, Cites and statistics results are computed, not judged, with one exception: a printed reference that no index lists is read once by a model before it counts as a citation error. Claims are extracted by a model and kept only when their quote appears verbatim in the text; each cited source is then checked, with a model’s help, for whether it says what the claim relies on. Those verdicts can be wrong — read the claim’s quote and the cited source before relying on one.

Statistics and arithmetic are recomputed, not judged.

Confidence bands are shown only for fields calibrated on our annotated test set. None is calibrated yet, so no band is shown.

What counts as a claim ›How we measure confidence ›How we check this ›

Are you an author, or do you see a problem with this page? Request a review