

The DOI matches its Crossref record; 74 of the 74 references it cites were found in a registry or an index.
Dissecting super-enhancer hierarchy based on chromatin interactions
Open accessPublished version of a preprint
Abstract
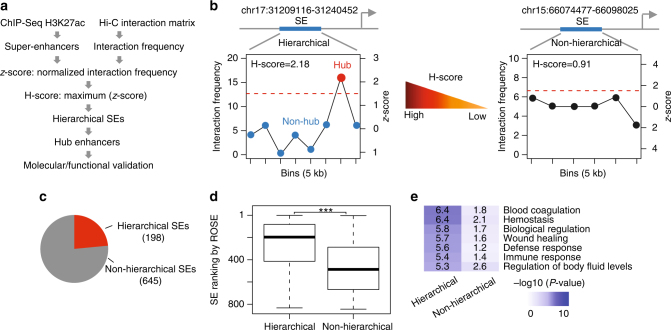
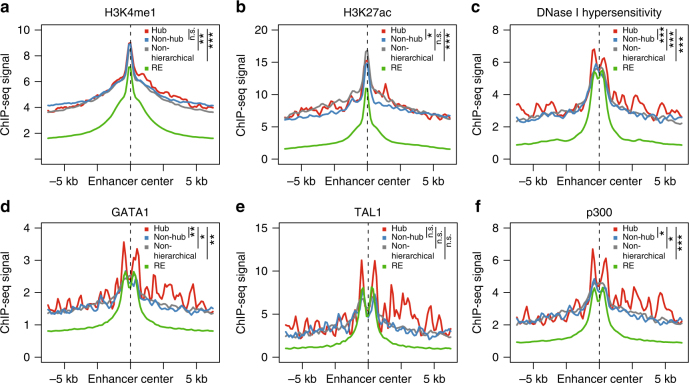
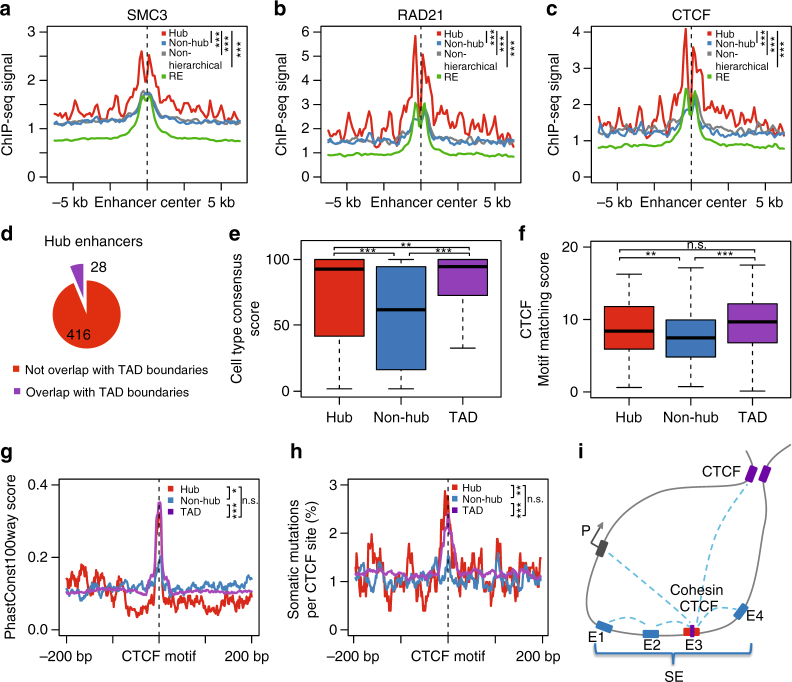
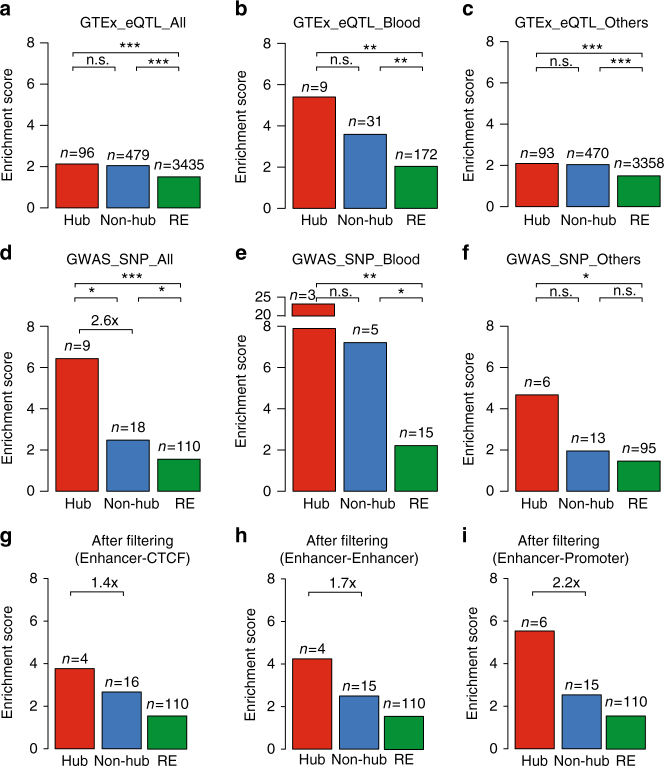
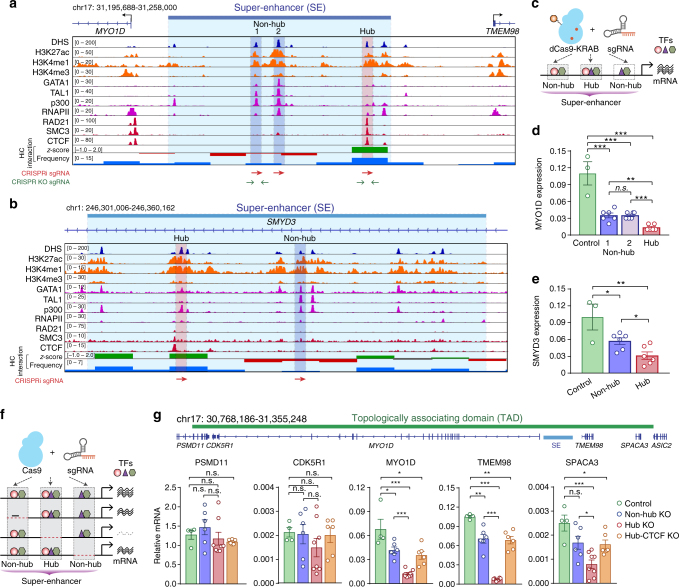
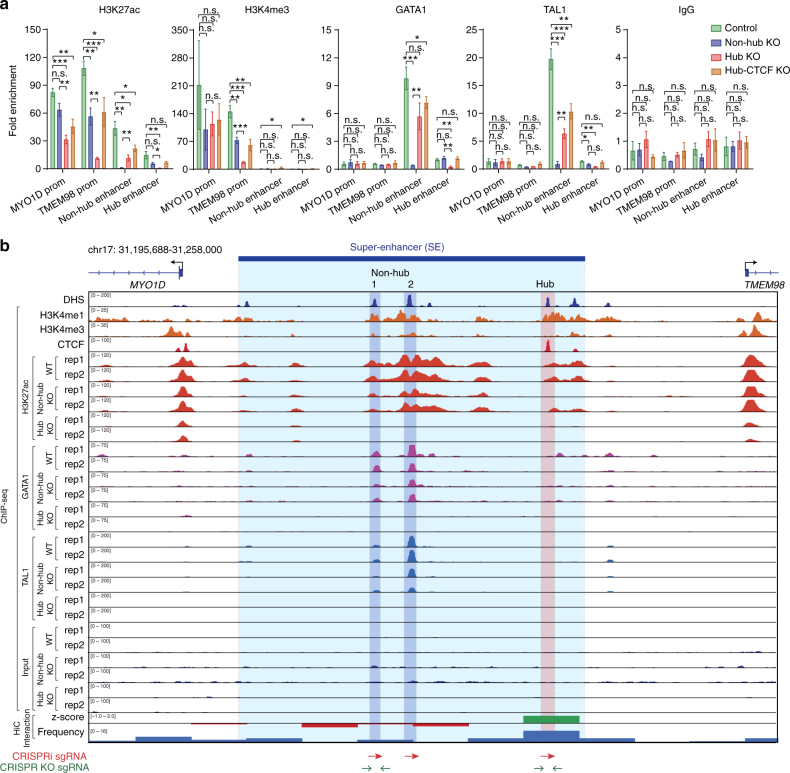
Recent studies have highlighted super-enhancers (SEs) as important regulatory elements for gene expression, but their intrinsic properties remain incompletely characterized. Through an integrative analysis of Hi-C and ChIP-seq data, here we find that a significant fraction of SEs are hierarchically organized, containing both hub and non-hub enhancers. Hub enhancers share similar histone marks with non-hub enhancers, but are distinctly associated with cohesin and CTCF binding sites and disease-associated genetic variants. Genetic ablation of hub enhancers results in profound defects in gene activation and local chromatin landscape. As such, hub enhancers are the major constituents responsible for SE functional and structural organization.
Overview
The claims and statistics of this paper haven’t been checked yet.
Run the check — free, no account needed. It reads the open-access text and checks the sources it cites.
Integrity signals
Registry
Cites
Statistics
Figures
Verification
Claims the paper makes
The claims and statistics of this paper haven’t been checked yet.
Run the check — free, no account needed. It reads the open-access text and checks the sources it cites.
Claims other papers make about this one
Each is checked against this paper’s own text: does it say what the citing paper says it does?
The source backs part of the claim, not all of it — or backs it for a different population, condition or comparison.
In the citing paper
“Review of diverse, albeit incomplete, previous analyses of SEs16,17,19,20,22 suggest that facilitators, as described here, may be relatively common elements in multipartite enhancers.”
From Super-enhancers include classical enhancers and facilitators to fully activate gene expression (2023) · cites this paper as [20]
Experimental — accuracy not yet measuredThe cited source says what the claim attributes to it.
In the citing paper
“When comparing Borzoi, Enformer and a distance-to-TSS baseline on their ability to classify measured positive from negative enhancer–gene interactions in data from previous works60–65, we find that Borzoi has superior average precision (AUPRC) and area under the receiver operating characteristic curve (AUROC) at all distances (Fig. 4c and Extended Data Fig. 5a).”
From Predicting RNA-seq coverage from DNA sequence as a unifying model of gene regulation (2025) · cites this paper as [64]
Self-check
Percentages, sums and reported differences re-computed from the paper’s own numbers.
The self-check needs the paper’s full text.
Citations
Cites
Ultrafast and memory-efficient alignment of short DNA sequences to the human genome.
Langmead, B., Trapnell, C., Pop, M., & Salzberg, S. L. (2009) · Genome Biology · doi:10.1186/gb-2009-10-3-r25 · Cited by 21,849
Model-based Analysis of ChIP-Seq (MACS)
Zhang, Y., Liu, T., Meyer, C. A., Eeckhoute, J., Johnson, D. S., Bernstein, B. E., Nusbaum, C., Myers, R. M., Brown, M., Li, W., et al. (2008) · Genome Biology · doi:10.1186/gb-2008-9-9-r137 · Cited by 18,386
Self-citationAn integrated encyclopedia of DNA elements in the human genome
The ENCODE Project Consortium (2012) · Nature · doi:10.1038/nature11247 · Cited by 18,072
Robinson, J. T., Thorvaldsdóttir, H., Winckler, W., Guttman, M., Lander, E. S., Getz, G., & Mesirov, J. P. (2011) · Nature Biotechnology · doi:10.1038/nbt.1754 · Cited by 15,390
Multiplex Genome Engineering Using CRISPR/Cas Systems
Cong, L., Ran, F. A., Cox, D., Lin, S., Barretto, R., Habib, N., Hsu, P. D., Wu, X., Jiang, W., Marraffini, L. A., et al. (2013) · Science · doi:10.1126/science.1231143 · Cited by 15,339
Heinz, S., Benner, C., Spann, N., Bertolino, E., Lin, Y. C., Laslo, P., Cheng, J. X., Murre, C., Singh, H., & Glass, C. K. (2010) · Molecular Cell · doi:10.1016/j.molcel.2010.05.004 · Cited by 13,382
A 3D Map of the Human Genome at Kilobase Resolution Reveals Principles of Chromatin Looping
Rao, S. S. P., Huntley, M. H., Durand, N. C., Stamenova, E. K., Bochkov, I. D., Robinson, J. T., Sanborn, A. L., Machol, I., Omer, A. D., Lander, E. S., et al. (2014) · Cell · doi:10.1016/j.cell.2014.11.021 · Cited by 9,212
RNA-Guided Human Genome Engineering via Cas9
Mali, P., Yang, L., Esvelt, K. M., Aach, J., Guell, M., DiCarlo, J. E., Norville, J. E., & Church, G. M. (2013) · Science · doi:10.1126/science.1232033 · Cited by 9,210
Comprehensive Mapping of Long-Range Interactions Reveals Folding Principles of the Human Genome
Lieberman-Aiden, E., van Berkum, N. L., Williams, L., Imakaev, M., Ragoczy, T., Telling, A., Amit, I., Lajoie, B. R., Sabo, P. J., Dorschner, M. O., et al. (2009) · Science · doi:10.1126/science.1181369 · Cited by 8,898
Topological domains in mammalian genomes identified by analysis of chromatin interactions
Dixon, J. R., Selvaraj, S., Yue, F., Kim, A., Li, Y., Shen, Y., Hu, M., Liu, J. S., & Ren, B. (2012) · Nature · doi:10.1038/nature11082 · Cited by 6,829
Cited by
Sorted by citations
Items 101–200 of 258
Bisht, S., Mao, Y., & Easwaran, H. (2024) · Current Opinion in Oncology · doi:10.1097/cco.0000000000001020 · Cited by 18
Predicting enhancers in mammalian genomes using supervised hidden Markov models
Zehnder, T., Benner, P., & Vingron, M. (2019) · BMC Bioinformatics · doi:10.1186/s12859-019-2708-6 · Cited by 15
Xiong, S., Zhou, J., Tan, T. K., Chung, T., Tan, T. Z., Toh, S. H. M., Tang, N. X. N., Jia, Y., See, Y. X., Fullwood, M. J., et al. (2024) · Nature Communications · doi:10.1038/s41467-024-50910-z · Cited by 19
Hong, D., Lin, H., Liu, L., Shu, M., Dai, J., Lu, F., Tong, M., & Huang, J. (2022) · Briefings in Bioinformatics · doi:10.1093/bib/bbac508 · Cited by 15
Self-citationHamdan, F. H., Abdelrahman, A. M., Kutschat, A. P., Wang, X., Ekstrom, T. L., Jalan‐Sakrikar, N., Wippel, C. W., Taheri, N., Tamon, L., Kopp, W., et al. (2023) · Gut · doi:10.1136/gutjnl-2022-328154 · Cited by 15
Distinct use of super-enhancer elements controls cell type–specific CD25 transcription and function
Spolski, R. J., Li, P., Chandra, V., Shin, B., Goel, S., Sakamoto, K., Liu, C., Oh, J., Ren, M., Enomoto, Y., et al. (2023) · Science Immunology · doi:10.1126/sciimmunol.adi8217 · Cited by 19
Mechanosensitive super-enhancers regulate genes linked to atherosclerosis in endothelial cells
Li, J., Zhu, J., Gray, O., Sobreira, D. R., Wu, D., Huang, R., Miao, B. A., Sakabe, N. J., Krause, M. D., Kaikkonen, M. U., et al. (2023) · The Journal of Cell Biology · doi:10.1083/jcb.202211125 · Cited by 16
Regulatory sharing between estrogen receptor α bound enhancers
Carleton, J. B., Ginley-Hidinger, M., Berrett, K. C., Layer, R. M., Quinlan, A. R., & Gertz, J. (2020) · Nucleic Acids Research · doi:10.1093/nar/gkaa454 · Cited by 15
Hunter, E., Dezfouli, M., Koutsothanasi, C., Wilson, A., Santos, F. C., Salter, M., Westra, J. W., Powell, R., Dring, A., Egan, B., et al. (2023) · Cancers · doi:10.3390/cancers15102696 · Cited by 18
Seeing the forest through the trees: prioritising potentially functional interactions from Hi-C
Liu, N., Low, W. Y., Alinejad‐Rokny, H., Pederson, S., Sadlon, T. J., Barry, S. C., & Breen, J. (2021) · Epigenetics & Chromatin · doi:10.1186/s13072-021-00417-4 · Cited by 16
Potential roles of super enhancers in inflammatory gene transcription
Higashijima, Y., & Kanki, Y. (2021) · FEBS Journal · doi:10.1111/febs.16089 · Cited by 14
Super-enhancers: drivers of cells’ identities and cells’ debacles
Lavaud, M., Tesfaye, R. A., Lassous, L., Royer, B. B.-L., Baud’huin, M., Verrecchia, F., Lamoureux, F., Georges, S., & Ory, B. (2024) · Epigenomics · doi:10.2217/epi-2023-0409 · Cited by 15
Jonas, J., & Boskovic, A. (2014) · PubMed · Cited by 13
Enhancing CRISPR deletion via pharmacological delay of DNA-PKcsPreprint
Bosch-Guiteras, N., Uroda, T., Guillen-Ramirez, H., Riedo, R., Gazdhar, A., Esposito, R., Pulido-Quetglas, C., Zimmer, Y., Medová, M., & Johnson, R. (2021) · Genome Research · doi:10.1101/gr.265736.120 · Cited by 13
Zhang, Y., Chen, K., Tang, S. C., Cai, Y., Niibori-Nambu, A., See, Y. X., Fu, C., Raju, A., Lebeau, B., Ling, Z., et al. (2024) · Nature Structural & Molecular Biology · doi:10.1038/s41594-024-01391-7 · Cited by 16
Self-citationShahzad, U., Nikolopoulos, M., Li, C., Johnston, M. J. G., Wang, J. J., Sabha, N., Varn, F. S., Riemenschneider, A. N., Krumholtz, S. L., Krishnamurthy, P. M., et al. (2024) · Molecular Oncology · doi:10.1002/1878-0261.13735 · Cited by 12
From genome sequencing to the discovery of potential biomarkers in liver disease
Oh, S., Jo, Y., Jung, S., Yoon, S., & Yoo, K. H. (2020) · BMB Reports · doi:10.5483/bmbrep.2020.53.6.074 · Cited by 12
Wang, H., Yang, J., Zhang, Y., & Wang, J. (2020) · Methods · doi:10.1016/j.ymeth.2020.10.010 · Cited by 12
Self-citationMatthews, B. J., Melia, T., & Waxman, D. J. (2021) · PLoS Genetics · doi:10.1371/journal.pgen.1009588 · Cited by 12
Ma, H., Qu, J., Luo, J. G., Qi, T., Tan, H., Jiang, Z., Zhang, H., & Qu, Q. (2019) · Cancer Management and Research · doi:10.2147/cmar.s214614 · Cited by 12
An encyclopedia of human enhancer–gene regulatory interactions
Gschwind, A. R., Mualim, K. S., Karbalayghareh, A., Sheth, M. U., Dey, K. K., Jagoda, E., Nurtdinov, R., Xi, W., Tan, A. S., Galante, J., et al. (2026) · Nature · doi:10.1038/s41586-026-10781-4 · Cited by 161
Wang, H., Duan, A., Zhang, J., Wang, Q., Xing, Y., Qin, Z. S., Liu, Z., & Yang, J. (2021) · Communications Biology · doi:10.1038/s42003-021-02209-8 · Cited by 11
Chignon, A., Mathieu, S., Rufiange, A., Argaud, D., Voisine, P., Bossé, Y., Arsenault, B. J., Thériault, S., & Mathieu, P. (2022) · Human Genomics · doi:10.1186/s40246-022-00381-4 · Cited by 11
Tales from topographic oceans: topologically associated domains and cancer
Campbell, M. J. (2019) · Endocrine Related Cancer · doi:10.1530/erc-19-0348 · Cited by 13
Spatial genome architecture and the emergence of malignancy
Danieli‐Mackay, A., & Papantonis, A. (2020) · Human Molecular Genetics · doi:10.1093/hmg/ddaa128 · Cited by 11
Tyagi, S., Capitanio, J. S., Xu, J., Chen, F., Sharma, R., Huang, J., & Hetzer, M. W. (2023) · doi:10.7554/elife.87462 · Cited by 11
Self-citationDynamic chromatin organization and regulatory interactions in human endothelial cell differentiation
Alavattam, K. G., Mitzelfelt, K. A., Bonora, G., Fields, P., Yang, X., Chiu, H. S., Pabon, L., Bertero, A., Palpant, N. J., Noble, W. S., et al. (2022) · Stem Cell Reports · doi:10.1016/j.stemcr.2022.11.003 · Cited by 10
Ito, S., Das, N. D., Umehara, T., & Koseki, H. (2022) · Cancers · doi:10.3390/cancers14215404 · Cited by 13
Bagheri, H., Friedman, H. C., Siminovitch, K. A., & Peterson, A. C. (2020) · PLoS Genetics · doi:10.1371/journal.pgen.1008752 · Cited by 10
Hunter, E., Koutsothanasi, C., Wilson, A. J., Santos, F. C., Salter, M., Powell, R., Dring, A. M., Brajer, P., Egan, B., Westra, J. W., et al. (2021) · bioRxiv (Cold Spring Harbor Laboratory) · doi:10.1101/2021.03.14.435295 · Cited by 10
The dynamic landscape of enhancer-derived RNA during mouse early embryo development
Yu, H., Zhao, J., Shen, Y., Qiao, L., Liu, Y., Xie, G., Chang, S., Ge, T., Li, N., Chen, M., et al. (2024) · Cell Reports · doi:10.1016/j.celrep.2024.114077 · Cited by 9
Dorans, E., Jagadeesh, K. A., Dey, K. K., & Price, A. L. (2025) · Nature Genetics · doi:10.1038/s41588-025-02220-3 · Cited by 12
Yang, H., Lv, D., Li, X., Chen, Y., Xu, H., Wu, H., Wang, Z., Cao, X., Tang, B., Deng, W., et al. (2025) · Cellular & Molecular Biology Letters · doi:10.1186/s11658-025-00763-1 · Cited by 10
Benton, M. L., Ruderfer, D. M., & Capra, J. A. (2023) · Genome Biology and Evolution · doi:10.1093/gbe/evad126 · Cited by 9
Funsten, J., Brizuela, K. O. M., Swatzel, H. E., Ward, A. S., Scott, T. A., Eikenbusch, S., Shields, M. C., Meredith, J. L., Mitchell, T. Y., Hanna, M. L., et al. (2019) · Cellular Immunology · doi:10.1016/j.cellimm.2019.104027 · Cited by 9
Super-enhancer landscape rewiring in cancer: The epigenetic control at distal sites
Giorgio, E. D., Benetti, R., Kerschbamer, E., Xodo, L. E., & Brancolini, C. (2023) · International review of cytology · doi:10.1016/bs.ircmb.2023.03.013 · Cited by 9
Wu, C., & Huang, J. (2024) · BMC Genomics · doi:10.1186/s12864-024-10408-w · Cited by 8
Self-citationEnhancers and MYC interplay in hematopoiesis
Benetatos, L., Benetatou, A., & Vartholomatos, G. (2020) · Journal of Molecular Medicine · doi:10.1007/s00109-020-01891-1 · Cited by 8
RNA-m5C regulatory atlas of human fetal tissues uncover the activities of Nsun2/Jarid2/Alyref axis
Hu, X., Ding, C., Lu, J., Li, J., Ren, X., Xia, W., Qian, C., Li, H., Cheung, H., & Huang, B. (2025) · Journal of Advanced Research · doi:10.1016/j.jare.2025.08.004 · Cited by 7
Analysis of the landscape of human enhancer sequences in biological databases
Mulero-Hernández, J., & Fernández‐Breis, J. T. (2022) · Computational and Structural Biotechnology Journal · doi:10.1016/j.csbj.2022.05.045 · Cited by 9
Scott, T. J., Hansen, T. J., McArthur, E., & Hodges, E. C. (2023) · BMC Genomics · doi:10.1186/s12864-023-09622-9 · Cited by 7
Qiu, Y., Jiang, W., Feng, D., Yu, Y., Hou, H., Deng, M., Chen, X., Liu, L., Wu, R., Lu, Q., et al. (2024) · Journal of Investigative Dermatology · doi:10.1016/j.jid.2024.08.006 · Cited by 6
Inferring time series chromatin states for promoter-enhancer pairs based on Hi-C data
Miko, H., Qiu, Y., Gaertner, B., Sander, M., & Ohler, U. (2021) · BMC Genomics · doi:10.1186/s12864-021-07373-z · Cited by 6
Liu, X., Zhao, B., Shaw, T. I., Fridley, B. L., Duckett, D. R., Tan, A. C., & Teng, M. (2022) · Nucleic Acids Research · doi:10.1093/nar/gkac141 · Cited by 7
Self-citationCrosstalk between SOX Genes and Long Non-Coding RNAs in Glioblastoma
Stevanović, M. J., Kovačević‐Grujičić, N., Petrović, I., Drakulić, D., Milivojević, M., & Mojsin, M. M. (2023) · International Journal of Molecular Sciences · doi:10.3390/ijms24076392 · Cited by 6
Dichotomy in redundant enhancers points to presence of initiators of gene regulation
Song, W., & Ovcharenko, I. (2018) · BMC Genomics · doi:10.1186/s12864-018-5335-0 · Cited by 6
Epigenetic Mechanisms Mediating Cell State Transitions in Chondrocytes
Wuelling, M., Neu, C., Thiesen, A. M., Kitanovski, S., Cao, Y., Lange, A., Westendorf, A. M., Hoffmann, D. E., & Vortkamp, A. (2020) · Journal of Bone and Mineral Research · doi:10.1002/jbmr.4263 · Cited by 5
Enhancers as regulators of antigen receptor loci three-dimensional chromatin structure
Barajas-Mora, E. M., & Feeney, A. J. (2019) · Transcription · doi:10.1080/21541264.2019.1699383 · Cited by 7
Li, X., Yuan, S., Zhu, S., Xue, H., & Peng, W. (2022) · bioRxiv (Cold Spring Harbor Laboratory) · doi:10.1101/2022.04.16.488566 · Cited by 6
Characterization of network hierarchy reflects cell state specificity in genome organizationPreprint
Wang, J., Xue, Y., He, Y., Quan, H., Zhang, J., & Gao, Y. Q. (2023) · Genome Research · doi:10.1101/gr.277206.122 · Cited by 6
Association of human-specific expanded short tandem repeats with neuron-specific regulatory features
Liu, Q., & Tian, W. (2025) · Science Advances · doi:10.1126/sciadv.adp9707 · Cited by 6
3D-super-enhancers are condensate-associated cis -regulatory communities
Lv, J., Maher, K. A., Dong, L., Valentine, V. A., Staller, S., Veluchamy, A., Tian, L., Kim, Y., Ju, B., Valentine, M. B., et al. (2026) · Nucleic Acids Research · doi:10.1093/nar/gkag191 · Cited by 5
Residual Neural Network in Genomics
Sabba, S., Smara, M., Benhacine, M., Terra, L., & Terra, Z. E. (2022) · Computer Science Journal of Moldova · doi:10.56415/csjm.v30.17 · Cited by 6
Pathogenic role of super-enhancers as potential therapeutic targets in lung cancer
Yao, Z., Song, P., & Jiao, W. (2024) · Frontiers in Pharmacology · doi:10.3389/fphar.2024.1383580 · Cited by 6
Enhancer jungles establish robust tissue-specific regulatory control in the human genome
Li, S., & Ovcharenko, I. (2019) · Genomics · doi:10.1016/j.ygeno.2019.12.022 · Cited by 5
Exploring the impact of dexamethasone on gene regulation in myeloma cells
Gaborit, V., Cruard, J., Guérin‐Charbonnel, C., Derrien, J., Alberge, J.-B., Douillard, E., Devic, M., Deshayes, S., Campion, L., Westermann, F., et al. (2023) · Life Science Alliance · doi:10.26508/lsa.202302195 · Cited by 8
Naeini, A. S., Farooq, A., Bjørås, M., & Wang, J. (2020) · Computational and Structural Biotechnology Journal · doi:10.1016/j.csbj.2020.05.024 · Cited by 5
No Need to Stick Together to Be Connected: Multiple Types of Enhancers’ Networking
Vitale, E., Gugnoni, M., & Ciarrocchi, A. (2021) · Cancers · doi:10.3390/cancers13205201 · Cited by 5
Super enhancers as key drivers of gene regulatory networks in normal and malignant hematopoiesis
Cheng, Y., Pei, G., Zhang, H., Hou, Y., Sun, L., Xu, H., Lv, Y., & Wu, X. (2025) · Frontiers in Cell and Developmental Biology · doi:10.3389/fcell.2025.1674470 · Cited by 5
Makus, Y. V., Ashniev, G. A., Орлов, А. В., Nikitin, P. I., Zaitseva, Z. G., & Orlova, N. N. (2025) · Applied Sciences · doi:10.3390/app15095113 · Cited by 4
Extensive enhancer crosstalk controls PPARG2 activation during adipogenesis
Cetnarowska, A., Hyldahl, M., Nygård, M., Dashti, H., Hansen, B. M., Holm, L. K., Madsen, K., Madsen, M. S., Shukla, V., Mitchell, E. D., et al. (2026) · Nature Communications · doi:10.1038/s41467-026-70401-7 · Cited by 4
Bojcsuk, D., Nagy, G., & Bálint, B. L. (2020) · International Journal of Molecular Sciences · doi:10.3390/ijms21051630 · Cited by 4
chromMAGMA: regulatory element-centric interrogation of risk variants
Nameki, R. A., Shetty, A. H., Dareng, E., Tyrer, J. P., Lin, X., Pharoah, P. D. P., Corona, R. I., Kar, S., & Lawrenson, K. (2022) · Life Science Alliance · doi:10.26508/lsa.202201446 · Cited by 4
Kraus, L., & Beavens, B. (2023) · Biomedicines · doi:10.3390/biomedicines11020579 · Cited by 4
Shahzad, U., Li, C., Johnston, M. J. G., Wang, J. J., Sabha, N., Varn, F. S., Riemenschneider, A. N., Krumholtz, S. L., Krishnamurthy, P. M., Smith, C. A., et al. (2020) · bioRxiv (Cold Spring Harbor Laboratory) · doi:10.1101/2020.09.05.284349 · Cited by 4
Giammartino, D. C. D., Kloetgen, A., Polyzos, A., Liu, Y., Kim, D., Murphy, D., Abuhashem, A., Cavaliere, P., Aronson, B. E., Shah, V., et al. (2018) · bioRxiv (Cold Spring Harbor Laboratory) · doi:10.1101/382473 · Cited by 5
Tyagi, S., Capitanio, J. S., Xu, J., Chen, F., Sharma, R., Huang, J., & Hetzer, M. W. (2021) · bioRxiv (Cold Spring Harbor Laboratory) · doi:10.1101/2021.05.10.443506 · Cited by 4
Self-citationThe role of super-enhancer-driven lncRNAs in cancer
Su, Y., Ji, F., Zheng, Z.-J., Peng, J., & Xie, J. (2025) · Computational and Structural Biotechnology Journal · doi:10.1016/j.csbj.2025.09.011 · Cited by 4
Enhancer Trajectories in Lineage Commitment: Regulatory Logic of States and Cooperation
Oh, M., Jeong, S., Kang, K., & Kim, S.-K. (2026) · Biomolecules · doi:10.3390/biom16010087 · Cited by 5
Genetic variants shape single-cell chromatin accessibility and disease risk
Xue, A., Fan, J., Dong, O. A., Huang, H. L., Chen, L., Allen, P. C., Spenceley, E., Sagi-Zsigmond, E., Bowen, B., Henry, A., et al. (2026) · Nature · doi:10.1038/s41586-026-11173-4 · Cited by 3
Residual Neural Network for Predicting Super-Enhancers on Genome Scale
Sabba, S., Smara, M., Benhacine, M., & Hameurlaine, A. (2022) · Lecture notes in networks and systems · doi:10.1007/978-3-030-96311-8_4 · Cited by 3
Novel enhancers conferring compensatory transcriptional regulation of Nkx2-5 in heart development
Zhang, J., Li, C. C., Li, X., Liu, Y., Wang, Q., Zhang, G., Xiong, H., He, A., & Ai, S. (2023) · iScience · doi:10.1016/j.isci.2023.106509 · Cited by 4
Connectome and regulatory hubs of CAGE highly active enhancers
Briend, M., Rufiange, A., Moncla, L.-H. M., Mathieu, S., Bossé, Y., & Mathieu, P. (2023) · Scientific Reports · doi:10.1038/s41598-023-32669-3 · Cited by 3
Luo, S., Zhu, M., Lin, L., Xie, J., Lin, S., Chen, Y., Zhu, J., & Huang, J. (2024) · Briefings in Bioinformatics · doi:10.1093/bib/bbaf069 · Cited by 4
Self-citationXie, B., & Dean, A. (2025) · RNA Biology · doi:10.1080/15476286.2025.2475421 · Cited by 3
Dincer, T. U., & Ernst, J. (2025) · Genome biology · doi:10.1186/s13059-025-03579-6 · Cited by 3
Super-silencers regulated by chromatin interactions control apoptotic genesPreprint
Zhang, Y., Chen, K., Cai, Y., Niibori-Nambu, A., See, Y. X., Fu, C., Raju, A., Lakshmanan, M., Osato, M., Tergaonkar, V., et al. (2022) · bioRxiv (Cold Spring Harbor Laboratory) · doi:10.1101/2022.01.17.476559 · Cited by 3
Self-citationTyagi, S., Capitanio, J. S., Xu, J., Chen, F., Sharma, R., Huang, J., & Hetzer, M. W. (2023) · doi:10.7554/elife.87462.1 · Cited by 3
Self-citationE-box independent chromatin recruitment turns MYOD into a transcriptional repressorPreprint
Nicoletti, C., Massenet, J., Pintado-Urbanc, A. P., Connor, L. J., Nicolau, M., Sundar, S., Xu, M., Schmitt, A. D., Zhang, W., Fang, Z., et al. (2024) · bioRxiv (Cold Spring Harbor Laboratory) · doi:10.1101/2024.12.05.627024 · Cited by 3
Chen, X., Wang, Z., Song, Y., Su, Y., Zhao, Y., Li, J., Wang, W., Zhang, J., Daniels, C., Wu, X., et al. (2025) · Cell Reports Medicine · doi:10.1016/j.xcrm.2025.102474 · Cited by 3
Game of clones: decipher lineage plasticity in hormone-driven cancers
Leonita, A., Cheng, S., Warrick, J., Kim, I. Y., Deng, S., & Mu, P. (2026) · Cellular and Molecular Life Sciences · doi:10.1007/s00018-026-06171-8 · Cited by 2
The cardiac 4D nucleome: nuclear and chromatin dynamics across development, disease and ageing
Wang, Y., & Dobreva, G. D. (2026) · Nature Reviews Cardiology · doi:10.1038/s41569-026-01322-7 · Cited by 2
Aberrant Super-Enhancer Landscape in Enzalutamide-Resistant Prostate Cancer Cells
Cai, C., Liu, Q., Shan, H., Zheng, Y., Chen, G., Cai, Z., Zheng, Y., Lü, J., Tang, J., & Lin, Z. (2024) · Genetic Testing and Molecular Biomarkers · doi:10.1089/gtmb.2023.0280 · Cited by 2
Mehra, P., & Kalani, A. (2018) · Life Sciences · doi:10.1016/j.lfs.2018.09.021 · Cited by 2
Zeng, X., Lee, H., Wang, C., Achikeh, P., Liu, C., & Hennighausen, L. G. (2020) · Experimental & Molecular Medicine · doi:10.1038/s12276-020-0425-x · Cited by 2
Model-based analysis of chromatin interactions from dCas9-Based CAPTURE-3C-seq
Chen, Y., Wang, Y., Liu, X., Xu, J., & Zhang, M. Q. (2020) · PLoS ONE · doi:10.1371/journal.pone.0236666 · Cited by 2
Self-citation‘Enhancing’ red cell fate through epigenetic mechanisms
Rossmann, M. P., & Zon, L. I. (2021) · Current Opinion in Hematology · doi:10.1097/moh.0000000000000654 · Cited by 2
Loop competition and extrusion model predicts CTCF interaction specificity
Wang, X., & Beer, M. (2021) · RePEc: Research Papers in Economics · Cited by 2
Loop competition and extrusion model predicts CTCF interaction specificityPreprint
Xi, W., & Beer, M. (2020) · bioRxiv (Cold Spring Harbor Laboratory) · doi:10.1101/2020.07.02.185389 · Cited by 2
Liu, X., Gillis, N., Jiang, C., McCofie, A., Shaw, T. I., Tan, A. C., Zhao, B., Wan, L., Duckett, D. R., & Teng, M. (2024) · PLoS Computational Biology · doi:10.1371/journal.pcbi.1011873 · Cited by 1
Self-citationLatt, K. Z., Yoshida, T., Shrivastav, S., Abedini, A., Reece, J. M., Sun, Z., Lee, H., Okamoto, K., Dagur, P. K., Ishimoto, Y., et al. (2024) · American Journal Of Pathology · doi:10.1016/j.ajpath.2024.06.006 · Cited by 1
Fujita, S., Tani, S., Okada, H., Saito, T., Tanaka, S., Ohba, S., Chung, U., & Hojo, H. (2025) · Development Growth & Differentiation · doi:10.1111/dgd.70023 · Cited by 1
Himanen, S. V., Rabenius, A., Aktay, S., Tekoniemi, J., & Vihervaara, A. (2025) · Cell Reports · doi:10.1016/j.celrep.2025.116698 · Cited by 3
YAP-TEAD regulates the super-enhancer network to control early surface ectoderm commitment
Wang, Z., Yang, C., Ma, Z., He, X., Li, L., Wang, Y., Wang, Y., Cai, X., Jiao, H., Zhang, M., et al. (2025) · Nucleic Acids Research · doi:10.1093/nar/gkaf1285 · Cited by 1
Chen, Z. B., Liu, X., & Chen, A. T. (2021) · Current topics in membranes · doi:10.1016/bs.ctm.2021.08.002 · Cited by 1
Self-citationGenome-wide Analyses of Histone Modifications in the Mammalian Genome
Tian, S., Slager, S. L., Klee, E. W., & Yan, H. (2022) · Elsevier eBooks · doi:10.1016/b978-0-323-91909-8.00021-9 · Cited by 2
Hunter, E., Dezfouli, M., Koutsothanasi, C., Wilson, A. J., Santos, F. C., Salter, M., Westra, J. W., Powell, R., Dring, A. M., Egan, B., et al. (2021) · medRxiv · doi:10.1101/2021.12.21.21268094 · Cited by 1
chromMAGMA: regulatory element-centric interrogation of risk variantsPreprint
Nameki, R. A., Shetty, A. H., Dareng, E., Tyrer, J. P., Lin, X., Pharoah, P. D. P., Corona, R. I., Kar, S., & Lawrenson, K. (2022) · bioRxiv (Cold Spring Harbor Laboratory) · doi:10.1101/2022.01.21.477270 · Cited by 1
Spolski, R. J., Li, P., Chandra, V., Shin, B., Liu, C., Oh, J., Ren, M., Enomoto, Y., West, E. E., Christensen, S. M., et al. (2022) · bioRxiv (Cold Spring Harbor Laboratory) · doi:10.1101/2022.11.18.516445 · Cited by 1
Xie, B., & Dean, A. (2023) · bioRxiv (Cold Spring Harbor Laboratory) · doi:10.1101/2023.12.05.570115 · Cited by 1
Metadata
- Authors
- Huang, J., Li, K., Cai, W., Liu, X., Zhang, Y., Orkin, S. H., Xu, J., & Yuan, G.-C.
- Affiliations
- Boston Children's Hospital (US)
- Children's Medical Center (US)
- Harvard University (US)
- Corresponding author
- Xu, Jian
- Yuan, Guo-Cheng
- Venue
- Nature Communications
- Published
- 2018-03-05
- Volume
- 9
- Issue
- 1
- Pages
- 943-943
- ISSN
- 2041-1723 (ISSN-L)
- PMC
- PMC5838163
- OpenAlex
- W2952336494
- Cited by
- 241
- References
- 74
- Citations by year
- 2026: 22 · 2025: 20 · 2024: 22 · 2023: 27 · 2022: 37 · 2021: 43 · 2020: 30 · 2019: 25 · 2018: 14
- FWCI
- 11.38
- Type
- journal article
- Language
- en
- Open access
- gold
- doi.org
- Locations
- Nature Communications (publishedVersion, cc-by)
- bioRxiv (Cold Spring Harbor Laboratory) (acceptedVersion, cc-by)
- PubMed Central (publishedVersion, cc-by)
- PubMed (publishedVersion)
- Digital Access to Scholarship at Harvard (DASH) (Harvard University) (submittedVersion, cc-by)
- RePEc: Research Papers in Economics (submittedVersion)
- DOAJ (DOAJ: Directory of Open Access Journals) (submittedVersion)
- DOAJ (DOAJ: Directory of Open Access Journals) (submittedVersion, cc-by-sa)
- Funders
- American Cancer Society (IRG‐02‐196, 02-196)
- Cancer Prevention and Research Institute of Texas (RR140025)
- University of Texas Southwestern Medical Center
- National Institutes of Health
- National Heart, Lung, and Blood Institute (R01HL119099)
- National Human Genome Research Institute (R01HG009663)
- National Institute of Diabetes and Digestive and Kidney Diseases (K01DK093543, R03DK101665, R01DK111430)
- Topics
- Life Sciences › Biochemistry, Genetics and Molecular Biology › Molecular Biology › Genomics and Chromatin Dynamics
- Life Sciences › Biochemistry, Genetics and Molecular Biology › Molecular Biology › Chromatin Remodeling and Cancer
- Life Sciences › Biochemistry, Genetics and Molecular Biology › Cancer Research › Cancer-related molecular mechanisms research
- Keywords
- super-enhancers, chromatin interactions, cohesin, CTCF binding sites, histone modifications, disease-associated variants, gene activation, chromatin landscape
- MeSH terms
- Gene Editing, CCCTC-Binding Factor, Cohesins, Chromatin, Chromosomal Proteins, Non-Histone, Disease, Enhancer Elements, Genetic, Gene Expression Regulation, Humans, Models, Genetic, Protein Binding, Genetic Variation, Cell Cycle Proteins, K562 Cells, Gene Knockout Techniques, Human Umbilical Vein Endothelial Cells, CRISPR-Cas Systems
About these checks
Registry, retraction, Cites and statistics results are computed, not judged, with one exception: a printed reference that no index lists is read once by a model before it counts as a citation error. Claims are extracted by a model and kept only when their quote appears verbatim in the text; each cited source is then checked, with a model’s help, for whether it says what the claim relies on. Those verdicts can be wrong — read the claim’s quote and the cited source before relying on one.
Statistics and arithmetic are recomputed, not judged.
Confidence bands are shown only for fields calibrated on our annotated test set. None is calibrated yet, so no band is shown.
What counts as a claim ›How we measure confidence ›How we check this ›
Are you an author, or do you see a problem with this page? Request a review
