

The DOI matches its Crossref record; 64 of the 64 references it cites were found in a registry or an index.
Characterizing the replicability of cell types defined by single cell RNA-sequencing data using MetaNeighbor
Open accessPublished version of a preprint
Abstract
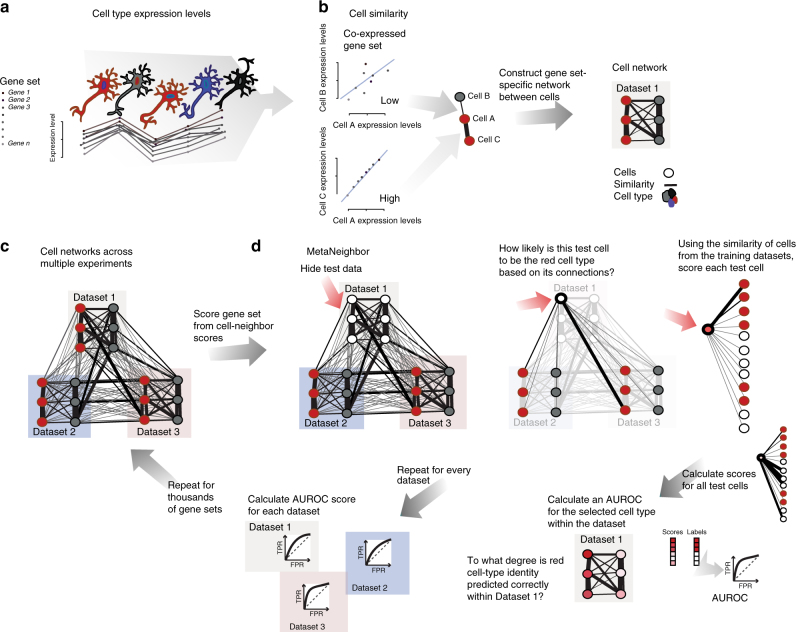
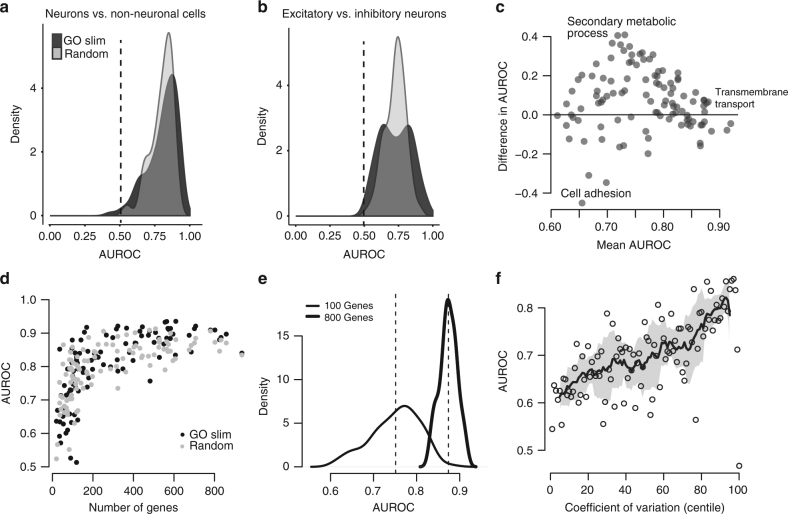
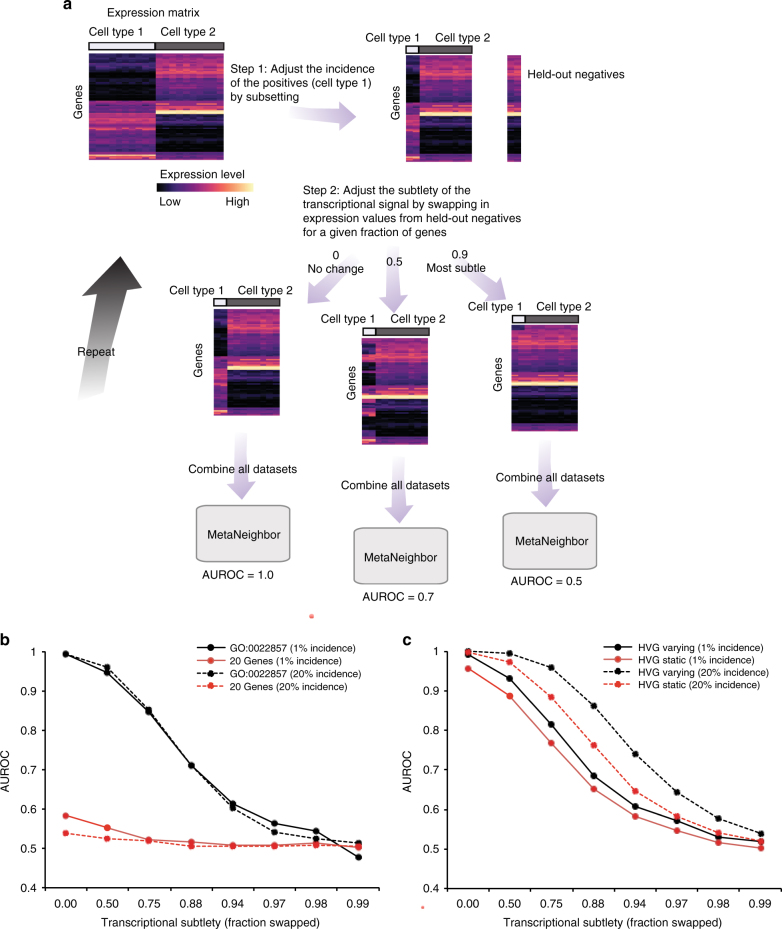
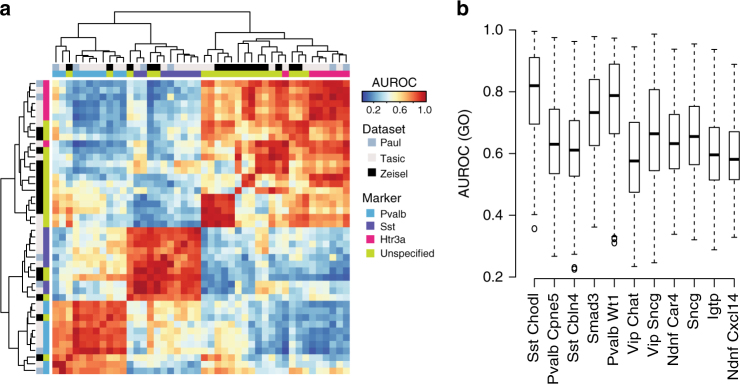
Single-cell RNA-sequencing (scRNA-seq) technology provides a new avenue to discover and characterize cell types; however, the experiment-specific technical biases and analytic variability inherent to current pipelines may undermine its replicability. Meta-analysis is further hampered by the use of ad hoc naming conventions. Here we demonstrate our replication framework, MetaNeighbor, that quantifies the degree to which cell types replicate across datasets, and enables rapid identification of clusters with high similarity. We first measure the replicability of neuronal identity, comparing results across eight technically and biologically diverse datasets to define best practices for more complex assessments. We then apply this to novel interneuron subtypes, finding that 24/45 subtypes have evidence of replication, which enables the identification of robust candidate marker genes. Across tasks we find that large sets of variably expressed genes can identify replicable cell types with high accuracy, suggesting a general route forward for large-scale evaluation of scRNA-seq data.
Overview
The claims and statistics of this paper haven’t been checked yet.
Run the check — free, no account needed. It reads the open-access text and checks the sources it cites.
Integrity signals
Registry
Cites
Statistics
Figures
Verification
Claims the paper makes
The claims and statistics of this paper haven’t been checked yet.
Run the check — free, no account needed. It reads the open-access text and checks the sources it cites.
Claims other papers make about this one
Each is checked against this paper’s own text: does it say what the citing paper says it does?
In the citing paper
“Paul et al.28 applied a supervised machine learning-based algorithm (MetaNeighbour50) to screen the ~620 HGNC (Human Genome Nomenclature Committee) gene families for those whose differential single-cell expression reliably distinguish these PCPs.”
From The diversity of GABAergic neurons and neural communication elements (2019) · cites this paper as [50]
In the citing paper
“A stringent test of cell type replicability uses transcriptomic signatures of a cell type learned from one or more datasets to try to predict the identity of cells in an independent dataset, providing a statistical score (area under the ROC curve) that quantifies the match between clusters (Crow et al., 2018).”
From Single-Cell Sequencing of Brain Cell Transcriptomes and Epigenomes (2021) · cites this paper as Crow et al., 2018
Self-check
Percentages, sums and reported differences re-computed from the paper’s own numbers.
The self-check needs the paper’s full text.
Citations
Cites
Controlling the False Discovery Rate: A Practical and Powerful Approach to Multiple Testing
Benjamini, Y., & Hochberg, Y. (1995) · Journal of the Royal Statistical Society Series B: Statistical Methodology · doi:10.1111/j.2517-6161.1995.tb02031.x · Cited by 109,482
Integrated analysis of single cell transcriptomic data across conditions, technologies, and species
Butler, A., & Satija, R. (2017) · doi:10.1101/164889 · Cited by 13,200
Integrating single-cell transcriptomic data across different conditions, technologies, and species
Butler, A., Hoffman, P., Smibert, P., Papalexi, E., & Satija, R. (2018) · Nature Biotechnology · doi:10.1038/nbt.4096 · Cited by 13,174
Statistical Methods for Research Workers
Fisher, R. A. (1945) · American Journal of Clinical Pathology · doi:10.1093/ajcp/15.11.552b · Cited by 10,883
Highly parallel genome-wide expression profiling of individual cells using nanoliter droplets.
Macosko, E. Z., Basu, A., Satija, R., Nemesh, J., Shekhar, K., Goldman, M., Tirosh, I., Bialas, A. R., Kamitaki, N., Martersteck, E. M., et al. (2015) · Cell · doi:10.1016/j.cell.2015.05.002 · Cited by 7,110
Repeated observation of breast tumor subtypes in independent gene expression data sets
Sørlie, T., Tibshirani, R. J., Parker, J. S., Hastie, T. J., Marron, J. S., Nobel, A. B., Deng, S., Johnsen, H., Pesich, R., Geisler, S. B., et al. (2003) · Proceedings of the National Academy of Sciences · doi:10.1073/pnas.0932692100 · Cited by 5,508
Droplet barcoding for single-cell transcriptomics applied to embryonic stem cells
Klein, A. M., Mazutis, L., Akartuna, I., Tallapragada, N., Veres, A., Li, V., Peshkin, L., Weitz, D. A., & Kirschner, M. W. (2015) · Cell · doi:10.1016/j.cell.2015.04.044 · Cited by 3,356
Cell types in the mouse cortex and hippocampus revealed by single-cell RNA-seq
Zeisel, A., Muñoz-Manchado, A. B., Codeluppi, S., Lönnerberg, P., La Manno, G., Juréus, A., Marques, S., Munguba, H., He, L., Betsholtz, C., et al. (2015) · Science · doi:10.1126/science.aaa1934 · Cited by 3,124
Comparison of Discrimination Methods for the Classification of Tumors Using Gene Expression Data
Dudoit, S., Fridlyand, J., & Speed, T. P. (2002) · Journal of the American Statistical Association · doi:10.1198/016214502753479248 · Cited by 2,671
Batch effects in single-cell RNA-sequencing data are corrected by matching mutual nearest neighbors
Haghverdi, L., Lun, A. T. L., Morgan, M. D., & Marioni, J. C. (2018) · Nature Biotechnology · doi:10.1038/nbt.4091 · Cited by 2,416
Cited by
Sorted by citations
Items 201–300 of 383
Morizet, D., Foucher, I., Mignerey, I., Alunni, A., & Bally‐Cuif, L. (2025) · Science Advances · doi:10.1126/sciadv.adu3189 · Cited by 8
Zhang, X., Wu, Z., He, H., Guan, Q., Ouyang, Q., Wang, R., Xie, L., Zhou, Y., Feng, B., Luo, Z., et al. (2025) · Cell stem cell · doi:10.1016/j.stem.2025.10.001 · Cited by 6
Wegmann, R., Neri, M., Schuierer, S., Bilican, B., Hartkopf, H., Nigsch, F., Mapa, F., Waldt, A., Cuttat, R., Salick, M. R., et al. (2019) · bioRxiv (Cold Spring Harbor Laboratory) · doi:10.1101/514950 · Cited by 6
The Heterogeneity, Parallels, and Divergence of Alveolar Macrophages in Humans and Mice
Li, X., & Jakubzick, C. (2024) · American Journal of Respiratory Cell and Molecular Biology · doi:10.1165/rcmb.2024-0315le · Cited by 5
Xiao, Y., Zou, X., Yang, B. J., & Huang, L. (2025) · Science China Life Sciences · doi:10.1007/s11427-025-2993-2 · Cited by 8
Walsh, J. T., Junker, I. P., Chen, Y., Chen, Y., Gifford, H., Chen, D. S., & Ding, Y. (2025) · Proceedings of the National Academy of Sciences · doi:10.1073/pnas.2516083122 · Cited by 5
Yao, X., Xu, Z., Xi, Y., He, X., Gao, Q., Lu, J., & Fu, P. (2026) · Genome biology · doi:10.1186/s13059-025-03904-z · Cited by 5
Li, Y., Liu, X., Zhang, X., Wang, H., Chen, J., Wei, J., Li, Y., Chen, H., Wang, Q., Liu, K., et al. (2022) · Cells · doi:10.3390/cells11243978 · Cited by 5
Zhang, Z., Cai, X., Liang, J., Liu, J., Guo, J., Yang, W., Wang, X., & Wu, J. (2025) · Cell Reports · doi:10.1016/j.celrep.2025.115725 · Cited by 5
Kang, H., Liu, Q., Seim, I., Zhang, W., Li, H., Gao, H., Lin, W., Lin, M., Zhang, P., Zhang, Y., et al. (2023) · Molecular Ecology Resources · doi:10.1111/1755-0998.13775 · Cited by 5
Characterization of human pluripotent stem cell differentiation by single-cell dual-omics analyses
Liu, D., Fu, Y., Wang, X., Wang, X., Fang, X., Zhou, Y., Wang, R., Zhang, P., Jiang, M., Jia, D., et al. (2023) · Stem Cell Reports · doi:10.1016/j.stemcr.2023.10.018 · Cited by 5
RNA-seq data in pain research–an illustrated guide
Crow, M., & Denk, F. (2019) · Pain · doi:10.1097/j.pain.0000000000001562 · Cited by 5
Self-citationDistinguishing cell phenotype using cell epigenotype
Wytock, T. P., & Motter, A. E. (2020) · Science Advances · doi:10.1126/sciadv.aax7798 · Cited by 6
scASK: A Novel Ensemble Framework for Classifying Cell Types Based on Single-cell RNA-seq Data
Liu, B., Wu, F., & Zou, X. (2021) · IEEE Journal of Biomedical and Health Informatics · doi:10.1109/jbhi.2021.3050963 · Cited by 5
Spatiotemporal strategies to identify aggressive biology in precancerous breast biopsies
Frankhauser, D. E., Jovanović‐Talisman, T., Lai, L. L., Yee, L. D., Wang, L. V., Mahabal, A. A., Geradts, J., Rockne, R. C., Tomšič, J., Jones, V., et al. (2020) · WIREs Mechanisms of Disease · doi:10.1002/wsbm.1506 · Cited by 5
Coexpression enables multi-study cellular trajectories of development and diseasePreprint
Hie, B., Cho, H., Bryson, B. D., & Berger, B. (2019) · bioRxiv (Cold Spring Harbor Laboratory) · doi:10.1101/719088 · Cited by 5
A Meta-Analytic Single-Cell Atlas of Mouse Bone Marrow Hematopoietic DevelopmentPreprint
Harris, B. D., Lee, J., & Gillis, J. (2021) · bioRxiv (Cold Spring Harbor Laboratory) · doi:10.1101/2021.08.12.456098 · Cited by 5
Self-citationBatch alignment of single-cell transcriptomics data using deep metric learningPreprint
Yu, X., Xu, X., Zhang, J., & Li, X. (2022) · Research Square · doi:10.21203/rs.3.rs-2049486/v1 · Cited by 6
A comparative transcriptomic analysis of mouse demyelination models and multiple sclerosis lesions
Aboelnour, E. L., Vanoverbeke, V. R., Maupin, E. A., Hatfield, M. M., & Adams, K. L. (2026) · Nature Communications · doi:10.1038/s41467-026-72383-y · Cited by 4
Cell-cell communication-mediated cell-type-specific parent-of-origin effects in mammals
Wu, J., Zheng, E., Liu, L., Quan, J., Ruan, D., Yao, Z., Yang, J., Li, X., Yang, M., Yang, M., et al. (2025) · Nature Communications · doi:10.1038/s41467-025-60469-y · Cited by 4
Xue, B., Liu, Y., Zhou, C., Dossybayev, K., Baatar, N., Yudin, N. S., Zhang, L., Yang, J., MengHua, L. I., & Xu, S. (2026) · Journal of Animal Science and Biotechnology/Journal of animal science and biotechnology · doi:10.1186/s40104-026-01383-1 · Cited by 4
Adaptive cellular evolution in the intestine of hyperdiverse cichlid fishes
Fages, A., Luxey, M., Ronco, F., Huyghe, C. E. T., Fischer, S., Viktorin, G., Menon, P. N. K., Indermaur, A., Salzburger, W., & Tschopp, P. (2026) · Nature · doi:10.1038/s41586-026-10494-8 · Cited by 8
Abdank, K., Cetin, S. Z., Abedini, A., Suszták, K., Eckardt, K., & Balzer, M. S. (2024) · Nephrology Dialysis Transplantation · doi:10.1093/ndt/gfae030 · Cited by 4
scPerb: Predict single-cell perturbation via style transfer-based variational autoencoder
Tang, Z., Zhou, M., Zhang, K., & Song, Q. (2024) · Journal of Advanced Research · doi:10.1016/j.jare.2024.10.035 · Cited by 6
Exploring the role of transcriptional and post‐transcriptional processes in mRNA co‐expression
García‐Blay, Ó., Verhagen, P. G. A., Martin, B., & Hansen, M. M. K. (2023) · BioEssays · doi:10.1002/bies.202300130 · Cited by 4
A single-cell transcriptomic study of heterogeneity in human embryonic tanycytes
Bai, Y., Chen, Q., & Li, Y. (2024) · Scientific Reports · doi:10.1038/s41598-024-66044-7 · Cited by 4
Weigao, E., Fei, L., Wang, J., Wang, X., Wang, R., Wang, X., Zhang, P., Chen, J., Wu, J., Jiang, M., et al. (2025) · Advanced Science · doi:10.1002/advs.202409642 · Cited by 4
Conserved coexpression at single cell resolution across primate brainsPreprint
Suresh, H., Crow, M., Jorstad, N. L., Hodge, R. D., Lein, E. S., Dobin, A., Bakken, T. E., & Gillis, J. A. (2022) · bioRxiv (Cold Spring Harbor Laboratory) · doi:10.1101/2022.09.20.508736 · Cited by 4
Self-citationMolecular logic for cellular specializations that initiate the auditory parallel processing pathwaysPreprint
Jing, J., Hu, M., Ngodup, T., Ma, Q., Lau, S.-N. N., Ljungberg, M. C., McGinley, M. J., Trussell, L. O., & Jiang, X. (2023) · bioRxiv (Cold Spring Harbor Laboratory) · doi:10.1101/2023.05.15.539065 · Cited by 4
A consensus spinal cord cell type atlas across mouse, macaque, and humanPreprint
Schmitz, M. T., Johansen, N., Kempynck, N., Kapen, I., Fu, Y., Hewitt, M. N., Seeman, S. C., Kussick, E., Gautier, O., Leone, M. J., et al. (2026) · bioRxiv (Cold Spring Harbor Laboratory) · doi:10.64898/2026.02.04.703852 · Cited by 6
Neural networks reveal novel gene signatures in Parkinson disease from single-nuclei transcriptomes
Fiorini, M. R., Li, J., Fon, E. A., Farhan, S. M. K., & Thomas, R. A. (2025) · npj Parkinson s Disease · doi:10.1038/s41531-025-01147-0 · Cited by 3
Subventricular zone radial glial cells maintain inhibitory neuron production in the human brain
Jia, L., Li, X., Yan, Y., Xu, L., Guo, J., Wang, W., Zhang, W., Li, L., Shang, B., Zhang, Y., et al. (2026) · Science · doi:10.1126/science.adw1803 · Cited by 4
Li, Y., Zhang, S., Zhang, B., Yin, Y., & Yu, H. (2026) · Molecular Plant · doi:10.1016/j.molp.2026.03.016 · Cited by 8
Generation of human appetite-regulating neurons and tanycytes from pluripotent stem cells
Abay-Nørgaard, Z., Mueller, A. K., Hänninen, E., Belmont-Rausch, D. M., Piilgaard, L., Trujillo, L. S., Fedrizzi, L., Christensen, J. B., Salvador, A., Schörling, A. L., et al. (2026) · Cell stem cell · doi:10.1016/j.stem.2026.05.005 · Cited by 5
The brain atlas of a subsocial bee reflects that of eusocial Hymenoptera
Pyenson, B. C., Huisken, J. L., Gupta, N., & Rehan, S. M. (2024) · Genes Brain & Behavior · doi:10.1111/gbb.70007 · Cited by 4
Improving replicability in single-cell RNA-Seq cell type discovery with Dune
de Bézieux, H. R., Street, K., Fischer, S., den Berge, K. V., Chance, R. K., Risso, D., Gillis, J., Ngai, J., Purdom, E. A., & Dudoit, S. (2024) · BMC Bioinformatics · doi:10.1186/s12859-024-05814-6 · Cited by 5
Self-citationOptimized protocol for the multiomics processing of cryopreserved human kidney tissue
Gies, S. E., Hänzelmann, S., Kylies, D., Lassé, M., Lagies, S., Hausmann, F., Khatri, R., Zolotarev, N., Poets, M., Zhang, T., et al. (2024) · American Journal of Physiology-Renal Physiology · doi:10.1152/ajprenal.00404.2023 · Cited by 3
Paul, A., & Huang, Z. J. (2018) · Journal of Visualized Experiments · doi:10.3791/58690 · Cited by 3
Self-citationHuang, Z. J., & Paul, A. (2018) · bioRxiv (Cold Spring Harbor Laboratory) · doi:10.1101/490797 · Cited by 3
Self-citationAdaptive cellular evolution in the intestinal tracts of hyperdiverse African cichlid fishesPreprint
Fages, A., Luxey, M., Ronco, F., Huyghe, C. E. T., Menon, P. N. K., Indermaur, A., Salzburger, W., & Tschopp, P. (2024) · bioRxiv (Cold Spring Harbor Laboratory) · doi:10.1101/2024.11.28.625862 · Cited by 3
Liu, M., Restelli, F. F., Micoli, E., Barbiera, G., Moors, R., Nouboers, E., Reverendo, M., Du, J. X., Bertels, H., Konstantopoulos, D., et al. (2025) · bioRxiv (Cold Spring Harbor Laboratory) · doi:10.1101/2025.02.19.636192 · Cited by 3
Wang, L., Ao, H., Liu, H., Zhao, Q., Ma, F., Yang, J., Wang, J., Wang, X., Liu, G., Niu, X., et al. (2025) · BMC Genomics · doi:10.1186/s12864-025-12280-8 · Cited by 2
Cheng, J., Han, K., Xu, D., Tian, H., Zhang, X., Zhao, L., Yang, X., Zhang, D., Huang, K., Zhang, Y., et al. (2026) · Communications Biology · doi:10.1038/s42003-026-09581-3 · Cited by 2
Family single-cell atlases reveal pig pregnancy and fetal growth restriction critical cell types
Cai, L., Zhang, Q., Yao, T., Zou, X., Xie, L., Yang, S., Xiao, Y., Huang, F., Peng, Z., Yang, J., et al. (2026) · Science · doi:10.1126/science.adu7265 · Cited by 2
Liu, L., Gao, L., Wang, Z., Liu, Y., Ju, H., Lin, H., Shi, Z., Cai, W., Li, X., Huang, Y., et al. (2026) · New Phytologist · doi:10.1111/nph.71285 · Cited by 2
Single-cell spatial map of cis-regulatory elements for disease-related genes in the macaque cortex
Meng, J., Chen, C., Zhu, Z., Sun, Y., Huang, Y., Fu, J., Wu, L., Li, L., Li, L., Bai, Y., et al. (2026) · Nature Communications · doi:10.1038/s41467-026-70497-x · Cited by 2
Statistical Methods for Single‐Cell RNA‐Sequencing
Andrews, T. S., Kiselev, V. Y., & Hemberg, M. (2019) · Wiley eBooks · doi:10.1002/9781119487845.ch26 · Cited by 2
Coexpression reveals conserved mechanisms of transcriptional cell identityPreprint
Crow, M., Suresh, H., Lee, J., & Gillis, J. A. (2020) · bioRxiv (Cold Spring Harbor Laboratory) · doi:10.1101/2020.11.10.375758 · Cited by 2
Self-citationLi, J., Wang, J., Zhang, P., Wang, R., Mei, Y., Sun, Z., Fei, L., Jiang, M., Ma, L., Weigao, E., et al. (2022) · Research Square · doi:10.21203/rs.3.rs-1544073/v1 · Cited by 2
Jung, M., Dourado, M., Maksymetz, J., Jacobson, A. R., Baca, M., Foreman, O., Hackos, D. H., Riol‐Blanco, L., & Kaminker, J. S. (2022) · bioRxiv (Cold Spring Harbor Laboratory) · doi:10.1101/2022.06.21.497049 · Cited by 2
MAPseq2: a sensitive barcoded connectomics methodPreprint
Kim, H., Qi, H., Washington, C., Liang, X. Y., & Kebschull, J. M. (2025) · bioRxiv (Cold Spring Harbor Laboratory) · doi:10.1101/2025.06.23.661165 · Cited by 2
Phillips, R. A., Yao, J., Bach, S. V., Rosario, I. D., Du, Y., Maguire, S. E., Zhang, R., Miller, R. A., Kleinman, J. E., Hyde, T. M., et al. (2026) · bioRxiv (Cold Spring Harbor Laboratory) · doi:10.64898/2026.09.25.754413 · Cited by 2
Connectivity Network Feature Sharing in Single-Cell RNA Sequencing Data Identifies Rare Cells
Wang, S., Li, H., Liu, Y., Pang, S., Qiao, S., Su, J., Wang, S., & Zhang, Y. (2024) · Journal of Chemical Information and Modeling · doi:10.1021/acs.jcim.4c00796 · Cited by 1
Liu, H., Meng, L., Ma, J., Yang, B., Wang, H., Li, X., Mu, X., Zheng, L., Chen, H., Liu, Y., et al. (2025) · Insect Science · doi:10.1111/1744-7917.70157 · Cited by 1
Wang, Q., Deng, L., Xu, S., Guo, P., Zhu, H., Ge, H., Gong, Y., Du, G., Huang, K., Su, C., et al. (2025) · Interdisciplinary medicine · doi:10.1002/inmd.70067 · Cited by 2
Balzer, M. S., Zhou, J., Abedini, A., Ma, Z., Hou, Y., Yadav, T., Grundmann, M., Pavkovic, M., & Suszták, K. (2026) · Journal of the American Society of Nephrology · doi:10.1681/asn.0000000995 · Cited by 1
Integrative Learning of Disentangled Representations from Single-Cell RNA-Sequencing Datasets
Novella-Rausell, C., Peters, D. J. M., & Mahfouz, A. E. (2026) · Computational and Structural Biotechnology Journal · doi:10.34133/csbj.0015 · Cited by 1
Cell type-agnostic transcriptomic signatures enable uniform comparisons of neural maturation
Venkatesan, S., Werner, J. M., Li, Y., & Gillis, J. (2026) · PLoS Biology · doi:10.1371/journal.pbio.3003757 · Cited by 1
Self-citationCross-species insights into placental evolution and diseases at the single-cell resolution
Tan, G., Zhang, A., Cao, X., Yang, J., Cui, Y., Wang, F., Shi, T., Li, H., Wang, H., Shan, H., et al. (2026) · Nature Communications · doi:10.1038/s41467-026-72652-w · Cited by 2
Mapping the transcriptional diversity of calcium signaling in the mouse and human brain
Rayyes, I. A., Louhivuori, L. M., Ellström, I. D., Smedler, E., & Uhlén, P. (2026) · iScience · doi:10.1016/j.isci.2026.116055 · Cited by 1
A single-cell atlas of alternative wing development in two hemipteran species
Wan, Y., Wu, H., Huang, H.-G., Liu, Z. H., Sun, Z., Yang, Z., & Xu, H. (2026) · Nature Communications · doi:10.1038/s41467-026-75225-z · Cited by 2
Bhaduri, A., Andrews, M. G., & Kriegstein, A. R. (2020) · Elsevier eBooks · doi:10.1016/b978-0-12-814405-3.00029-1 · Cited by 1
Deep zero-inflated negative binomial model and its application in scRNA-seq data integration
Wei, M., Liu, R., Wang, Y. J., & Huang, C. (2023) · IEEE SoutheastCon · doi:10.1109/southeastcon51012.2023.10115099 · Cited by 1
Lin, Y., Li, X., Fang, J., Zeng, Q., Cheng, D., Wang, G., Shi, R., Luo, Y., Ma, Y., Li, M., et al. (2024) · International Immunopharmacology · doi:10.1016/j.intimp.2024.112070 · Cited by 1
A critical assessment of single-cell transcriptomes sampled following patch-clamp electrophysiologyPreprint
Tripathy, S. J., Toker, L., Bomkamp, C., Mancarci, B. O., Belmadani, M., & Pavlidis, P. (2018) · bioRxiv (Cold Spring Harbor Laboratory) · doi:10.1101/298133 · Cited by 1
(2015) · Wiley eBooks · doi:10.1002/9783527678679.dg11959 · Cited by 1
He, C., Kalafut, N. C., Sandoval, S. O., Risgaard, R. D., Yang, C., Khullar, S., Suzuki, M., Chang, Q., Zhao, X., Sousa, A. M. M., et al. (2022) · bioRxiv (Cold Spring Harbor Laboratory) · doi:10.1101/2022.06.13.495946 · Cited by 1
Chen, H., Li, G., Liu, J., Sonthalia, S., Stein-O’Brien, G., Xiao, L., Caffo, B. S., & Colantuoni, C. (2022) · bioRxiv (Cold Spring Harbor Laboratory) · doi:10.1101/2022.11.07.515489 · Cited by 1
Adam, A. R., Martínez‐López, J. A., van der Spek, S. J. F., Sullivan, P. F., Smit, A. B., Verhage, M., & Hjerling‐Leffler, J. (2022) · bioRxiv (Cold Spring Harbor Laboratory) · doi:10.1101/2022.11.25.517899 · Cited by 1
Robust parametric UMAP for the analysis of single-cell dataPreprint
Zhang, G., & Xu, B. (2023) · bioRxiv (Cold Spring Harbor Laboratory) · doi:10.1101/2023.11.14.567092 · Cited by 1
Revising the ortholog conjecture in cross-species comparison of scRNA-seq dataPreprint
Song, Y., Arendt, D., Papatheodorou, I., & Brāzma, A. (2024) · bioRxiv (Cold Spring Harbor Laboratory) · doi:10.1101/2024.06.21.600109 · Cited by 2
Nie, P., Zhan, Y., Chen, R., Qi, R., Liu, C., & Wang, G.-Z. (2024) · bioRxiv (Cold Spring Harbor Laboratory) · doi:10.1101/2024.12.11.627878 · Cited by 1
Lucas, T. A., Novikova, G., Rao, S., Wang, Y., Laufer, B. I., Pandey, S., Webb, M. G., Jorstad, N. L., Friedman, B. A., Hanson, J. E., et al. (2025) · bioRxiv (Cold Spring Harbor Laboratory) · doi:10.1101/2025.02.12.637903 · Cited by 1
scRetinaDB: A Comprehensive Database of Single-Cell and Spatial Omics from Cross-Species RetinasPreprint
Tang, M., Jiang, F., Stoica, A.-F., Chen, J., Wang, J., Yao, K., Chen, Z., Xu, X., & Wang, J. (2025) · bioRxiv (Cold Spring Harbor Laboratory) · doi:10.1101/2025.10.11.681556 · Cited by 1
Supporting-like cells constitute an alternative steroidogenic lineage conserved in amniotesPreprint
Barberá-Aura, I., Chung, W.-Y., Dujardin, É., Hurtado, A., Galmiche, M., Mayère, C., Guy, M., Mandon‐Pepin, B., Franke, V., Jaszczyszyn, Y., et al. (2026) · bioRxiv (Cold Spring Harbor Laboratory) · doi:10.64898/2026.05.25.726204 · Cited by 1
Ballouz, S. (2020) · Wiley eBooks · doi:10.1002/9780470015902.a0028528
Self-citationCao, D., Chan, R., Ng, E. H. Y., Gemzell‐Danielsson, K., & Yeung, W. S. B. (2020) · bioRxiv (Cold Spring Harbor Laboratory) · doi:10.1101/2020.04.03.004523
Yang, Y., Booker, S. A., Clegg, J. M., Urzainqui, I. Q., Sumera, A., Kozić, Z., Dando, O., Lorenzo, S. M., Hérault, Y., Kind, P. C., et al. (2021) · bioRxiv (Cold Spring Harbor Laboratory) · doi:10.1101/2021.06.03.446920
Whittow, M. (2005) · Speculum
Tiwari, V. K., & Singh, A. P. (2020) · Faculty Opinions – Post-Publication Peer Review of the Biomedical Literature · doi:10.3410/f.736463800.793571577
Ji, R. (2021) · Faculty Opinions – Post-Publication Peer Review of the Biomedical Literature · doi:10.3410/f.739695496.793583806
Tong, R., Li, R., Zhao, Y., Luo, L., Zhong, J., Li, Z., Lin, W., Chen, Y., Shi, J., Gao, Y., et al. (2022) · bioRxiv (Cold Spring Harbor Laboratory) · doi:10.1101/2022.07.11.498621 · Cited by 1
A universal preservation protocol for multi-omic and histological analysis of kidney tissuePreprint
Gies, S. E., Hänzelmann, S., Kylies, D., Lagies, S., Lassé, M., Hausmann, F., Khatri, R., Poets, M., Zhang, T., Lu, S. Y., et al. (2023) · bioRxiv (Cold Spring Harbor Laboratory) · doi:10.1101/2023.08.16.553482
Li, J., Chen, D., Zheng, Z., & Chen, J. (2023) · International Conference on Intelligent Computing and Signal Processing (ICSP) · doi:10.1109/icsp58490.2023.10248768
Krull, K. K., Ali, S. A., & Krijgsveld, J. (2024) · bioRxiv (Cold Spring Harbor Laboratory) · doi:10.1101/2024.01.10.575010
Additional file 17 of A single-cell survey of cellular hierarchy in acute myeloid leukemia
Wu, J., Xiao, Y., Sun, J., Sun, H., Chen, H., Zhu, Y., Fu, H., Yu, C., Weigao, E., Lai, S., et al. (2020) · Figshare · doi:10.6084/m9.figshare.13011051
Additional file 20 of A single-cell survey of cellular hierarchy in acute myeloid leukemia
Wu, J., Xiao, Y., Sun, J., Sun, H., Chen, H., Zhu, Y., Fu, H., Yu, C., Weigao, E., Lai, S., et al. (2020) · Figshare · doi:10.6084/m9.figshare.13011063
Additional file 15 of A single-cell survey of cellular hierarchy in acute myeloid leukemia
Wu, J., Xiao, Y., Sun, J., Sun, H., Chen, H., Zhu, Y., Fu, H., Yu, C., Weigao, E., Lai, S., et al. (2020) · Figshare · doi:10.6084/m9.figshare.13011045
Additional file 14 of A single-cell survey of cellular hierarchy in acute myeloid leukemia
Wu, J., Xiao, Y., Sun, J., Sun, H., Chen, H., Zhu, Y., Fu, H., Yu, C., Weigao, E., Lai, S., et al. (2020) · Figshare · doi:10.6084/m9.figshare.13011042
Additional file 19 of A single-cell survey of cellular hierarchy in acute myeloid leukemia
Wu, J., Xiao, Y., Sun, J., Sun, H., Chen, H., Zhu, Y., Fu, H., Yu, C., Weigao, E., Lai, S., et al. (2020) · Figshare · doi:10.6084/m9.figshare.13011057
Additional file 16 of A single-cell survey of cellular hierarchy in acute myeloid leukemia
Wu, J., Xiao, Y., Sun, J., Sun, H., Chen, H., Zhu, Y., Fu, H., Yu, C., Weigao, E., Lai, S., et al. (2020) · Figshare · doi:10.6084/m9.figshare.13011048
Additional file 18 of A single-cell survey of cellular hierarchy in acute myeloid leukemia
Wu, J., Xiao, Y., Sun, J., Sun, H., Chen, H., Zhu, Y., Fu, H., Yu, C., Weigao, E., Lai, S., et al. (2020) · Figshare · doi:10.6084/m9.figshare.13011054
Liu, M., Yang, L., Guo, J., Wang, H., Yu, S., Wang, P., Yang, Y. J., Huang, L., Cui, X., & Liu, Y. (2024) · Research Square · doi:10.21203/rs.3.rs-4421877/v1
Shi, Y., Ma, Y., Chen, X. '., & Gao, J. (2024) · Current Bioinformatics · doi:10.2174/0115748936334071240903064630
Farhan, S. M. K., Fiorini, M. R., Li, J., Fon, E. A., & Thomas, R. A. (2024) · Research Square · doi:10.21203/rs.3.rs-5471740/v1
Jocher, J., Janssen, P., Vieth, B., Edenhofer, F. C., Dietl, T., Térmeg, A., Spurk, P., Geuder, J., Enard, W., & Hellmann, I. (2026) · eLife · doi:10.7554/elife.105398.3
Cell Type-Agnostic Transcriptomic Signatures Enable Uniform Comparisons of NeurodevelopmentPreprint
Venkatesan, S., Werner, J. M., Li, Y., & Gillis, J. A. (2025) · bioRxiv (Cold Spring Harbor Laboratory) · doi:10.1101/2025.02.24.639936
Self-citationGaertner, Z. A., Oram, C., Schneeweis, A. K., Schonfeld, E., Bolduc, C., Chen, C., Dombeck, D. A., Parisiadou, L., Poulin, J.-F., & Awatramani, R. B. (2025) · eLife · doi:10.7554/elife.101035.2
Jocher, J., Janssen, P., Vieth, B., Edenhofer, F. C., Dietl, T., Térmeg, A., Spurk, P., Geuder, J., Enard, W., & Hellmann, I. (2025) · eLife · doi:10.7554/elife.105398.1
Jocher, J., Janssen, P., Vieth, B., Edenhofer, F. C., Dietl, T., Térmeg, A., Spurk, P., Geuder, J., Enard, W., & Hellmann, I. (2025) · eLife · doi:10.7554/elife.105398
Metadata
- Authors
- Crow, M., Paul, A., Ballouz, S., Huang, Z. J., & Gillis, J.
- Affiliations
- Cold Spring Harbor Laboratory (US)
- Corresponding author
- Gillis, Jesse
- Venue
- Nature Communications
- Published
- 2018-02-28
- Volume
- 9
- Issue
- 1
- Pages
- 884-884
- ISSN
- 2041-1723 (ISSN-L)
- PMC
- PMC5830442
- OpenAlex
- W2804847416
- Cited by
- 365
- References
- 59
- Citations by year
- 2026: 51 · 2025: 51 · 2024: 68 · 2023: 45 · 2022: 30 · 2021: 26 · 2020: 44 · 2019: 32 · 2018: 14
- FWCI
- 10.94
- Type
- journal article
- Language
- en
- Open access
- gold
- doi.org
- Locations
- Nature Communications (publishedVersion, cc-by)
- bioRxiv (Cold Spring Harbor Laboratory) (acceptedVersion, cc-by-nc-nd)
- Europe PMC (PubMed Central) (publishedVersion, cc-by)
- PubMed Central (publishedVersion, cc-by)
- PubMed (publishedVersion)
- Cold Spring Harbor Laboratory Institutional Repository (Cold Spring Harbor Laboratory) (acceptedVersion)
- UNSWorks (UNSW Sydney) (submittedVersion, cc-by-nc-nd)
- RePEc: Research Papers in Economics (submittedVersion)
- DOAJ (DOAJ: Directory of Open Access Journals) (submittedVersion)
- DOAJ (DOAJ: Directory of Open Access Journals) (submittedVersion, cc-by-sa)
- Funders
- National Alliance for Research on Schizophrenia and Depression
- Cold Spring Harbor Laboratory
- National Institutes of Health (1f32mh114501-01)
- National Institute of Mental Health (R01MH094705, R01MH109665, R01MH113005, F32-MH114501)
- U.S. National Library of Medicine (R01LM012736)
- Topics
- Life Sciences › Biochemistry, Genetics and Molecular Biology › Molecular Biology › Single-cell and spatial transcriptomics
- Life Sciences › Biochemistry, Genetics and Molecular Biology › Molecular Biology › Gene expression and cancer classification
- Life Sciences › Biochemistry, Genetics and Molecular Biology › Molecular Biology › Genomics and Phylogenetic Studies
- Keywords
- replicability, single-cell RNA sequencing, cell type annotation, meta-analysis, neuronal identity, interneuron subtypes, marker genes, cluster similarity, technical bias
- MeSH terms
- Humans, Neurons, RNA, Sequence Analysis, RNA, Computational Biology, Gene Expression Profiling, Single-Cell Analysis
About these checks
Registry, retraction, Cites and statistics results are computed, not judged, with one exception: a printed reference that no index lists is read once by a model before it counts as a citation error. Claims are extracted by a model and kept only when their quote appears verbatim in the text; each cited source is then checked, with a model’s help, for whether it says what the claim relies on. Those verdicts can be wrong — read the claim’s quote and the cited source before relying on one.
Statistics and arithmetic are recomputed, not judged.
Confidence bands are shown only for fields calibrated on our annotated test set. None is calibrated yet, so no band is shown.
What counts as a claim ›How we measure confidence ›How we check this ›
Are you an author, or do you see a problem with this page? Request a review
