

The DOI matches its Crossref record; 68 of the 68 references it cites were found in a registry or an index.
Treating cat allergy with monoclonal IgG antibodies that bind allergen and prevent IgE engagement
Open accessAbstract
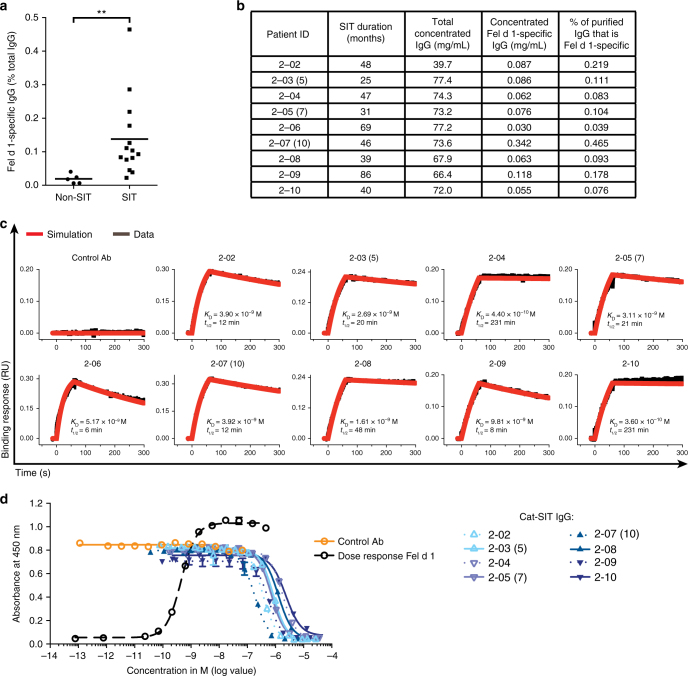
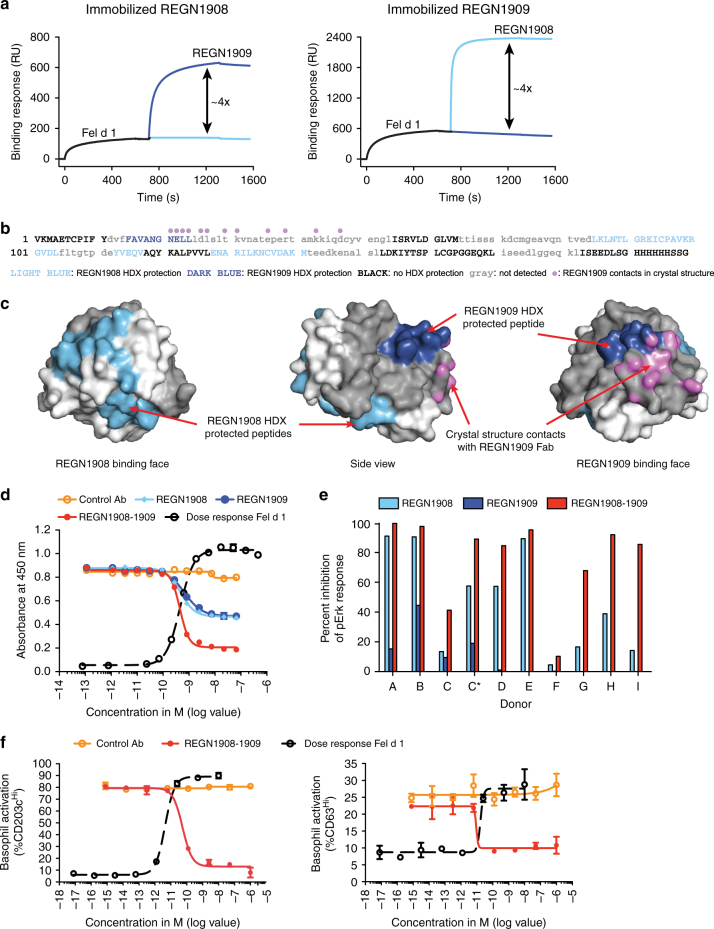
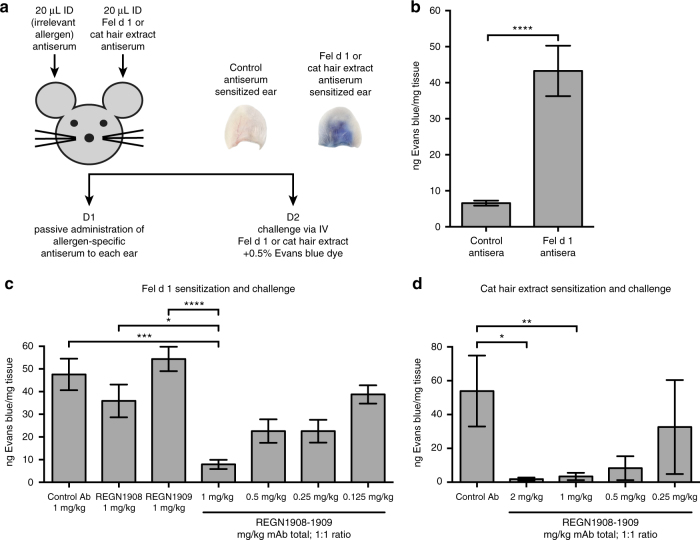
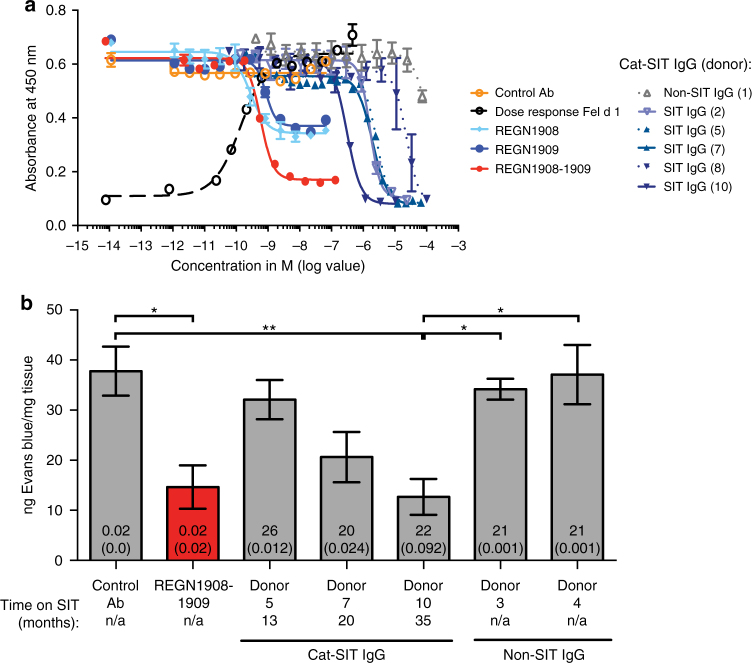
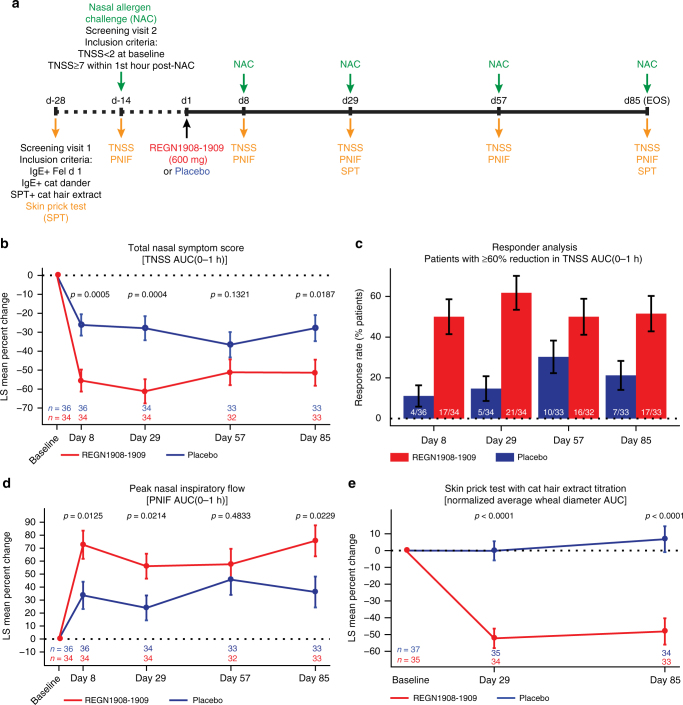
Acute allergic symptoms are caused by allergen-induced crosslinking of allergen-specific immunoglobulin E (IgE) bound to Fc-epsilon receptors on effector cells. Desensitization with allergen-specific immunotherapy (SIT) has been used for over a century, but the dominant protective mechanism remains unclear. One consistent observation is increased allergen-specific IgG, thought to competitively block allergen binding to IgE. Here we show that the blocking potency of the IgG response to Cat-SIT is heterogeneous. Next, using two potent, pre-selected allergen-blocking monoclonal IgG antibodies against the immunodominant cat allergen Fel d 1, we demonstrate that increasing the IgG/IgE ratio reduces the allergic response in mice and in cat-allergic patients: a single dose of blocking IgG reduces clinical symptoms in response to nasal provocation (ANCOVA, p = 0.0003), with a magnitude observed at day 8 similar to that reported with years of conventional SIT. This study suggests that simply augmenting the blocking IgG/IgE ratio may reverse allergy.
Overview
The claims and statistics of this paper haven’t been checked yet.
Run the check — free, no account needed. It reads the open-access text and checks the sources it cites.
Integrity signals
Registry
Cites
Statistics
Figures
Verification
Claims the paper makes
The claims and statistics of this paper haven’t been checked yet.
Run the check — free, no account needed. It reads the open-access text and checks the sources it cites.
Claims other papers make about this one
Each is checked against this paper’s own text: does it say what the citing paper says it does?
The cited source says what the claim attributes to it.
In the citing paper
“The monoclonal antibody regimen REGN1908/1909 demonstrated significant symptom relief and durable efficacy in a phase Ib clinical trial [161].”
From Advance in Managing Indoor Cat Allergen Proteins: Molecular Insights, Detection, and Control (2025) · cites this paper as [161]
Self-check
Percentages, sums and reported differences re-computed from the paper’s own numbers.
The self-check needs the paper’s full text.
Citations
Cites
Features and development of Coot
Emsley, P., Lohkamp, B., Scott, W. G., & Cowtan, K. (2010) · Acta Crystallographica Section D Biological Crystallography · doi:10.1107/s0907444910007493 · Cited by 29,915
Phaser crystallographic software
McCoy, A. J., Grosse-Kunstleve, R. W., Adams, P. D., Winn, M. D., Storoni, L. C., & Read, R. J. (2007) · Journal of Applied Crystallography · doi:10.1107/s0021889807021206 · Cited by 20,612
Two Phase 3 Trials of Dupilumab versus Placebo in Atopic Dermatitis
Simpson, E. L., Bieber, T., Guttman-Yassky, E., Beck, L. A., Blauvelt, A., Cork, M. J., Silverberg, J. I., Deleuran, M., Kataoka, Y., Lacour, J.-P., et al. (2016) · New England Journal of Medicine · doi:10.1056/nejmoa1610020 · Cited by 2,110
Self-citationDupilumab Treatment in Adults with Moderate-to-Severe Atopic Dermatitis
Beck, L. A., Thaçi, D., Hamilton, J. D., Graham, N. M. H., Bieber, T. R. M., Rocklin, R. E., Ming, J. E., Ren, H., Kao, R., Simpson, E. L., et al. (2014) · New England Journal of Medicine · doi:10.1056/nejmoa1314768 · Cited by 1,435
Self-citationLong-Term Clinical Efficacy of Grass-Pollen Immunotherapy
Durham, S. R., Walker, S. M., Varga, E., Jacobson, M. R., O'Brien, F., Noble, W. J., Till, S. J., Hamid, Q. A., & Nouri‐Aria, K. T. (1999) · New England Journal of Medicine · doi:10.1056/nejm199908123410702 · Cited by 1,371
PROPHYLACTIC INOCULATION AGAINST HAY FEVER
Noon, L. (1911) · The Lancet · doi:10.1016/s0140-6736(00)78276-6 · Cited by 1,343
Integrated signalling pathways for mast-cell activation
Gilfillan, A. M., & Tkaczyk, C. (2006) · Nature reviews. Immunology · doi:10.1038/nri1782 · Cited by 955
Wenzel, S. E., Castro, M., Corren, J., Maspero, J. F., Wang, L., Zhang, B., Pirozzi, G., Sutherland, E. R., Evans, R. R., Joish, V. N., et al. (2016) · The Lancet · doi:10.1016/s0140-6736(16)30307-5 · Cited by 909
Self-citationBachert, C., Mannent, L., Naclerio, R. M., Mullol, J., Ferguson, B. J., Gevaert, P., Hellings, P., Jiao, L., Wang, L., Evans, R. R., et al. (2016) · JAMA · doi:10.1001/jama.2015.19330 · Cited by 794
Self-citationClinical efficacy and immune regulation with peanut oral immunotherapy
Jones, S. M., Pons, L., Roberts, J. L., Scurlock, A. M., Perry, T. T., Kulis, M., Shreffler, W. G., Steele, P. H., Henry, K. A., Adair, M., et al. (2009) · Journal of Allergy and Clinical Immunology · doi:10.1016/j.jaci.2009.05.022 · Cited by 718
Research works printed but not linked: 2
- Circassia. Circassia announces top-line results from cat allergy phase III study. http://www.circassia.com/media/press-releases/circassia-announces-top-line-results-from-cat-allergy-phase-III-study. Accessed: 30 June 2016 (2016).
- Circassia. Circassia aunnounces top-line results from house dust mite allergy field study. http://www.circassia.com/media/press-releases/circassia-announces-top-line-results-from-house-dust-mite-allergy-field-study/ Accessed: 19 April 2017 (2017).
Cited by
Sorted by citations
Allergen immunotherapy: past, present and future
Durham, S. R., & Shamji, M. H. (2022) · Nature reviews. Immunology · doi:10.1038/s41577-022-00786-1 · Cited by 435
The role of allergen‐specific IgE, IgG and IgA in allergic disease
Shamji, M. H., Valenta, R., Jardetzky, T. S., Verhasselt, V., Durham, S. R., Würtzen, P. A., & van Neerven, R. J. J. (2021) · Allergy · doi:10.1111/all.14908 · Cited by 363
EAACI Molecular Allergology User's Guide 2.0
Dramburg, S., Hilger, C., Santos, A. F., Vecillas, L. D. L., Aalberse, R. C., Acevedo, N., Aglas, L., Altmann, F., Arruda, L. K., Asero, R., et al. (2023) · Pediatric Allergy and Immunology · doi:10.1111/pai.13854 · Cited by 342
High-affinity allergen-specific human antibodies cloned from single IgE B cell transcriptomes
Croote, D., Darmanis, S., Nadeau, K. C., & Quake, S. R. (2018) · Science · doi:10.1126/science.aau2599 · Cited by 220
IgE and IgG Antibodies as Regulators of Mast Cell and Basophil Functions in Food Allergy
Kanagaratham, C., Ansari, Y. S. E., Lewis, O. L., & Oettgen, H. C. (2020) · Frontiers in Immunology · doi:10.3389/fimmu.2020.603050 · Cited by 214
Mechanisms of allergen-specific immunotherapy
Głobińska, A., Boonpiyathad, T., Satitsuksanoa, P., Kleuskens, M. T. A., van de Veen, W., Sokołowska, M., & Akdiş, M. (2018) · Annals of Allergy Asthma & Immunology · doi:10.1016/j.anai.2018.06.026 · Cited by 133
Allergen Extracts for In Vivo Diagnosis and Treatment of Allergy: Is There a Future?
Valenta, R., Karaulov, A., Niederberger, V., Zhernov, Y., Elisyutina, O., Campana, R., Focke-Tejkl, M., Curin, M., Namazova-Baranova, L., Wang, J.-Y., et al. (2018) · Journal of Allergy and Clinical Immunology: In Practice · doi:10.1016/j.jaip.2018.08.032 · Cited by 115
Past, present, and future of allergen immunotherapy vaccines
Dorofeeva, Y., Shilovskiy, I. P., Tulaeva, I., Focke‐Tejkl, M., Flicker, S., Kudlay, D. A., Khaitov, M. R., Васильевна, К. А., Riabova, K. A., Karaulov, A. V., et al. (2020) · Allergy · doi:10.1111/all.14300 · Cited by 129
A broadly protective antibody that targets the flavivirus NS1 protein
Modhiran, N., Song, H., Liu, L., Bletchly, C., Brillault, L., Amarilla, A. A., Xu, X., Qi, J., Chai, Y., Cheung, S. T. M., et al. (2021) · Science · doi:10.1126/science.abb9425 · Cited by 126
Guideline on allergen immunotherapy in IgE-mediated allergic diseases
Pfaar, O., Ankermann, T., Augustin, M., Bubel, P., Böing, S., Brehler, R., Eng, P. A., Fischer, P. J., Gerstlauer, M., Hamelmann, E. H., et al. (2022) · Allergologie select · doi:10.5414/alx02331e · Cited by 124
IgE Antibodies: From Structure to Function and Clinical Translation
Sutton, B. J., Davies, A. M., Bax, H. J., & Karagiannis, S. N. (2019) · Antibodies · doi:10.3390/antib8010019 · Cited by 121
Allergen Immunotherapy: Current and Future Trends
Pavón-Romero, G. F., Parra-Vargas, M. I., Jiménez, F. R., Melgoza-Ruiz, E., Serrano-Pérez, N. H., & Teran, L. M. (2022) · Cells · doi:10.3390/cells11020212 · Cited by 133
Recent developments and highlights in food allergy
Eiwegger, T., Hung, L., Diego, K. E. S., O’Mahony, L., & Upton, J. E. M. (2019) · Allergy · doi:10.1111/all.14082 · Cited by 111
Asrat, S., Kaur, N., Liu, X., Ben, L., Kajimura, D., Murphy, A. J., Sleeman, M. A., Limnander, A., & Orengo, J. M. (2020) · Science Immunology · doi:10.1126/sciimmunol.aav8402 · Cited by 112
Self-citationStorni, F., Zeltiņš, A., Baļķe, I., Heath, M. D., Kramer, M. F., Skinner, M. A., Zha, L., Roesti, E. S., Engeroff, P., Muri, L., et al. (2019) · Journal of Allergy and Clinical Immunology · doi:10.1016/j.jaci.2019.12.007 · Cited by 107
Rodríguez-Domínguez, A., Berings, M., Rohrbach, A., Huang, H., Curin, M., Gevaert, P., Matricardi, P. M., Valenta, R., & Vrtala, S. (2020) · Journal of Allergy and Clinical Immunology · doi:10.1016/j.jaci.2020.03.029 · Cited by 86
One hundred and ten years of Allergen Immunotherapy: A journey from empiric observation to evidence
Pfaar, O., Bousquet, J., Durham, S. R., Kleine‐Tebbe, J., Larché, M., Roberts, G. C., Shamji, M. H., & van Wijk, R. G. (2021) · Allergy · doi:10.1111/all.15023 · Cited by 86
FcεRI: A Master Regulator of Mast Cell Functions
Nagata, Y., & Suzuki, R. (2022) · Cells · doi:10.3390/cells11040622 · Cited by 81
Gevaert, P., Craemer, J. D., Ruyck, N. D., Rottey, S., Hoon, J. N. J. M. D., Hellings, P. W., Volckaert, B., Lesneuck, K., Orengo, J. M., Atanasio, A., et al. (2021) · Journal of Allergy and Clinical Immunology · doi:10.1016/j.jaci.2021.05.039 · Cited by 79
Self-citationSatyaraj, E., Wedner, H. J., & Bousquet, J. (2019) · Allergy · doi:10.1111/all.14013 · Cited by 78
Recombinant allergens for immunotherapy: state of the art
Zhernov, Y. V., Curin, M., Khaitov, M. R., Karaulov, A. V., & Valenta, R. (2019) · Current Opinion in Allergy and Clinical Immunology · doi:10.1097/aci.0000000000000536 · Cited by 81
Allergen immunotherapy for long-term tolerance and prevention
Penagos, M., & Durham, S. R. (2022) · Journal of Allergy and Clinical Immunology · doi:10.1016/j.jaci.2022.01.007 · Cited by 81
Mechanisms of human drug-induced anaphylaxis
Bruhns, P., & Chollet‐Martin, S. (2021) · Journal of Allergy and Clinical Immunology · doi:10.1016/j.jaci.2021.02.013 · Cited by 84
Shamji, M. H., Singh, I., Layhadi, J. A., Ito, C., Karamani, A., Kouser, L., Sharif, H., Tang, J., Handijiev, S., Parkin, R. V., et al. (2021) · American Journal of Respiratory and Critical Care Medicine · doi:10.1164/rccm.202011-4107oc · Cited by 74
Self-citationHot topics in allergen immunotherapy, 2023: Current status and future perspective
Zemelka‐Wiącek, M., Agache, I. O., Akdiş, C. A., Akdiş, M., Casale, T. B., Dramburg, S., Jahnz‐Różyk, K., Kosowska, A., Matricardi, P. M., Pfaar, O., et al. (2023) · Allergy · doi:10.1111/all.15945 · Cited by 73
New approaches to allergen immunotherapy
Gunawardana, N. C., & Durham, S. R. (2018) · Annals of Allergy Asthma & Immunology · doi:10.1016/j.anai.2018.07.014 · Cited by 72
New Mechanistic Advances in FcεRI-Mast Cell–Mediated Allergic Signaling
Li, Y., Leung, P. S. C., Gershwin, M. E., & Song, J. (2022) · Clinical Reviews in Allergy & Immunology · doi:10.1007/s12016-022-08955-9 · Cited by 72
Next-Generation of Allergen-Specific Immunotherapies: Molecular Approaches
Curin, M., Khaitov, M. R., Karaulov, A. V., Namazova-Baranova, L. S., Campana, R., Garib, V., & Valenta, R. (2018) · Current Allergy and Asthma Reports · doi:10.1007/s11882-018-0790-x · Cited by 68
Allergen-Specific Antibodies Regulate Secondary Allergen-Specific Immune Responses
Eckl‐Dorna, J., Villazala‐Merino, S., Linhart, B., Karaulov, A. V., Zhernov, Y. V., Khaitov, M. R., Niederberger‐Leppin, V., & Valenta, R. (2019) · Frontiers in Immunology · doi:10.3389/fimmu.2018.03131 · Cited by 66
Molecular Approaches for Diagnosis, Therapy and Prevention of Cow’s Milk Allergy
Linhart, B., Freidl, R., Elisyutina, O. G., Khaitov, M. R., Karaulov, A. V., & Valenta, R. (2019) · Nutrients · doi:10.3390/nu11071492 · Cited by 64
The use of biologics for immune modulation in allergic disease
van de Veen, W., & Akdiş, M. (2019) · Journal of Clinical Investigation · doi:10.1172/jci124607 · Cited by 63
Atanasio, A., Franklin, M. C., Kamat, V., Hernandez, A. R., Badithe, A., Ben, L., Jones, J. L., Bautista, J., Yancopoulos, G. D., Olson, W. C., et al. (2021) · Journal of Allergy and Clinical Immunology · doi:10.1016/j.jaci.2021.05.038 · Cited by 58
Self-citationThe role of IgG1 and IgG4 as dominant IgE-blocking antibodies shifts during allergen immunotherapy
Strobl, M. R., Demir, H., Acosta, G. S., Drescher, A., Kitzmüller, C., Möbs, C., Pfützner, W., & Bohle, B. (2023) · Journal of Allergy and Clinical Immunology · doi:10.1016/j.jaci.2023.01.005 · Cited by 57
LaHood, N. A., Min, J., Keswani, T., Richardson, C. M., Amoako, K., Zhou, J., Marini‐Rapoport, O., Bernard, H., Hazebrouck, S., Shreffler, W. G., et al. (2023) · Journal of Clinical Investigation · doi:10.1172/jci164501 · Cited by 54
Tolerance mechanisms in allergen immunotherapy
Sözener, Z. Ç., Mungan, D., Cevhertas, L., Öğülür, İ., Akdiş, M., & Akdiş, C. A. (2020) · Current Opinion in Allergy and Clinical Immunology · doi:10.1097/aci.0000000000000693 · Cited by 52
Montamat, G., Leonard, C., Poli, A., Klimek, L., & Ollert, M. W. (2021) · Frontiers in Immunology · doi:10.3389/fimmu.2021.590054 · Cited by 50
Mechanisms of allergen-specific immunotherapy for allergic rhinitis and food allergies
Lam, H. Y., Tergaonkar, V., & Ahn, K. S. (2020) · Bioscience Reports · doi:10.1042/bsr20200256 · Cited by 49
Structural Aspects of the Allergen-Antibody Interaction
Pomés, A., Mueller, G., & Chruszcz, M. (2020) · Frontiers in Immunology · doi:10.3389/fimmu.2020.02067 · Cited by 40
Frederic de, B. L. A. Y., Gherasim, A., Domis, N., Meier, P., Shawki, F., Wang, C. Q. F., Orengo, J. M., DeVeaux, M., Ramesh, D., Jalbert, J. J., et al. (2022) · Journal of Allergy and Clinical Immunology · doi:10.1016/j.jaci.2022.06.025 · Cited by 43
Self-citationPathogenesis of IgE‐mediated food allergy and implications for future immunotherapeutics
Ramsey, N., & Berin, M. C. (2021) · Pediatric Allergy and Immunology · doi:10.1111/pai.13501 · Cited by 45
The origins of allergy from a systems approach
Krempski, J. W., Dant, C. C., & Nadeau, K. C. (2020) · Annals of Allergy Asthma & Immunology · doi:10.1016/j.anai.2020.07.013 · Cited by 41
Preventive Allergen-Specific Vaccination Against Allergy: Mission Possible?
Tulaeva, I., Kratzer, B., Campana, R., Curin, M., van Hage, M., Васильевна, К. А., Riabova, K. A., Karaulov, A. V., Khaitov, M. R., Pickl, W. F., et al. (2020) · Frontiers in Immunology · doi:10.3389/fimmu.2020.01368 · Cited by 40
One Hundred Ten Years of Allergen Immunotherapy: A Broad Look Into the Future
Pfaar, O., Creticos, P. S., Kleine‐Tebbe, J., Canonica, G. W., Palomares, Ó., & Schülke, S. (2021) · The Journal of Allergy and Clinical Immunology In Practice · doi:10.1016/j.jaip.2020.12.067 · Cited by 40
Research advances in hydrogen–deuterium exchange mass spectrometry for protein epitope mapping
Sun, H., Ma, L., Wang, L., Xiao, P., Li, H., Zhou, M., & Song, D. (2021) · Analytical and Bioanalytical Chemistry · doi:10.1007/s00216-020-03091-9 · Cited by 38
Immunization of Cats against Fel d 1 Results in Reduced Allergic Symptoms of Owners
Thoms, F., Haas, S., Erhart, A., Nett, C. S., Rüfenacht, S., Graf, N., Strods, A., Patil, G., Leenadevi, T., Fontaine, M. C., et al. (2020) · Viruses · doi:10.3390/v12030288 · Cited by 37
Vaccination against Allergy: A Paradigm Shift?
Bachmann, M. F., Mohsen, M. O., Kramer, M. F., & Heath, M. D. (2020) · Trends in Molecular Medicine · doi:10.1016/j.molmed.2020.01.007 · Cited by 36
B cells: The many facets of B cells in allergic diseases
Satitsuksanoa, P., Iwasaki, S., Boersma, J., Imam, M. B., Schneider, S. R., Chang, I., van de Veen, W., & Akdiş, M. (2023) · Journal of Allergy and Clinical Immunology · doi:10.1016/j.jaci.2023.05.011 · Cited by 37
From Allergen Molecules to Molecular Immunotherapy of Nut Allergy: A Hard Nut to Crack
Fuhrmann, V., Huang, H., Akarsu, A., Shilovskiy, I. P., Elisyutina, O. G., Khaitov, M. R., van Hage, M., Linhart, B., Focke‐Tejkl, M., Valenta, R., et al. (2021) · Frontiers in Immunology · doi:10.3389/fimmu.2021.742732 · Cited by 35
Wipperman, M. F., Gayvert, K. M., Atanasio, A., Wang, C. Q. F., Corren, J., Covarrubias, A., Setliff, I., Chio, E., Laws, E., Wolfe, K., et al. (2024) · Allergy · doi:10.1111/all.16001 · Cited by 35
Self-citationThe next generation virus‐like particle platform for the treatment of peanut allergy
Sobczak, J. M., Krenger, P. S., Storni, F., Mohsen, M. O., Baļķe, I., Resēviča, G., Heath, M. D., Velazquez, T. L. C., Kramer, M. F., Scott, C. J. W., et al. (2023) · Allergy · doi:10.1111/all.15704 · Cited by 33
Zhang, Q., Yang, J., Bautista, J., Badithe, A., Olson, W. C., & Liu, Y. (2018) · Analytical Chemistry · doi:10.1021/acs.analchem.8b01864 · Cited by 33
Self-citationShamji, M. H., Thomsen, I., Layhadi, J. A., Kappen, J. H., Holtappels, G., Şahiner, Ü. M., Switzer, A., Durham, S. R., Pabst, O., & Bachert, C. (2019) · Journal of Allergy and Clinical Immunology · doi:10.1016/j.jaci.2019.02.001 · Cited by 32
A therapeutic strategy to target distinct sources of IgE and durably reverse allergy
Limnander, A., Kaur, N., Asrat, S., Tasker, C., Boyapati, A., Ben, L., Janczy, J. R., Pedraza, P. L., Abreu, P., Chen, W.-C., et al. (2023) · Science Translational Medicine · doi:10.1126/scitranslmed.adf9561 · Cited by 31
Self-citationEvolutionary Biology and Gene Editing of Cat Allergen, Fel d 1
Brackett, N. F., Davis, B. W., Adli, M., Pomés, A., & Chapman, M. D. (2022) · The CRISPR Journal · doi:10.1089/crispr.2021.0101 · Cited by 31
Engineering therapeutic monoclonal antibodies
Stone, C. A., Spiller, B. W., & Smith, S. A. (2023) · Journal of Allergy and Clinical Immunology · doi:10.1016/j.jaci.2023.11.018 · Cited by 31
Storni, F., Cabral‐Miranda, G., Roesti, E. S., Zha, L., Engeroff, P., Zeltiņš, A., Cragg, M. S., Vogel, M., & Bachmann, M. F. (2020) · International Archives of Allergy and Immunology · doi:10.1159/000505917 · Cited by 29
Paolucci, M., Wuillemin, N., Homère, V., Bieli, D., Köhli, A., Ballmer-Weber, B. K., Waeckerle‐Men, Y., Pengo, N., Kündig, T. M., Sonati, T., et al. (2023) · Allergy · doi:10.1111/all.15659 · Cited by 29
Targeting the FcεRI Pathway as a Potential Strategy to Prevent Food-Induced Anaphylaxis
Dispenza, M. C., Bochner, B. S., & MacGlashan, D. W. (2020) · Frontiers in Immunology · doi:10.3389/fimmu.2020.614402 · Cited by 28
The Multifaceted B Cell Response in Allergen Immunotherapy
Jiménez‐Saiz, R., & Patil, S. U. (2018) · Current Allergy and Asthma Reports · doi:10.1007/s11882-018-0819-1 · Cited by 28
Freidl, R., Gstöttner, A., Baranyi, U., Swoboda, I., Stolz, F., Focke‐Tejkl, M., Wekerle, T., van Ree, R., Valenta, R., & Linhart, B. (2019) · Allergy · doi:10.1111/all.13994 · Cited by 28
Villazala‐Merino, S., Rodríguez-Domínguez, A., Stanek, V., Campion, N. J., Gattinger, P., Höfer, G., Fröschl, R., Faé, I., Lupinek, C., Vrtala, S., et al. (2019) · Journal of Allergy and Clinical Immunology · doi:10.1016/j.jaci.2019.11.019 · Cited by 27
Mapping Human Monoclonal IgE Epitopes on the Major Dust Mite Allergen Der p 2
Mueller, G. A., Glesner, J., Daniel, J., Zhang, J., Hyduke, N., Richardson, C. M., DeRose, E. F., Chapman, M. D., Peebles, R. S., Smith, S. A., et al. (2020) · The Journal of Immunology · doi:10.4049/jimmunol.2000295 · Cited by 27
Glesner, J., Kapingidza, A. B., Godzwon, M., Offermann, L. R., Mueller, G. A., DeRose, E. F., Wright, P., Richardson, C. M., Woodfolk, J. A., Vailes, L. D., et al. (2019) · The Journal of Immunology · doi:10.4049/jimmunol.1900580 · Cited by 26
On the role of allergen-specific IgG subclasses for blocking human basophil activation
Zinkhan, S., Thoms, F., Augusto, G. S., Vogel, M., & Bachmann, M. F. (2022) · Frontiers in Immunology · doi:10.3389/fimmu.2022.892631 · Cited by 26
Mechanisms and biomarkers of successful allergen-specific immunotherapy
López, J.-F., Imam, M. B., Satitsuksanoa, P., Lems, S., Yang, M., Hwang, Y.-K., Losol, P., Choi, J., Kim, S., Chang, Y., et al. (2022) · Asia Pacific Allergy · doi:10.5415/apallergy.2022.12.e45 · Cited by 26
Highlights of Novel Vaccination Strategies in Allergen Immunotherapy
Komlósi, Z. I., Kovács, N., Sokołowska, M., van de Veen, W., Akdiş, M., & Akdiş, C. A. (2019) · Immunology and Allergy Clinics of North America · doi:10.1016/j.iac.2019.09.010 · Cited by 26
Molecular approaches to allergen‐specific immunotherapy: Are we so far from clinical implementation?
Pechsrichuang, P., & Jacquet, A. (2020) · Clinical & Experimental Allergy · doi:10.1111/cea.13588 · Cited by 25
Targeting Mast Cells with Biologics
Lyons, J. J., & Metcalfe, D. D. (2020) · Immunology and Allergy Clinics of North America · doi:10.1016/j.iac.2020.06.007 · Cited by 27
Yang, Y., Yan, H., Zhang, Y., Chen, H., Cao, M., Li, M., Zhang, M.-L., He, X., & Liu, G. (2020) · Food Chemistry · doi:10.1016/j.foodchem.2020.126422 · Cited by 23
Leonard, C. A., Montamat, G., Davril, C., Domingues, O., Hunewald, O. E., Revets, D., Guérin, C. L., Blank, S., Heckendorn, J., Jardon, G., et al. (2020) · Allergy · doi:10.1111/all.14716 · Cited by 23
Olivieri, B., Günaydın, F. E., Corren, J., Senna, G., & Durham, S. R. (2024) · Annals of Allergy Asthma & Immunology · doi:10.1016/j.anai.2024.06.016 · Cited by 22
Human allergy to cats: A review for veterinarians on prevalence, causes, symptoms and control
Sparkes, A. (2021) · Journal of Feline Medicine and Surgery · doi:10.1177/1098612x211036793 · Cited by 27
Allergenic Activity of Individual Cat Allergen Molecules
Trifonova, D., Curin, M., Riabova, K. A., Васильевна, К. А., Keller, W., Grönlund, H., Käck, U., Konradsen, J. R., van Hage, M., Karaulov, A. V., et al. (2023) · International Journal of Molecular Sciences · doi:10.3390/ijms242316729 · Cited by 24
Novel vaccines for allergen-specific immunotherapy
Akinfenwa, O., Rodríguez-Domínguez, A., Vrtala, S., Valenta, R., & Campana, R. (2020) · Current Opinion in Allergy and Clinical Immunology · doi:10.1097/aci.0000000000000706 · Cited by 22
Chang, X., Zha, L., Wallimann, A., Mohsen, M. O., Krenger, P. S., Liu, X., Vogel, M., & Bachmann, M. F. (2021) · Allergy · doi:10.1111/all.14864 · Cited by 22
Riabova, K., Karsonova, A. V., van Hage, M., Käck, U., Konradsen, J. R., Grönlund, H., Fomina, D., Beltyukov, E., Glazkova, P. A., Semenov, D. Y., et al. (2022) · International Journal of Molecular Sciences · doi:10.3390/ijms23136984 · Cited by 21
Allergenicity and Conformational Diversity of Allergens
Seidler, C. A., Zeindl, R., Fernández‐Quintero, M. L., Tollinger, M., & Liedl, K. R. (2024) · Allergies · doi:10.3390/allergies4010001 · Cited by 21
Allergen‐specific IgG show distinct patterns in persistent and transient food allergy
McKendry, R., Kwok, M., Hemmings, O., James, L. K., & Santos, A. F. (2021) · Pediatric Allergy and Immunology · doi:10.1111/pai.13567 · Cited by 21
Precision engineering for localization, validation, and modification of allergenic epitopes
Pomés, A., Smith, S. A., Chruszcz, M., Mueller, G. A., Brackett, N. F., & Chapman, M. D. (2024) · Journal of Allergy and Clinical Immunology · doi:10.1016/j.jaci.2023.12.017 · Cited by 23
Novel vaccines: Technology and development
Patil, S. U., & Shreffler, W. G. (2018) · Journal of Allergy and Clinical Immunology · doi:10.1016/j.jaci.2018.05.021 · Cited by 21
Nanobodies—Useful Tools for Allergy Treatment?
Flicker, S., Zettl, I., & Tillib, S. V. (2020) · Frontiers in Immunology · doi:10.3389/fimmu.2020.576255 · Cited by 21
Kamal, M. A., Dingman, R. K., Wang, C. Q. F., Lai, C., Rajadhyaksha, M., DeVeaux, M., Orengo, J. M., Radin, A. R., & Davis, J. D. (2021) · Clinical and Translational Science · doi:10.1111/cts.13112 · Cited by 20
Self-citationB cells and the microbiota: a missing connection in food allergy
Campbell, E., Hesser, L. A., & Nagler‐Anderson, C. (2020) · Mucosal Immunology · doi:10.1038/s41385-020-00350-x · Cited by 20
Knol, E. F., & van Neerven, R. J. J. (2024) · Immunological Reviews · doi:10.1111/imr.13386 · Cited by 19
Biologics as novel therapeutics for the treatment of allergy: Challenges and opportunities
Atanasio, A., Orengo, J. M., Sleeman, M. A., & Stahl, N. (2022) · Frontiers in Allergy · doi:10.3389/falgy.2022.1019255 · Cited by 21
Self-citationEllis, A. K., Frankish, C. W., Armstrong, K., Steacy, L. M., Tenn, M. W., Pawsey, S., & Hafner, R. P. (2019) · Journal of Allergy and Clinical Immunology · doi:10.1016/j.jaci.2019.09.010 · Cited by 18
Mitsias, D. I., Xepapadaki, P. V., Makris, M. P., & Papadopoulos, N. G. (2020) · Current Opinion in Immunology · doi:10.1016/j.coi.2020.02.005 · Cited by 18
Self-citationRole of IgG4 Antibodies in Human Health and Disease
Shi, L., Xiong, P., Yang, M., Ardıçlı, Ö., Schneider, S. R., Funch, A. B., Kıykım, A. A., López, J.-F., Akdiş, C. A., & Akdiş, M. (2025) · Cells · doi:10.3390/cells14090639 · Cited by 21
The Role of Atopy in COPD and Asthma
Karakioulaki, M., Papakonstantinou, E., Goulas, A., & Stolz, D. (2021) · Frontiers in Medicine · doi:10.3389/fmed.2021.674742 · Cited by 18
Research Advances in Mast Cell Biology and Their Translation Into Novel Therapies for Anaphylaxis
Dispenza, M. C., Metcalfe, D. D., & Olivera, A. (2023) · The Journal of Allergy and Clinical Immunology In Practice · doi:10.1016/j.jaip.2023.03.015 · Cited by 18
Affinity matters for IgE ‐blocking activity of allergen‐specific antibodies
Strobl, M. R., Demir, H., Stadlmayr, G., Stracke, F., Hoelzl, R., Bohle, B., & Wozniak‐Knopp, G. (2023) · Allergy · doi:10.1111/all.15746 · Cited by 17
Advances and novel developments in molecular allergology
Üzülmez, Ö., Kalic, T., & Breiteneder, H. (2020) · Allergy · doi:10.1111/all.14579 · Cited by 17
IgE in the Pathogenesis of SLE: From Pathogenic Role to Therapeutic Target
Lamri, Y., & Charles, N. (2020) · Antibodies · doi:10.3390/antib9040069 · Cited by 17
Versatile Application of Nanobodies for Food Allergen Detection and Allergy Immunotherapy
Hu, Y., Wang, Y., Lin, J., Wu, S., Muyldermans, S., & Wang, S. (2022) · Journal of Agricultural and Food Chemistry · doi:10.1021/acs.jafc.2c03324 · Cited by 17
On the role of antibody affinity and avidity in the IgE ‐mediated allergic response
Bachmann, M. F., Krenger, P. S., Mohsen, M. O., Kramer, M. F., Starchenka, S., Whitehead, P., Vogel, M., & Heath, M. D. (2024) · Allergy · doi:10.1111/all.16248 · Cited by 16
Arif‐Lusson, R., Agabriel, C., Carsin, A., Cabon-Boudard, I., Sénéchal, H., Poncet, P., Vitte, J., & Busnel, J. (2020) · Journal of Immunological Methods · doi:10.1016/j.jim.2020.112793 · Cited by 16
Review: The Nose as a Route for Therapy. Part 2 Immunotherapy
Padayachee, Y., Flicker, S., Linton, S., Cafferkey, J., Kon, O. M., Johnston, S. L., Ellis, A. K., Desrosiers, M. Y., Turner, P., Valenta, R., et al. (2021) · Frontiers in Allergy · doi:10.3389/falgy.2021.668781 · Cited by 18
Isolation of nanobodies with potential to reduce patients' IgE binding to Bet v 1
Zettl, I., Ivanova, T. I., Strobl, M. R., Weichwald, C., Goryainova, O. S., Khan, E., Rutovskaya, M. V., Focke‐Tejkl, M., Drescher, A., Bohle, B., et al. (2021) · Allergy · doi:10.1111/all.15191 · Cited by 16
Recombinant PreS‐fusion protein vaccine for birch pollen and apple allergy
Khaitov, M. R., Shilovskiy, I. P., Valenta, R., Weber, M., Викторович, К. А., Tulaeva, I., Gattinger, P., van Hage, M., Höfer, G., Konradsen, J. R., et al. (2023) · Allergy · doi:10.1111/all.15919 · Cited by 15
Bioengineering of Virus-like Particles for the Prevention or Treatment of Allergic Diseases
Pechsrichuang, P., Namwongnao, S., & Jacquet, A. (2020) · Allergy Asthma and Immunology Research · doi:10.4168/aair.2021.13.1.23 · Cited by 15
Metadata
- Authors
- Orengo, J. M., Radin, A. R., Kamat, V., Badithe, A., Ben, L. H., Bennett, B. L., Zhong, S., Birchard, D., Limnander, A., Rafique, A., Bautista, J., Kostic, A., Newell, D., Duan, X., Franklin, M. C., Olson, W., Huang, T., Gandhi, N. A., Lipsich, L., Stahl, N., Papadopoulos, N. J., Murphy, A. J., & Yancopoulos, G. D.
- Affiliations
- Regeneron (United States) (US)
- Corresponding author
- Orengo, J. M.
- ORCID
- Venue
- Nature Communications
- Published
- 2018-04-12
- Volume
- 9
- Issue
- 1
- Pages
- 1421-1421
- ISSN
- 2041-1723 (ISSN-L)
- PMC
- PMC5897525
- OpenAlex
- W2797705783
- Cited by
- 237
- References
- 68
- Citations by year
- 2026: 17 · 2025: 22 · 2024: 32 · 2023: 36 · 2022: 24 · 2021: 35 · 2020: 37 · 2019: 24 · 2018: 10
- FWCI
- 23.52
- Type
- journal article
- Language
- en
- Open access
- gold
- doi.org
- Locations
- Nature Communications (publishedVersion, cc-by)
- Europe PMC (PubMed Central) (publishedVersion, other-oa)
- PubMed Central (publishedVersion, cc-by)
- PubMed (publishedVersion)
- RePEc: Research Papers in Economics (submittedVersion)
- DOAJ (DOAJ: Directory of Open Access Journals) (submittedVersion, cc-by-sa)
- DOAJ (DOAJ: Directory of Open Access Journals) (submittedVersion)
- OSTI OAI (U.S. Department of Energy Office of Scientific and Technical Information) (submittedVersion)
- Funders
- Howard Hughes Medical Institute (DE-AC02-05CH11231)
- U.S. Department of Energy (-AC02-05CH11231, Contract No. DE-AC02-05-CH11231, 05CH11231, No. DE-AC02-05-CH11231, DE AC02 05CH11231, DE-AC02-)
- Regeneron Pharmaceuticals
- National Institutes of Health (DE-AC02–05CH11231)
- Office of Science (No. DE-AC02- 05-CH11231, DEAC02–05CH11231, AC02-05CH11231, DE-AC02, Contract No. DE-AC02-05CH11231)
- National Institute of General Medical Sciences (DE-AC02-05CH11231)
- Topics
- Health Sciences › Medicine › Immunology and Allergy › Allergic Rhinitis and Sensitization
- Health Sciences › Medicine › Immunology and Allergy › Food Allergy and Anaphylaxis Research
- Health Sciences › Medicine › Pulmonary and Respiratory Medicine › Asthma and respiratory diseases
- Keywords
- cat allergy, Fel d 1, allergen-specific IgG, monoclonal antibodies, allergen immunotherapy, allergen sensitization, nasal provocation, allergic airway inflammation
- MeSH terms
- Animal Fur, Adolescent, Adult, Allergens, Animals, Antibodies, Monoclonal, Binding, Competitive, Cats, Desensitization, Immunologic, Disease Models, Animal, Female, Glycoproteins, Humans, Hypersensitivity, Immunoglobulin E, Immunoglobulin G, Male, Middle Aged, Protein Binding, Receptors, IgE, Complex Mixtures, Mice
About these checks
Registry, retraction, Cites and statistics results are computed, not judged, with one exception: a printed reference that no index lists is read once by a model before it counts as a citation error. Claims are extracted by a model and kept only when their quote appears verbatim in the text; each cited source is then checked, with a model’s help, for whether it says what the claim relies on. Those verdicts can be wrong — read the claim’s quote and the cited source before relying on one.
Statistics and arithmetic are recomputed, not judged.
Confidence bands are shown only for fields calibrated on our annotated test set. None is calibrated yet, so no band is shown.
What counts as a claim ›How we measure confidence ›How we check this ›
Are you an author, or do you see a problem with this page? Request a review
