

The DOI matches its Crossref record; 6 of the 6 references it cites were found in a registry or an index.
Synergistic and low adverse effect cancer immunotherapy by immunogenic chemotherapy and locally expressed PD-L1 trap
Abstract
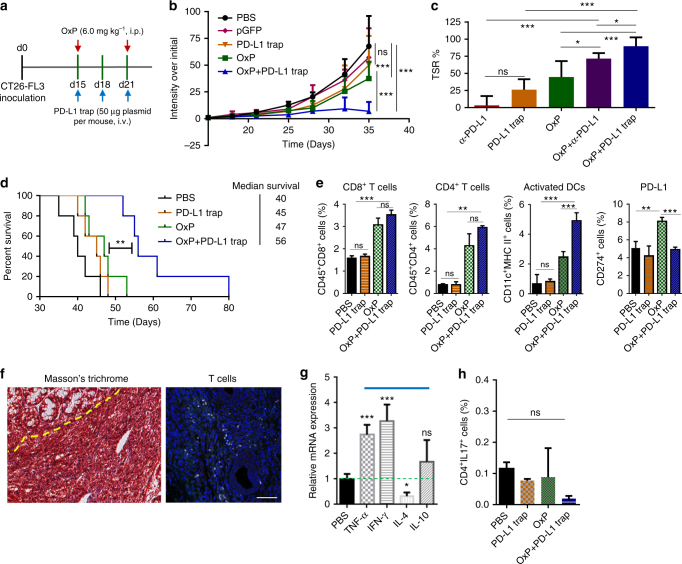
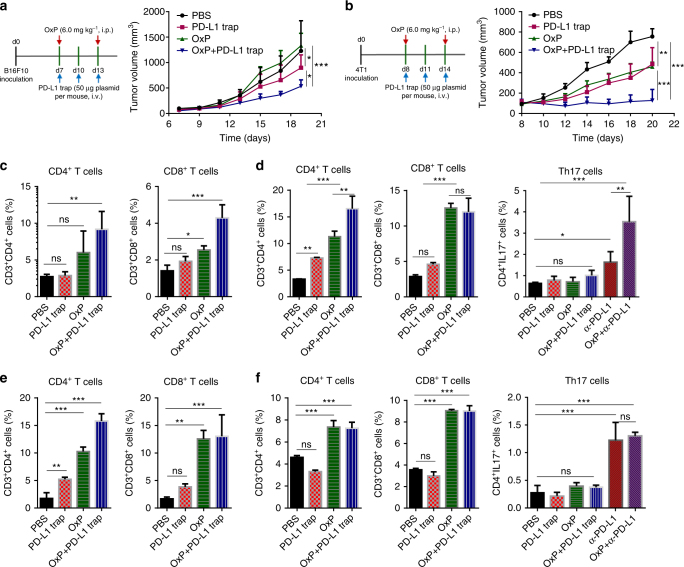
Although great success has been obtained in the clinic, the current immune checkpoint inhibitors still face two challenging problems: low response rate and immune-related adverse effects (irAEs). Here we report the combination of immunogenic chemotherapy and locally expressed PD-L1 trap fusion protein for efficacious and safe cancer immunotherapy. We demonstrate that oxaliplatin (OxP) boosts anti-PD-L1 mAb therapy against murine colorectal cancer. By design of a PD-L1 trap and loading its coding plasmid DNA into a lipid-protamine-DNA nanoparticle, PD-L1 trap is produced transiently and locally in the tumor microenvironment, and synergizes with OxP for tumor inhibition. Significantly, unlike the combination of OxP and anti-PD-L1 mAb, the combination of OxP and PD-L1 trap does not induce obvious Th17 cells accumulation in the spleen, indicating better tolerance and lower tendency to irAEs. The reports here may highlight the potential of applying PD-L1 inhibitor, especially locally expressed PD-L1 trap, in cancer therapy following OxP-based chemotherapy.
Overview
The claims and statistics of this paper haven’t been checked yet.
Run the check — free, no account needed. It reads the open-access text and checks the sources it cites.
Integrity signals
Registry
Cites
Statistics
Figures
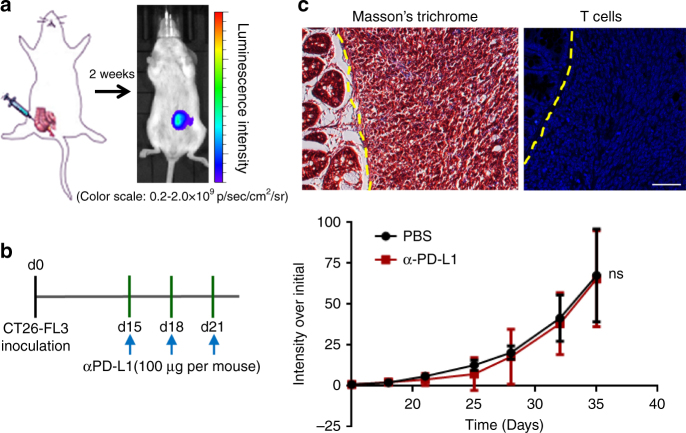
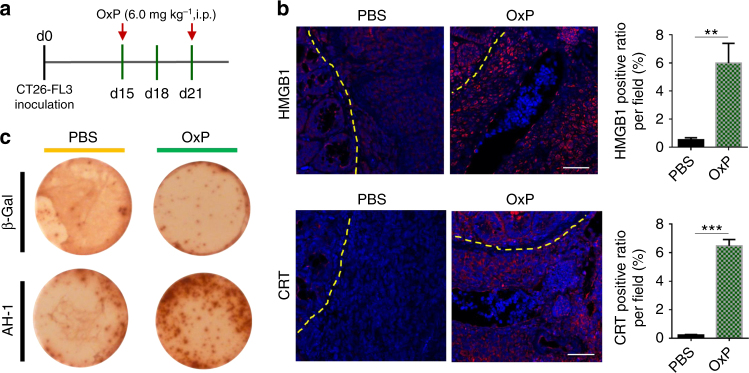
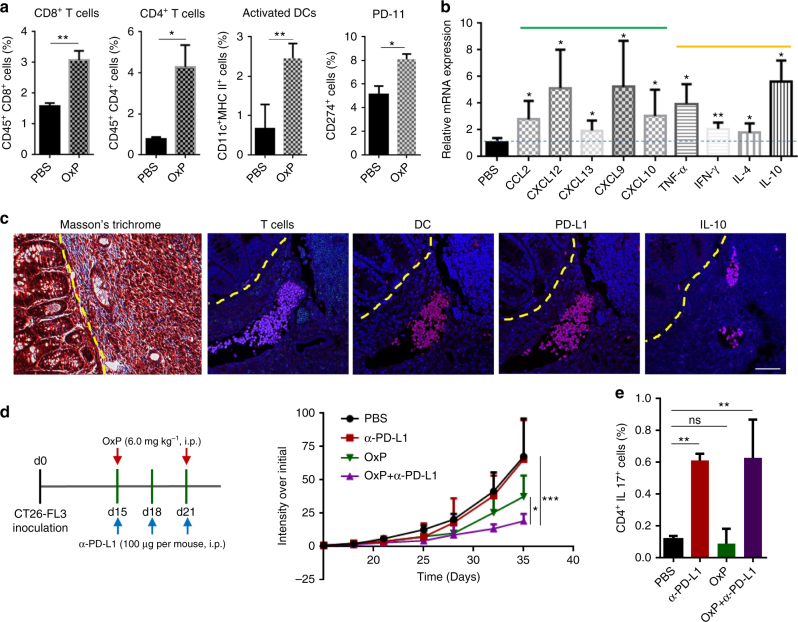
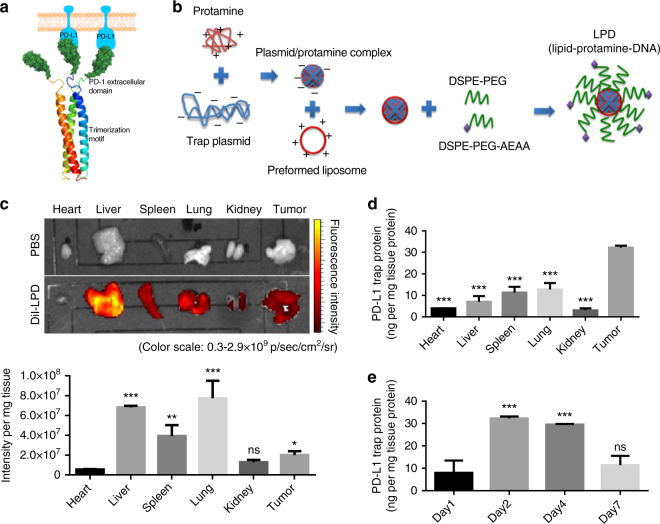
Verification
Claims the paper makes
The claims and statistics of this paper haven’t been checked yet.
Run the check — free, no account needed. It reads the open-access text and checks the sources it cites.
Claims other papers make about this one
Each is checked against this paper’s own text: does it say what the citing paper says it does?
In the citing paper
“assistant therapeutic tools that can elicit immune responses combined with chemotherapy exhibit promising results in treating CRC in preclinical studies3,4.”
From Combining gut microbiota modulation and chemotherapy by capecitabine-loaded prebiotic nanoparticle improves colorectal cancer therapy (2023) · cites this paper as [4]
Self-check
Percentages, sums and reported differences re-computed from the paper’s own numbers.
The self-check needs the paper’s full text.
Citations
Cites
PD-1 Blockade in Tumors with Mismatch-Repair Deficiency
Le, D. T., Uram, J. N., Wang, H., Bartlett, B. R., Kemberling, H., Eyring, A. D., Skora, A. D., Luber, B. S., Azad, N. S., Laheru, D., et al. (2015) · New England Journal of Medicine · doi:10.1056/nejmoa1500596 · Cited by 9,377
Pembrolizumab versus Ipilimumab in Advanced Melanoma
Robert, C., Schachter, J., Long, G. V., Arance, A., Grob, J. J., Mortier, L., Daud, A., Carlino, M. S., McNeil, C., Lotem, M., et al. (2015) · New England Journal of Medicine · doi:10.1056/nejmoa1503093 · Cited by 5,887
Immune-Related Adverse Events Associated with Immune Checkpoint Blockade
Postow, M. A., Sidlow, R., & Hellmann, M. D. (2018) · New England Journal of Medicine · doi:10.1056/nejmra1703481 · Cited by 4,849
Predicting immunogenic tumour mutations by combining mass spectrometry and exome sequencing
Yadav, M., Jhunjhunwala, S., Phung, Q. T., Lupardus, P., Tanguay, J., Bumbaca, S., Franci, C., Cheung, T. K., Fritsche, J., Weinschenk, T., et al. (2014) · Nature · doi:10.1038/nature14001 · Cited by 1,186
Ebert, P. J. R., Cheung, J., Yang, Y., McNamara, E., Hong, R., Moskalenko, M., Gould, S. E., Maecker, H., Irving, B. A., Kim, J. M., et al. (2016) · Immunity · doi:10.1016/j.immuni.2016.01.024 · Cited by 713
Immunosuppressive plasma cells impede T-cell-dependent immunogenic chemotherapy
Shalapour, S., Font-Burgada, J., Di Caro, G., Zhong, Z., Sanchez-Lopez, E., Dhar, D., Willimsky, G., Ammirante, M., Strasner, A., Hansel, D. E., et al. (2015) · Nature · doi:10.1038/nature14395 · Cited by 611
Research works printed but not linked: 44
- Yarchoan, M., Johnson, B. A. 3rd, Lutz, E. R., Laheru, D. A. & Jaffee, E. M. Targeting neoantigens to augment antitumour immunity. Nat. Rev. Cancer 17, 209–222 (2017). · DOI · Paper page
- Kroemer, G., Galluzzi, L., Kepp, O. & Zitvogel, L. Immunogenic cell death in cancer therapy. Annu. Rev. Immunol. 31, 51–72 (2013). · DOI · Paper page
- Galluzzi, L., Buque, A., Kepp, O., Zitvogel, L. & Kroemer, G. Immunogenic cell death in cancer and infectious disease. Nat. Rev. Immunol. 17, 97–111 (2017). · DOI · Paper page
- Griswold, D. P. & Corbett, T. H. A colon tumor model for anticancer agent evaluation. Cancer 36, 2441–2444 (1975). · DOI
- Castle, J. C. et al. Immunomic, genomic and transcriptomic characterization of CT26 colorectal carcinoma. BMC Genom. 15, 190 (2014). · DOI
- Germano, G. et al. Inactivation of DNA repair triggers neoantigen generation and impairs tumour growth. Nature 552, 116 (2017). · DOI
- Zhang, Y., Davis, C., Ryan, J., Janney, C. & Pena, M. M. Development and characterization of a reliable mouse model of colorectal cancer metastasis to the liver. Clin. Exp. Metastas. 30, 903–918 (2013). · DOI
- Efremova, M. et al. Targeting immune checkpoints potentiates immunoediting and changes the dynamics of tumor evolution. Nat. Commun. 9, 32 (2018). · DOI
- Tesniere, A. et al. Immunogenic death of colon cancer cells treated with oxaliplatin. Oncogene 29, 482–491 (2010). · DOI
- Hato, S. V., Khong, A., de Vries, I. J. & Lesterhuis, W. J. Molecular pathways: the immunogenic effects of platinum-based chemotherapeutics. Clin. Cancer Res. 20, 2831–2837 (2014). · DOI
- Scrimieri, F. et al. Murine leukemia virus envelope gp70 is a shared biomarker for the high-sensitivity quantification of murine tumor burden. Oncoimmunology 2, e26889 (2013). · DOI
- Goodwin, T. J. & Huang, L. Investigation of phosphorylated adjuvants co-encapsulated with a model cancer peptide antigen for the treatment of colorectal cancer and liver metastasis. Vaccine 35, 2550–2557 (2017). · DOI
- Hu, J., Bernatchez, C., Xia, X., Xu, Z. and Hwu, P. CXCL9, CXCL10 and IFNγ favor the accumulation of infused T cells in tumors following IL-12 plus doxorubicin treatment. J. Immunol. 196, 211–212.1 (2016). · DOI
- Pitzalis, C., Jones, G. W., Bombardieri, M. & Jones, S. A. Ectopic lymphoid-like structures in infection, cancer and autoimmunity. Nat. Rev. Immunol. 14, 447–462 (2014). · DOI
- Di Caro, G. et al. Occurrence of tertiary lymphoid tissue is associated with T-cell infiltration and predicts better prognosis in early-stage colorectal cancers. Clin. Cancer Res. 20, 2147–2158 (2014). · DOI
- Finkin, S. et al. Ectopic lymphoid structures function as microniches for tumor progenitor cells in hepatocellular carcinoma. Nat. Immunol. 16, 1235–1244 (2015). · DOI · Paper page
- Zhu, S. & Qian, Y. IL-17/IL-17 receptor system in autoimmune disease: mechanisms and therapeutic potential. Clin. Sci. 122, 487–511 (2012). · DOI
- Yamada, H. Current perspectives on the role of IL-17 in autoimmune disease. J. Inflamm. Res. 3, 33–44 (2010). · DOI
- Yshii, L. M., Hohlfeld, R. & Liblau, R. S. Inflammatory CNS disease caused by immune checkpoint inhibitors: status and perspectives. Nat. Rev. Neurol. 13, 755 (2017). · DOI
- Naidoo, J. et al. Toxicities of the anti-PD-1 and anti-PD-L1 immune checkpoint antibodies. Ann. Oncol. 26, 2375–2391 (2015). · DOI
- Kim, D., Kim, S. K., Valencia, C. A. & Liu, R. Tribody: robust self-assembled trimeric targeting ligands with high stability and significantly improved target-binding strength. Biochemistry 52, 7283–7294 (2013). · DOI
- Goodwin, T. J. et al. Liver specific gene immunotherapies resolve immune suppressive ectopic lymphoid structures of liver metastases and prolong survival. Biomaterials 141, 260–271 (2017). · DOI
- Li, S. D. & Huang, L. Surface-modified LPD nanoparticles for tumor targeting. Ann. N. Y. Acad. Sci. 1082, 1–8 (2006). · DOI
- Wang, Y. et al. Systemic delivery of modified mRNA encoding herpes simplex virus 1 thymidine kinase for targeted cancer gene therapy. Mol. Ther. 21, 358–367 (2013). · DOI
- Miao, L. et al. Transient and local expression of chemokine and immune checkpoint traps to treat pancreatic cancer. ACS Nano 11, 8690–8706 (2017). · DOI
- Castle, J. C. et al. Mutated tumor alleles are expressed according to their DNA frequency. Sci. Rep. 4, 4743 (2014). · DOI
- Chen, L. et al. Rejection of metastatic 4T1 breast cancer by attenuation of Treg cells in combination with immune stimulation. Mol. Ther. 15, 2194–2202 (2007). · DOI
- Celik, C., Lewis, D. A. & Goldrosen, M. H. Demonstration of immunogenicity with the poorly immunogenic B16 melanoma. Cancer Res. 43, 3507–3510 (1983).
- Zou, W., Wolchok, J. D. & Chen, L. PD-L1 (B7-H1) and PD-1 pathway blockade for cancer therapy: mechanisms, response biomarkers, and combinations. Sci. Transl. Med. 8, 328rv324 (2016). · DOI
- Pitt Jonathan, M. et al. Resistance mechanisms to immune-checkpoint blockade in cancer: tumor-intrinsic and -extrinsic factors. Immunity 44, 1255–1269 (2016). · DOI
- Sagiv-Barfi, I. et al. Therapeutic antitumor immunity by checkpoint blockade is enhanced by ibrutinib, an inhibitor of both BTK and ITK. Proc. Natl Acad. Sci. USA 112, E966–E972 (2015). · DOI
- Korpal, M. et al. Evasion of immunosurveillance by genomic alterations of PPARgamma/RXRalpha in bladder cancer. Nat. Commun. 8, 103 (2017). · DOI
- Tang, H. et al. Facilitating T cell infiltration in tumor microenvironment overcomes resistance to PD-L1 blockade. Cancer Cell. 29, 285–296 (2016). · DOI
- Johansson-Percival, A. et al. De novo induction of intratumoral lymphoid structures and vessel normalization enhances immunotherapy in resistant tumors. Nat. Immunol. 18, 1207–1217 (2017). · DOI
- Pfirschke, C. et al. Immunogenic chemotherapy sensitizes tumors to checkpoint blockade therapy. Immunity 44, 343–354 (2016). · DOI
- Xu, J. et al. Near-infrared-triggered photodynamic therapy with multitasking upconversion nanoparticles in combination with checkpoint blockade for immunotherapy of colorectal cancer. ACS Nano 11, 4463–4474 (2017). · DOI
- He, C. et al. Core–shell nanoscale coordination polymers combine chemotherapy and photodynamic therapy to potentiate checkpoint blockade cancer immunotherapy. Nat. Commun. 7, 12499 (2016). · DOI
- Deng, L. et al. Irradiation and anti-PD-L1 treatment synergistically promote antitumor immunity in mice. J. Clin. Invest. 124, 687–695 (2014). · DOI
- Min, Y. et al. Antigen-capturing nanoparticles improve the abscopal effect and cancer immunotherapy. Nat. Nanotechnol. 12, 877–882 (2017). · DOI
- Weber, J. S. et al. Nivolumab versus chemotherapy in patients with advanced melanoma who progressed after anti-CTLA-4 treatment (CheckMate 037): a randomised, controlled, open-label, phase 3 trial. Lancet Oncol. 16, 375–384 (2015). · DOI
- Moslehi, J. J., Salem, J.-E., Sosman, J. A., Lebrun-Vignes, B. & Johnson, D. B. Increased reporting of fatal immune checkpoint inhibitor-associated myocarditis. The Lancet 391, 933 (2018). · DOI · Paper page
- Lesterhuis, W. J. et al. A pilot study on the immunogenicity of dendritic cell vaccination during adjuvant oxaliplatin/capecitabine chemotherapy in colon cancer patients. Br. J. Cancer 103, 1415–1421 (2010). · DOI
- Banerjee, R., Tyagi, P., Li, S. & Huang, L. Anisamide-targeted stealth liposomes: a potent carrier for targeting doxorubicin to human prostate cancer cells. Int. J. Cancer 112, 693–700 (2004). · DOI
- Wang, Y. et al. Intravenous delivery of siRNA targeting CD47 effectively inhibits melanoma tumor growth and lung metastasis. Mol. Ther. 21, 1919–1929 (2013). · DOI
Cited by
Sorted by citations
The evolution of commercial drug delivery technologies
Vargason, A. M., Anselmo, A. C., & Mitragotri, S. (2021) · Nature Biomedical Engineering · doi:10.1038/s41551-021-00698-w · Cited by 1,361
Metal Drugs and the Anticancer Immune Response
Englinger, B., Pirker, C., Heffeter, P., Terenzi, A., Kowol, C. R., Keppler, B. K., & Berger, W. (2019) · Chemical Reviews · doi:10.1021/acs.chemrev.8b00396 · Cited by 355
Lang, T., Zhu, R., Zhu, X., Yan, W., Li, Y., Zhai, Y., Wu, T., Huang, X., Yin, Q., & Li, Y. (2023) · Nature Communications · doi:10.1038/s41467-023-40439-y · Cited by 133
Reprogramming immunosuppressive myeloid cells facilitates immunotherapy for colorectal cancer
Lu, W., Yu, W., He, J., Liu, W., Yang, J., Lin, X., Zhang, Y., Wang, X., Jiang, W., Luo, J., et al. (2021) · EMBO Molecular Medicine · doi:10.15252/emmm.202012798 · Cited by 112
Assessing the future of solid tumor immunotherapy
Guha, P., Heatherton, K. R., O’Connell, K. P., Alexander, I. S., & Katz, S. C. (2022) · Biomedicines · doi:10.3390/biomedicines10030655 · Cited by 105
Metadata
- Authors
- Song, W., Shen, L., Wang, Y., Liu, Q., Goodwin, T. J., Li, J., Dorosheva, O., Liu, T., Liu, R., & Huang, L.
- Venue
- Nature Communications
- Published
- 2018-06-08
- Volume
- 9
- Issue
- 1
- ISSN
- 2041-1723
- PMC
- PMC5993831
- Cited by
- 375
- References
- 6
- Language
- en
About these checks
Registry, retraction, Cites and statistics results are computed, not judged, with one exception: a printed reference that no index lists is read once by a model before it counts as a citation error. Claims are extracted by a model and kept only when their quote appears verbatim in the text; each cited source is then checked, with a model’s help, for whether it says what the claim relies on. Those verdicts can be wrong — read the claim’s quote and the cited source before relying on one.
Statistics and arithmetic are recomputed, not judged.
Confidence bands are shown only for fields calibrated on our annotated test set. None is calibrated yet, so no band is shown.
What counts as a claim ›How we measure confidence ›How we check this ›
Are you an author, or do you see a problem with this page? Request a review
How to cite
Cite CoChat for the checks on this page, and the paper for its own findings.
- This page
- CoChat. (2026). Citation check: Synergistic and low adverse effect cancer immunotherapy by immunogenic chemotherapy and locally expressed PD-L1 trap. https://app.cochat.ai/papers/10.1038/s41467-018-04605-x
- The paper
- Song, W., Shen, L., Wang, Y., Liu, Q., Goodwin, T. J., Li, J., Dorosheva, O., Liu, T., Liu, R., & Huang, L. (2018). Synergistic and low adverse effect cancer immunotherapy by immunogenic chemotherapy and locally expressed PD-L1 trap. Nature Communications. https://doi.org/10.1038/s41467-018-04605-x
