Cited by 114

The DOI matches its Crossref record; 5 of the 5 references it cites were found in a registry or an index.

A TFEB nuclear export signal integrates amino acid supply and glucose availability

Li, Linxin, Friedrichsen, Hans J., Andrews, Sarah, Picaud, Sarah, Volpon, Laurent, Ngeow, Kaochin, Berridge, Georgina, Fischer, Roman, Borden, Katherine L. B., Filippakopoulos, Panagis, Goding, Colin R.·2018·Nature Communications

Abstract

How cells coordinate the response to fluctuating carbon and nitrogen availability required to maintain effective homeostasis is a key issue. Amino acid limitation that inactivates mTORC1 promotes de-phosphorylation and nuclear translocation of Transcription Factor EB (TFEB), a key transcriptional regulator of lysosome biogenesis and autophagy that is deregulated in cancer and neurodegeneration. Beyond its cytoplasmic sequestration, how TFEB phosphorylation regulates its nuclear-cytoplasmic shuttling, and whether TFEB can coordinate amino acid supply with glucose availability is poorly understood. Here we show that TFEB phosphorylation on S142 primes for GSK3β phosphorylation on S138, and that phosphorylation of both sites but not either alone activates a previously unrecognized nuclear export signal (NES). Importantly, GSK3β is inactivated by AKT in response to mTORC2 signaling triggered by glucose limitation. Remarkably therefore, the TFEB NES integrates carbon (glucose) and nitrogen (amino acid) availability by controlling TFEB flux through a nuclear import-export cycle.

Overview

The claims and statistics of this paper haven’t been checked yet.

Run the check — free, no account needed. It reads the open-access text and checks the sources it cites.

A few free checks a day · papers already verified open instantly · results are public

Integrity signals

Registry

Crossref · 10.1038/s41467-018-04849-7

Cites

5 of 5 references verified0 citation errors · 0 not checkable

Statistics

Figures

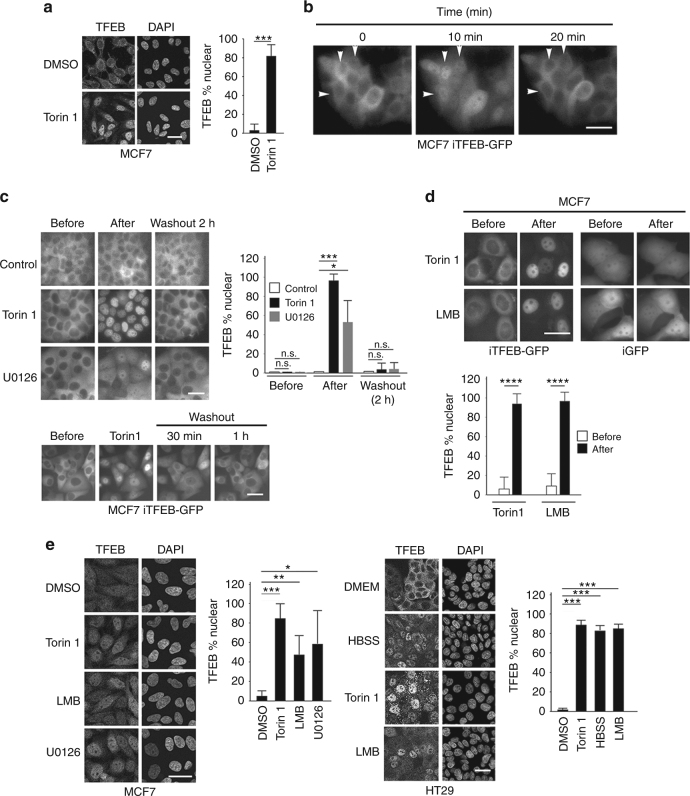
Fig. 1 TFEB is subject to nuclear export. a Immunofluorescence with indicated antibodies using control MCF7 cells or those treated with Torin 1 (250 nM, 1 h). n > 30 cells per condition. b Real time imaging of MCF7 stable cell lines expressing doxycycline-inducible TFEB-GFP (iTFEB-GFP) imaged at indicated intervals in the absence of doxycycline. Images derived from Supplementary Movie 1. c Live cell imaging of MCF7 iTFEB-GFP cells before and after 1 h Torin 1 (250 nM) or 2 h U0126 (20 μM) treatment or after removal of the drug (upper panels) as indicated, or 30′ and 1 h after removal of Torin 1 (lower panels). n > 30 cells per condition. d Imaging of MCF7 iTFEB-GFP or iGFP cells before and after LMB (2 h; 20 nM) treatment. Quantification is derived from one experiment that is representative of 2 independent experiments. n > 30 cells per condition. e Immunofluorescence using MCF7 or HT29 cells and indicated antibodies with or without treatment with Torin 1 (1 h; 250 nM), LMB (2 h; 20 nM), and U0126 (3 h; 20 μM). n > 500 cells per condition. Details of all quantifications including number of replicates and cells imaged are provided in Supplementary Table 1 and Methods. Scale bars = 20 μM. Error bars = SD. Student’s t-test; *P < 0.05, **P < 0.01, ***P < 0.001, ****P < 0.0001, n.s. not significant
Fig. 1 TFEB is subject to nuclear export. a Immunofluorescence with indicated antibodies using control MCF7 cells or those treated with Torin 1 (250 nM, 1 h). n > 30 cells per condition. b Real time imaging of MCF7 stable cell lines expressing doxycycline-inducible TFEB-GFP (iTFEB-GFP) imaged at indicated intervals in the absence of doxycycline. Images derived from Supplementary Movie 1. c Live cell imaging of MCF7 iTFEB-GFP cells before and after 1 h Torin 1 (250 nM) or 2 h U0126 (20 μM) treatment or after removal of the drug (upper panels) as indicated, or 30′ and 1 h after removal of Torin 1 (lower panels). n > 30 cells per condition. d Imaging of MCF7 iTFEB-GFP or iGFP cells before and after LMB (2 h; 20 nM) treatment. Quantification is derived from one experiment that is representative of 2 independent experiments. n > 30 cells per condition. e Immunofluorescence using MCF7 or HT29 cells and indicated antibodies with or without treatment with Torin 1 (1 h; 250 nM), LMB (2 h; 20 nM), and U0126 (3 h; 20 μM). n > 500 cells per condition. Details of all quantifications including number of replicates and cells imaged are provided in Supplementary Table 1 and Methods. Scale bars = 20 μM. Error bars = SD. Student’s t-test; *P < 0.05, **P < 0.01, ***P < 0.001, ****P < 0.0001, n.s. not significantCC BY · PubMed Central
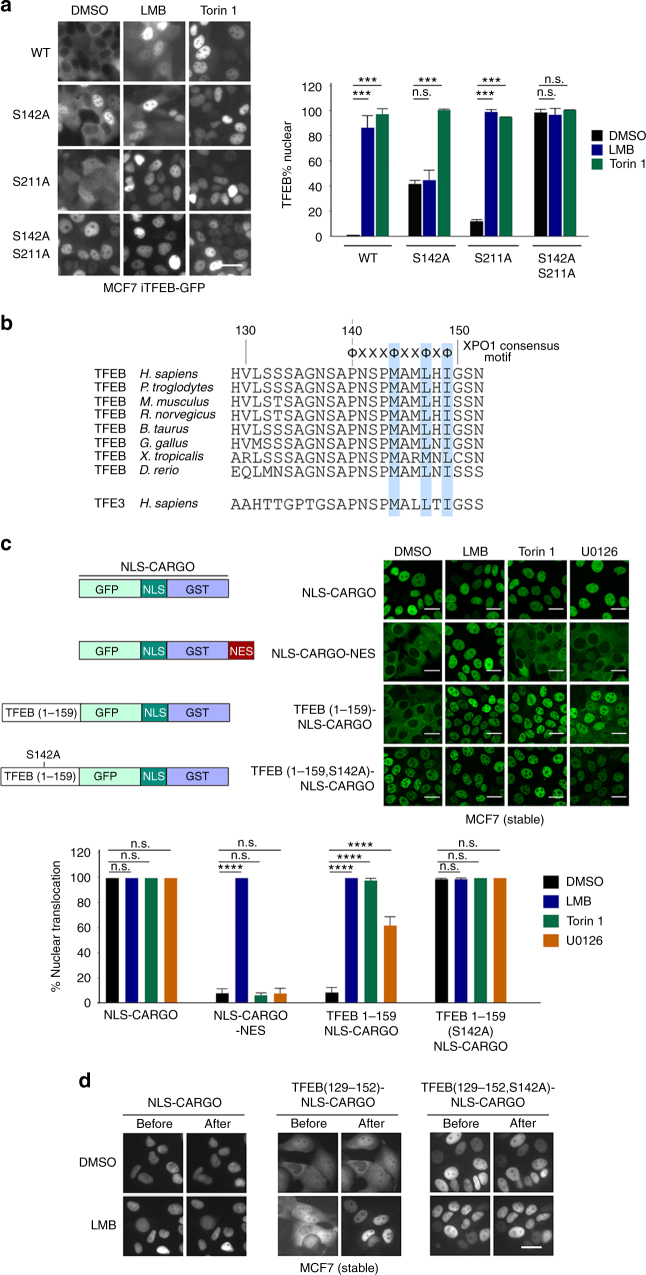
Fig. 2 Identification of a TFEB nuclear export signal. a Live cell fluorescence images of indicated WT and mutant TFEB-GFP proteins in stably expressing MCF7 cells. Cells were treated with DMSO, LMB (20 nM; 2 h) or Torin 1 (20 nM; 1 h). n > 30 cells per condition. b Alignment of TFEB amino acids 129–152 and equivalent TFE3 residues. Amino acids highlighted in blue conform to the consensus for an NES. c Live cell fluorescence imaging of MCF7 cells stable expressing indicated fusion proteins imaged before or after treatment with LMB (2 h; 20 nM), Torin 1 (1 h; 250 nM), or U0126 (3 h; 20 μM). Imaging was performed after fixation. n > 50 cells per condition. Error bars = SD. Student’s t-test; ***P < 0.001, ****P < 0.0001, n.s. not significant. d Real time fluorescence imaging of MCF7 cells stably expressing the indicated fluorescent TFEB (129–152) cargo vectors before or after treatment with LMB (20 nM; 2 h). Scale bars = 20 μM
Fig. 2 Identification of a TFEB nuclear export signal. a Live cell fluorescence images of indicated WT and mutant TFEB-GFP proteins in stably expressing MCF7 cells. Cells were treated with DMSO, LMB (20 nM; 2 h) or Torin 1 (20 nM; 1 h). n > 30 cells per condition. b Alignment of TFEB amino acids 129–152 and equivalent TFE3 residues. Amino acids highlighted in blue conform to the consensus for an NES. c Live cell fluorescence imaging of MCF7 cells stable expressing indicated fusion proteins imaged before or after treatment with LMB (2 h; 20 nM), Torin 1 (1 h; 250 nM), or U0126 (3 h; 20 μM). Imaging was performed after fixation. n > 50 cells per condition. Error bars = SD. Student’s t-test; ***P < 0.001, ****P < 0.0001, n.s. not significant. d Real time fluorescence imaging of MCF7 cells stably expressing the indicated fluorescent TFEB (129–152) cargo vectors before or after treatment with LMB (20 nM; 2 h). Scale bars = 20 μMCC BY · PubMed Central
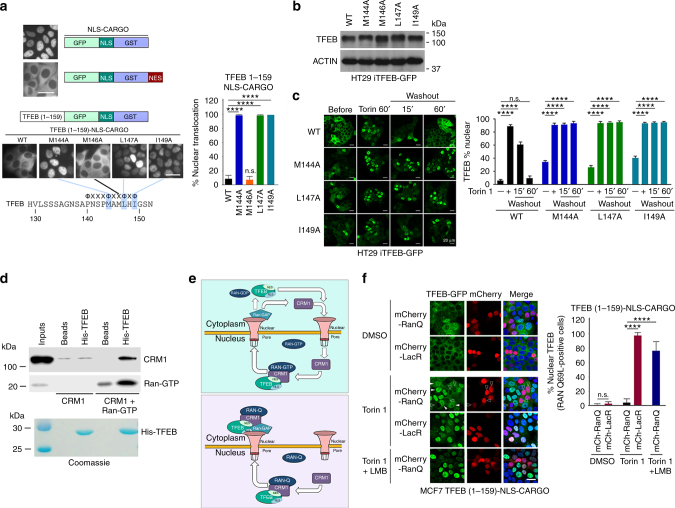
Fig. 3 TFEB is subject to CRM1-mediated nuclear export. a Live cell steady state images of indicated cargo vectors stably expressed in MCF7 cells. n > 120 cells per condition. b Western blot of HT29 cells expressing doxycycline-inducible WT or indicated mutant TFEB-GFP (−Dox). c Fluorescence images of HT29 cells stably expressing indicated WT and mutant TFEB-GFP treated with Torin 1 (25 nM) for 1 h before cells were washed and placed in Torin 1-free medium for 15 or 60 min. n > 300 cells per condition. d Western blot using indicated antibodies to detect CRM1 and RAN after pull down of immobilized HIS-tagged TFEB (aas 1–200). All proteins were bacterially expressed and purified. Purified TFEB was visualized by Coomassie staining (lower panel). e Schematic depicting the role of CRM1 and RAN in nuclear export using TFEB as a potential substrate. Top: RAN-WT; Bottom, RAN-Q69L. See text for details. f Fluorescence images of steady state subcellular localization of MCF7 cells stably expressing the TFEB 1-159-NLS-cargo together with either mCherry-LacR or mCherry RAN-Q69L. Cells were treated with DMSO, Torin 1 (250 nM) alone or with LMB (20 nM) as indicated. Subcellular localization of TFEB-GFP was quantified for cells expressing mCherry. n > 100 cells per condition. In the RanQ experiment, only mCherry positive cells were counted. Scale bars = 20 μM. Error bars = SD. Student’s t-test; ****P < 0.0001, n.s. not significant
Fig. 3 TFEB is subject to CRM1-mediated nuclear export. a Live cell steady state images of indicated cargo vectors stably expressed in MCF7 cells. n > 120 cells per condition. b Western blot of HT29 cells expressing doxycycline-inducible WT or indicated mutant TFEB-GFP (−Dox). c Fluorescence images of HT29 cells stably expressing indicated WT and mutant TFEB-GFP treated with Torin 1 (25 nM) for 1 h before cells were washed and placed in Torin 1-free medium for 15 or 60 min. n > 300 cells per condition. d Western blot using indicated antibodies to detect CRM1 and RAN after pull down of immobilized HIS-tagged TFEB (aas 1–200). All proteins were bacterially expressed and purified. Purified TFEB was visualized by Coomassie staining (lower panel). e Schematic depicting the role of CRM1 and RAN in nuclear export using TFEB as a potential substrate. Top: RAN-WT; Bottom, RAN-Q69L. See text for details. f Fluorescence images of steady state subcellular localization of MCF7 cells stably expressing the TFEB 1-159-NLS-cargo together with either mCherry-LacR or mCherry RAN-Q69L. Cells were treated with DMSO, Torin 1 (250 nM) alone or with LMB (20 nM) as indicated. Subcellular localization of TFEB-GFP was quantified for cells expressing mCherry. n > 100 cells per condition. In the RanQ experiment, only mCherry positive cells were counted. Scale bars = 20 μM. Error bars = SD. Student’s t-test; ****P < 0.0001, n.s. not significantCC BY · PubMed Central
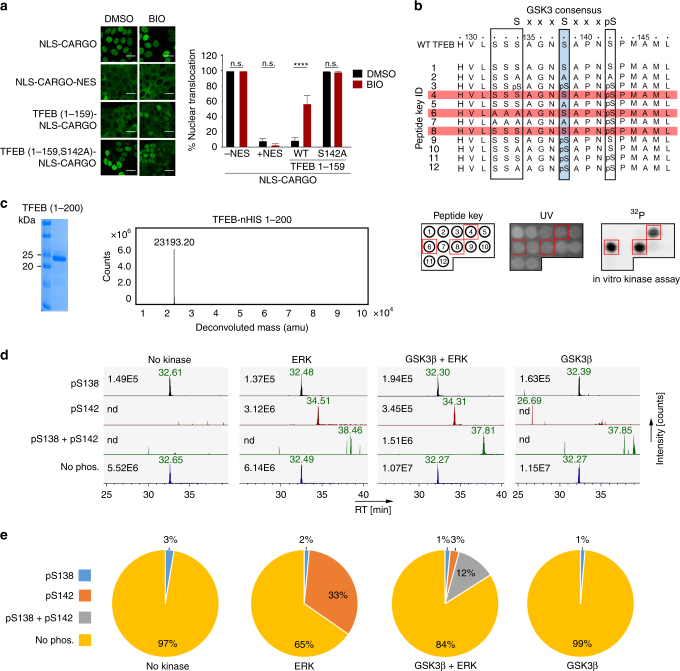
Fig. 4 Phosphorylation at S142 primes for GSK3β phosphorylation at S138. a Fluorescence images of cells expressing indicated WT and mutant cargo vectors in the presence and absence of BIO (10 μM). n > 50 cells per condition. Error bars = SD. Scale bar = 20 μM. ****p < 0.0001, n.s. not significant. b TFEB amino acids 129–152 showing the GSK3β consensus sequence. The S138 GSK3β site is highlighted in blue, the ERK/mTOR phosphorylation site S142 is boxed, as are three additional potential GSK3β sites that could be primed by phosphorylation at S138. Peptides 1–12 were spotted onto a membrane (see key corresponding to peptides in lower left panel) and subject to GSK3β phosphorylation in vitro. Peptides highlighted in red were phosphorylated by GSK3β. Lower panels: Peptide key corresponding to peptides above spotted onto a membrane (left) and visualized by UV (middle). The result of the GSK3β kinase assay is shown in the right panel and the red boxes correspond to phosphorylated peptides highlighted in red above. c Coomassie-stained gel of bacterially expressed and purified 6xHIS-tagged TFEB amino acids 1–200 (left) and associated Mass Spec spectrum (right). d Extracted ion chromatograms of tryptic peptides covering S138 and S142 in their differential phosphorylation states after indicated kinase treatment. A peptide with a single phosphorylation on S138 was detected at low intensity in all samples, including those not treated with GSK3β, while a peptide with a phosphorylation event on S142 was only detected in the ERK and GSKβ + ERK treated samples. Peptides dually phosphorylated on both S138 and on S142 were detected only after GSKβ + ERK treatment. Numbers represent maximum ion count for each peptide/phospho-peptide. e Quantification of TFEB in vitro kinase/Mass Spec data. The pie-charts illustrate the signal contribution of each (phospho-)peptide variant to total signal intensity covering the analyzed phosphorylation locus after kinase treatments. Assuming that each peptide variant has identical ionization characteristics, the charts reflect the stoichiometry of the different phospho-proteoforms of TFEB after kinase treatment
Fig. 4 Phosphorylation at S142 primes for GSK3β phosphorylation at S138. a Fluorescence images of cells expressing indicated WT and mutant cargo vectors in the presence and absence of BIO (10 μM). n > 50 cells per condition. Error bars = SD. Scale bar = 20 μM. ****p < 0.0001, n.s. not significant. b TFEB amino acids 129–152 showing the GSK3β consensus sequence. The S138 GSK3β site is highlighted in blue, the ERK/mTOR phosphorylation site S142 is boxed, as are three additional potential GSK3β sites that could be primed by phosphorylation at S138. Peptides 1–12 were spotted onto a membrane (see key corresponding to peptides in lower left panel) and subject to GSK3β phosphorylation in vitro. Peptides highlighted in red were phosphorylated by GSK3β. Lower panels: Peptide key corresponding to peptides above spotted onto a membrane (left) and visualized by UV (middle). The result of the GSK3β kinase assay is shown in the right panel and the red boxes correspond to phosphorylated peptides highlighted in red above. c Coomassie-stained gel of bacterially expressed and purified 6xHIS-tagged TFEB amino acids 1–200 (left) and associated Mass Spec spectrum (right). d Extracted ion chromatograms of tryptic peptides covering S138 and S142 in their differential phosphorylation states after indicated kinase treatment. A peptide with a single phosphorylation on S138 was detected at low intensity in all samples, including those not treated with GSK3β, while a peptide with a phosphorylation event on S142 was only detected in the ERK and GSKβ + ERK treated samples. Peptides dually phosphorylated on both S138 and on S142 were detected only after GSKβ + ERK treatment. Numbers represent maximum ion count for each peptide/phospho-peptide. e Quantification of TFEB in vitro kinase/Mass Spec data. The pie-charts illustrate the signal contribution of each (phospho-)peptide variant to total signal intensity covering the analyzed phosphorylation locus after kinase treatments. Assuming that each peptide variant has identical ionization characteristics, the charts reflect the stoichiometry of the different phospho-proteoforms of TFEB after kinase treatmentCC BY · PubMed Central
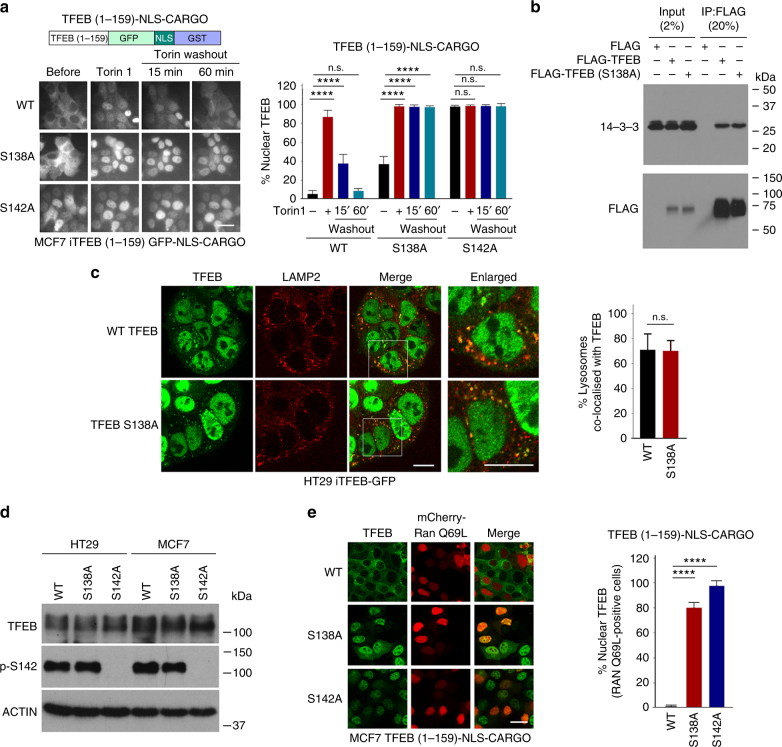
Fig. 5 S138 and S142 control nuclear export. a Live cell imaging of MCF7 cell lines stably expressing the indicated TFEB-cargo vectors. Cells were treated with Torin 1 (20 nM; 1 h) before the medium was changed and cells imaged at indicated times. n > 200 cells per condition. b Immunoprecipitation assay of extracts of cells transfected with FLAG-TFEB WT or S138A mutant. After immunoprecipitation, western blots were probed with anti-FLAG and anti-14-3-3 antibody. c Immunofluorescence of HT29 cells expressing stable doxycycline-inducible TFEB WT or S138A mutant treated with Torin 1 (1 h; 250 nM) showing co-localization with lysosomes marked using anti-LAMP2. Scale bar 10 μM. For lysosome co-localization quantification, lysosomes were stained by anti-LAMP2 antibody and their total numbers were counted. The percentage of TFEB lysosome co-localization was defined by the percentage of lysosomes with positive TFEB-GFP co-localization. N > 50 cells per condition. d Western blot of HT29 or MCF7 cells stably expressing indicated WT or mutant TFEB probed with anti-TFEB antibody or an antibody recognizing specifically phospho-S142. Actin is a loading control. e Fluorescence assays for MCF7 cells stably expressing doxycycline-inducible WT TFEB-GFP and S138A and S142A mutants in the absence of doxycycline transfected with mCherry RAN-Q69L. Quantification is for mCherry-RAN Q69L-expressing cells. n > 40 cells per condition. Student’s t-test; *P < 0.05, **P < 0.01, ***P < 0.001, ****P < 0.0001. Error bars = SD. Scale bars = 20 μM
Fig. 5 S138 and S142 control nuclear export. a Live cell imaging of MCF7 cell lines stably expressing the indicated TFEB-cargo vectors. Cells were treated with Torin 1 (20 nM; 1 h) before the medium was changed and cells imaged at indicated times. n > 200 cells per condition. b Immunoprecipitation assay of extracts of cells transfected with FLAG-TFEB WT or S138A mutant. After immunoprecipitation, western blots were probed with anti-FLAG and anti-14-3-3 antibody. c Immunofluorescence of HT29 cells expressing stable doxycycline-inducible TFEB WT or S138A mutant treated with Torin 1 (1 h; 250 nM) showing co-localization with lysosomes marked using anti-LAMP2. Scale bar 10 μM. For lysosome co-localization quantification, lysosomes were stained by anti-LAMP2 antibody and their total numbers were counted. The percentage of TFEB lysosome co-localization was defined by the percentage of lysosomes with positive TFEB-GFP co-localization. N > 50 cells per condition. d Western blot of HT29 or MCF7 cells stably expressing indicated WT or mutant TFEB probed with anti-TFEB antibody or an antibody recognizing specifically phospho-S142. Actin is a loading control. e Fluorescence assays for MCF7 cells stably expressing doxycycline-inducible WT TFEB-GFP and S138A and S142A mutants in the absence of doxycycline transfected with mCherry RAN-Q69L. Quantification is for mCherry-RAN Q69L-expressing cells. n > 40 cells per condition. Student’s t-test; *P < 0.05, **P < 0.01, ***P < 0.001, ****P < 0.0001. Error bars = SD. Scale bars = 20 μMCC BY · PubMed Central
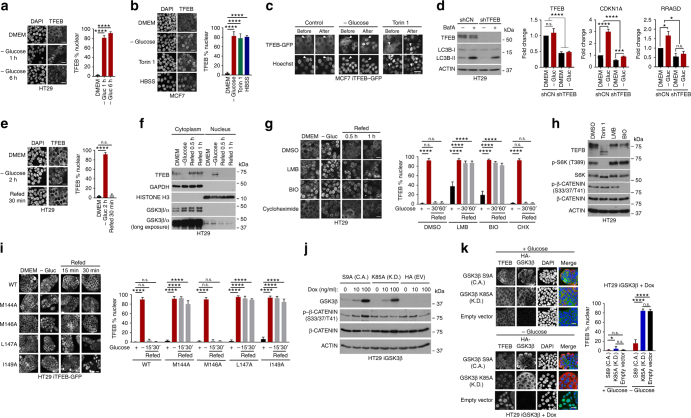
Fig. 6 TFEB nuclear export is regulated by Glucose. a Immunofluorescence of HT29 cells grown under indicated conditions. n > 100 cells per condition. b Immunofluorescence of MCF7 cells grown in DMEM, minus glucose, or +Torin 1 (250 nM) or HBSS. n > 30 cells per condition. c Live cell imaging of MCF7 iTFEB-GFP cells before or after glucose deprivation or Torin 1 (250 nM) treatment. d Left: western blot of HT29 cells expressing control shRNA or shTFEB grown in the presence or absence of Bafilomycin A (10 μM). Right: real time qRT PCR of CDKN1A (p21) and RRAGD mRNAs from shControl or shTFEB cells grown with or without glucose (3 h) with or without shTFEB. n = 3 individual experiments. Error bars = SD. Two-way ANOVA, *P < 0.05, ***P < 0.001, ****P < 0.0001, n.s. not significant. e Immunofluorescence of HT29 cells grown under indicated conditions. n > 100 cells per condition. f Western blot of fractionated HT29 cells grown under indicated conditions. g Immunofluorescence of HT29 cells grown in DMEM, or starved of glucose 1 h before refeeding with glucose alone or with LMB (20 nM), BIO (10 μM) or cycloheximide (50 μg ml−1). n > 500 cells per condition. h Western blot of HT29 cells treated with Toirn 1 (250 nM), LMB (2 nM) or BIO (10 μM) as indicated. i Fluorescence assay of TFEB-GFP WT and indicated mutants stable expressed in HT29 cells. Cells were grown in DMEM, starved of glucose for 2 h, then refed with glucose for 15 or 30 min and fixed before imaging. j Western blot of HT29 cells stably expressing doxycycline-inducible kinase dead (K.D.) or constitutively active (C.A.) HA-GSK3β and induced with 0, 10 and 100 ng ml−1 doxycycline for 20 h. k Immunofluorescence using anti-TFEB or anti-HA antibodies of HT29 cells expressing doxycycline-inducible constitutively active (C.A) or kinase dead (K.D.) GSK3β or empty vector grown in the presence of doxycycline (100 ng ml−1; 20 h) in the presence of glucose or deprived of glucose for 1 h. n > 200 cells per condition. Scale bars = 20 μM. Error bars = SD. Student’s t-test; *P < 0.05, **P < 0.01, ***P < 0.001, ****P < 0.0001
Fig. 6 TFEB nuclear export is regulated by Glucose. a Immunofluorescence of HT29 cells grown under indicated conditions. n > 100 cells per condition. b Immunofluorescence of MCF7 cells grown in DMEM, minus glucose, or +Torin 1 (250 nM) or HBSS. n > 30 cells per condition. c Live cell imaging of MCF7 iTFEB-GFP cells before or after glucose deprivation or Torin 1 (250 nM) treatment. d Left: western blot of HT29 cells expressing control shRNA or shTFEB grown in the presence or absence of Bafilomycin A (10 μM). Right: real time qRT PCR of CDKN1A (p21) and RRAGD mRNAs from shControl or shTFEB cells grown with or without glucose (3 h) with or without shTFEB. n = 3 individual experiments. Error bars = SD. Two-way ANOVA, *P < 0.05, ***P < 0.001, ****P < 0.0001, n.s. not significant. e Immunofluorescence of HT29 cells grown under indicated conditions. n > 100 cells per condition. f Western blot of fractionated HT29 cells grown under indicated conditions. g Immunofluorescence of HT29 cells grown in DMEM, or starved of glucose 1 h before refeeding with glucose alone or with LMB (20 nM), BIO (10 μM) or cycloheximide (50 μg ml−1). n > 500 cells per condition. h Western blot of HT29 cells treated with Toirn 1 (250 nM), LMB (2 nM) or BIO (10 μM) as indicated. i Fluorescence assay of TFEB-GFP WT and indicated mutants stable expressed in HT29 cells. Cells were grown in DMEM, starved of glucose for 2 h, then refed with glucose for 15 or 30 min and fixed before imaging. j Western blot of HT29 cells stably expressing doxycycline-inducible kinase dead (K.D.) or constitutively active (C.A.) HA-GSK3β and induced with 0, 10 and 100 ng ml−1 doxycycline for 20 h. k Immunofluorescence using anti-TFEB or anti-HA antibodies of HT29 cells expressing doxycycline-inducible constitutively active (C.A) or kinase dead (K.D.) GSK3β or empty vector grown in the presence of doxycycline (100 ng ml−1; 20 h) in the presence of glucose or deprived of glucose for 1 h. n > 200 cells per condition. Scale bars = 20 μM. Error bars = SD. Student’s t-test; *P < 0.05, **P < 0.01, ***P < 0.001, ****P < 0.0001CC BY · PubMed Central
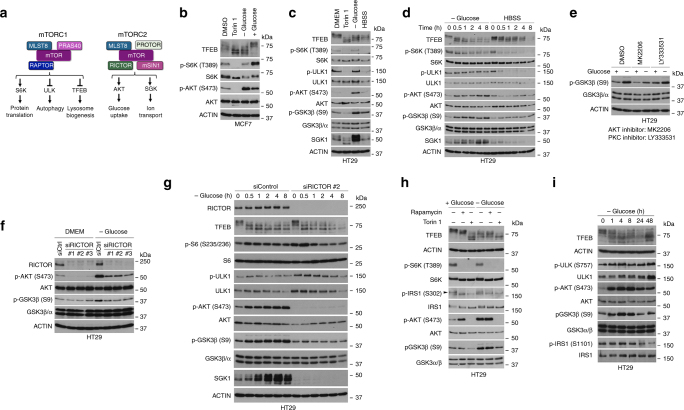
Fig. 7 mTORC2 regulates GSK3β in response to glucose limitation. a Schematic showing the mTORC1 and mTORC2 complexes and downstream targets. b–d Western blots using indicated antibodies of HT29 cells grown under indicated conditions. Unless otherwise indicated cells were placed in HBSS for 2 h, or treated with Torin 1 (250 nM) or starved of glucose for 2 h and where indicted refed glucose for 1 h. e Western blot using indicated antibodies of HT29 cells grown in DMEM or starved of glucose for 4 h and treated with DMSO, MK2206 (3 μM), or LY333531 (5 μM). f Western blot using indicated antibodies of HT29 cells. 48 h after transfection with RICTOR-specific or control siRNAs cells were glucose starved for 2 h, as indicated. g Western blot using indicated antibodies of HT29 cells transfected with control or RICTOR-specific siRNA for 48 h prior to glucose starvation for indicated times. h Western blot using indicated antibodies of HT29 cells grown in the presence of absence of glucose (4 h) of cells treated with Rapamycin (1 μM) or Torin 1 (250 nM). i Western blot using indicated antibodies of HT29 cells following glucose starvation for indicated times
Fig. 7 mTORC2 regulates GSK3β in response to glucose limitation. a Schematic showing the mTORC1 and mTORC2 complexes and downstream targets. b–d Western blots using indicated antibodies of HT29 cells grown under indicated conditions. Unless otherwise indicated cells were placed in HBSS for 2 h, or treated with Torin 1 (250 nM) or starved of glucose for 2 h and where indicted refed glucose for 1 h. e Western blot using indicated antibodies of HT29 cells grown in DMEM or starved of glucose for 4 h and treated with DMSO, MK2206 (3 μM), or LY333531 (5 μM). f Western blot using indicated antibodies of HT29 cells. 48 h after transfection with RICTOR-specific or control siRNAs cells were glucose starved for 2 h, as indicated. g Western blot using indicated antibodies of HT29 cells transfected with control or RICTOR-specific siRNA for 48 h prior to glucose starvation for indicated times. h Western blot using indicated antibodies of HT29 cells grown in the presence of absence of glucose (4 h) of cells treated with Rapamycin (1 μM) or Torin 1 (250 nM). i Western blot using indicated antibodies of HT29 cells following glucose starvation for indicated timesCC BY · PubMed Central
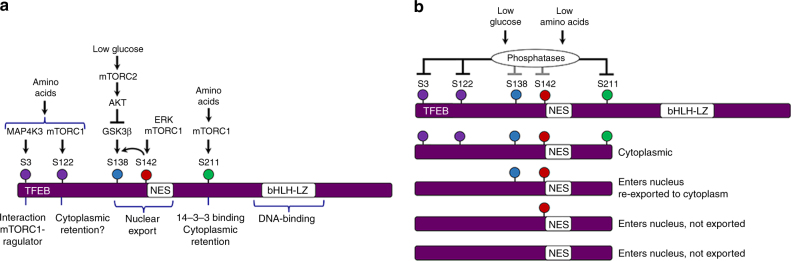
Fig. 8 Model to explain regulation of TFEB subcellular localization. a Summary of key regulatory phosphorylation events and their impact on TFEB subcellular location. b Model to explain the potential regulation of TFEB when amino acids or glucose are limiting. Under these conditions increased phosphatase activity targeting S211, and likely other phosphorylation sites, will release TFEB from its cytoplasmic anchor. Whether TFEB is retained in the nucleus will be dependent on the phosphorylation status of S138 and S142. Absence of phosphorylation of S138 or S142 will lead to nuclear retention. Note however that in this model dephosphorylation of S142 or S138 is not a necessary pre-requisite for nuclear entry
Fig. 8 Model to explain regulation of TFEB subcellular localization. a Summary of key regulatory phosphorylation events and their impact on TFEB subcellular location. b Model to explain the potential regulation of TFEB when amino acids or glucose are limiting. Under these conditions increased phosphatase activity targeting S211, and likely other phosphorylation sites, will release TFEB from its cytoplasmic anchor. Whether TFEB is retained in the nucleus will be dependent on the phosphorylation status of S138 and S142. Absence of phosphorylation of S138 or S142 will lead to nuclear retention. Note however that in this model dephosphorylation of S142 or S138 is not a necessary pre-requisite for nuclear entryCC BY · PubMed Central

Verification

Claims the paper makes

The claims and statistics of this paper haven’t been checked yet.

Run the check — free, no account needed. It reads the open-access text and checks the sources it cites.

A few free checks a day · papers already verified open instantly · results are public

Claims other papers make about this one

Each is checked against this paper’s own text: does it say what the citing paper says it does?

Self-check

Percentages, sums and reported differences re-computed from the paper’s own numbers.

The self-check needs the paper’s full text.

Citations

Cites

Show all 5 references

Research works printed but not linked: 43

  1. Settembre, C. et al. A lysosome-to-nucleus signalling mechanism senses and regulates the lysosome via mTOR and TFEB. EMBO J. 31, 1095–1108 (2012). · DOI · Paper page
  2. Martina, J. A., Diab, H. I., Li, H. & Puertollano, R. Novel roles for the MiTF/TFE family of transcription factors in organelle biogenesis, nutrient sensing, and energy homeostasis. Cell. Mol. Life Sci. 71, 2483–2497 (2014). · DOI
  3. Settembre, C. et al. TFEB controls cellular lipid metabolism through a starvation-induced autoregulatory loop. Nat. Cell Biol. 15, 647–658 (2013). · DOI · Paper page
  4. Pena-Llopis, S. et al. Regulation of TFEB and V-ATPases by mTORC1. EMBO J. 30, 3242–3258 (2011). · DOI
  5. Roczniak-Ferguson, A. et al. The transcription factor TFEB links mTORC1 signaling to transcriptional control of lysosome homeostasis. Sci. Signal. 5, ra42 (2012). · DOI
  6. Hsu, C. L. et al. MAP4K3 mediates amino acid-dependent regulation of autophagy via phosphorylation of TFEB. Nat. Commun. 9, 942 (2018). · DOI
  7. Findlay, G. M., Yan, L., Procter, J., Mieulet, V. & Lamb, R. F. A MAP4 kinase related to Ste20 is a nutrient-sensitive regulator of mTOR signalling. Biochem. J. 403, 13–20 (2007). · DOI
  8. Resnik-Docampo, M. & de Celis, J. F. MAP4K3 is a component of the TORC1 signalling complex that modulates cell growth and viability in Drosophila melanogaster. PLoS ONE 6, e14528 (2011). · DOI
  9. Bryk, B., Hahn, K., Cohen, S. M. & Teleman, A. A. MAP4K3 regulates body size and metabolism in Drosophila. Dev. Biol. 344, 150–157 (2010). · DOI
  10. Vega-Rubin-de-Celis, S., Pena-Llopis, S., Konda, M. & Brugarolas, J. Multistep regulation of TFEB by MTORC1. Autophagy 13, 1–9 (2017). · DOI · Paper page
  11. Li, Y. et al. Protein kinase C controls lysosome biogenesis independently of mTORC1. Nat. Cell Biol. 18, 1065–1077 (2016). · DOI
  12. Stretton, C. et al. GSK3-mediated raptor phosphorylation supports amino-acid-dependent mTORC1-directed signalling. Biochem. J. 470, 207–221 (2015). · DOI
  13. Marchand, B., Arsenault, D., Raymond-Fleury, A., Boisvert, F.-M. M. & Boucher, M.-J. J. Glycogen synthase kinase-3 (GSK3) inhibition induces prosurvival autophagic signals in human pancreatic cancer cells. J. Biol. Chem. 290, 5592–5605 (2015). · DOI
  14. Martina, J. A. A., Diab, H. I., Brady, O. A. & Puertollano, R. TFEB and TFE3 are novel components of the integrated stress response. EMBO J. 35, 479–495 (2016). · DOI · Paper page
  15. Mansueto, G. et al. Transcription factor EB controls metabolic flexibility during exercise. Cell. Metab. 25, 182–196 (2016). · DOI · Paper page
  16. Lu, H. et al. TFEB inhibits endothelial cell inflammation and reduces atherosclerosis. Sci. Signal. 10, pii: eaah4214 (2017). · DOI
  17. Palmieri, M. et al. mTORC1-independent TFEB activation via Akt inhibition promotes cellular clearance in neurodegenerative storage diseases. Nat. Commun. 8, 14338 (2017). · DOI · Paper page
  18. Decressac, M. & Bjorklund, A. TFEB: pathogenic role and therapeutic target in Parkinson disease. Autophagy 9, 1244–1246 (2013). · DOI
  19. La Spada, A. R. PPARGC1A/PGC-1alpha, TFEB and enhanced proteostasis in Huntington disease: defining regulatory linkages between energy production and protein-organelle quality control. Autophagy 8, 1845–1847 (2012). · DOI
  20. Fornerod, M., Ohno, M., Yoshida, M. & Mattaj, I. W. CRM1 is an export receptor for leucine-rich nuclear export signals. Cell 90, 1051–1060 (1997). · DOI
  21. Kalderon, D., Roberts, B. L., Richardson, W. D. & Smith, A. E. A short amino acid sequence able to specify nuclear location. Cell 39, 499–509 (1984). · DOI
  22. Wen, W., Meinkoth, J. L., Tsien, R. Y. & Taylor, S. S. Identification of a signal for rapid export of proteins from the nucleus. Cell 82, 463–473 (1995). · DOI
  23. Dephoure, N. et al. A quantitative atlas of mitotic phosphorylation. Proc. Natl. Acad. Sci. USA 105, 10762–10767 (2008). · DOI · Paper page
  24. Martina, J. A., Chen, Y., Gucek, M. & Puertollano, R. MTORC1 functions as a transcriptional regulator of autophagy by preventing nuclear transport of TFEB. Autophagy 8, 903–914 (2012). · DOI · Paper page
  25. Roberts, D. J., Tan-Sah, V. P., Ding, E. Y., Smith, J. M. & Miyamoto, S. Hexokinase-II positively regulates glucose starvation-induced autophagy through TORC1 inhibition. Mol. Cell 53, 521–533 (2014). · DOI
  26. Carreira, S. et al. Mitf cooperates with Rb1 and activates p21Cip1 expression to regulate cell cycle progression. Nature 433, 764–769 (2005). · DOI
  27. Di Malta, C. et al. Transcriptional activation of RagD GTPase controls mTORC1 and promotes cancer growth. Science 356, 1188–1192 (2017). · DOI
  28. Ougolkov, A. V. et al. Aberrant nuclear accumulation of glycogen synthase kinase-3beta in human pancreatic cancer: association with kinase activity and tumor dedifferentiation. Clin. Cancer Res. 12, 5074–5081 (2006). · DOI
  29. Medina, D. L. et al. Lysosomal calcium signalling regulates autophagy through calcineurin and TFEB. Nat. Cell Biol. 17, 288–299 (2015). · DOI
  30. Wolfson, R. L. et al. KICSTOR recruits GATOR1 to the lysosome and is necessary for nutrients to regulate mTORC1. Nature 543, 438–442 (2017). · DOI
  31. Efeyan, A. et al. Rag GTPase-mediated regulation of mTORC1 by nutrients is necessary for neonatal autophagy and survival. Nature 493, 679–683 (2013). · DOI
  32. Moloughney, J. G. et al. mTORC2 responds to glutamine catabolite levels to modulate the hexosamine biosynthesis enzyme GFAT1. Mol. Cell 63, 811–826 (2016). · DOI
  33. Martina, J. A. et al. The nutrient-responsive transcription factor TFE3 promotes autophagy, lysosomal biogenesis, and clearance of cellular debris. Sci. Signal. 7, https://doi.org/10.1126/scisignal.2004754 (2014). · DOI · Paper page
  34. Shah, O. J., Wang, Z. & Hunter, T. Inappropriate activation of the TSC/Rheb/mTOR/S6K cassette induces IRS1/2 depletion, insulin resistance, and cell survival deficiencies. Curr. Biol. 14, 1650–1656 (2004). · DOI
  35. Haruta, T. et al. A rapamycin-sensitive pathway down-regulates insulin signaling via phosphorylation and proteasomal degradation of insulin receptor substrate-1. Mol. Endocrinol. 14, 783–794 (2000). · DOI
  36. O’Reilly, K. E. et al. mTOR inhibition induces upstream receptor tyrosine kinase signaling and activates Akt. Cancer Res. 66, 1500–1508 (2006). · DOI · Paper page
  37. Martina, J. A. & Puertollano, R. Rag GTPases mediate amino acid-dependent recruitment of TFEB and MITF to lysosomes. J. Cell. Biol. 200, 475–491 (2013). · DOI · Paper page
  38. Martina, J. A. & Puertollano, R. RRAG GTPases link nutrient availability to gene expression, autophagy and lysosomal biogenesis. Autophagy 9, 928–930 (2013). · DOI
  39. Kaffman, A., Rank, N. M., O’Neill, E. M., Huang, L. S. & O’Shea, E. K. The receptor Msn5 exports the phosphorylated transcription factor Pho4 out of the nucleus. Nature 396, 482–486 (1998). · DOI
  40. Parr, C. et al. Glycogen synthase kinase 3 inhibition promotes lysosomal biogenesis and autophagic degradation of the amyloid-β precursor protein. Mol. Cell. Biol. 32, 4410–4418 (2012). · DOI
  41. Magnúsdóttir, E. et al. A tripartite transcription factor network regulates primordial germ cell specification in mice. Nat. Cell Biol. 15, 905–915 (2013). · DOI
  42. Suzuki, K., Bose, P., Leong-Quong, R. Y., Fujita, D. J. & Riabowol, K. REAP: a two minute cell fractionation method. BMC Res. Notes 3, 294 (2010). · DOI
  43. Winkler, D. F., Hilpert, K., Brandt, O. & Hancock, R. E. Synthesis of peptide arrays using SPOT-technology and the CelluSpots-method. Methods Mol. Biol. 570, 157–174 (2009). · DOI

Cited by

Sorted by citations

See all 114

Metadata

Authors
Li, L., Friedrichsen, H. J., Andrews, S., Picaud, S., Volpon, L., Ngeow, K., Berridge, G., Fischer, R., Borden, K. L. B., Filippakopoulos, P., & Goding, C. R.
Venue
Nature Communications
Published
2018-07-11
Volume
9
Issue
1
ISSN
2041-1723
Cited by
114
References
5
Language
en

About these checks

Registry, retraction, Cites and statistics results are computed, not judged, with one exception: a printed reference that no index lists is read once by a model before it counts as a citation error. Claims are extracted by a model and kept only when their quote appears verbatim in the text; each cited source is then checked, with a model’s help, for whether it says what the claim relies on. Those verdicts can be wrong — read the claim’s quote and the cited source before relying on one.

Statistics and arithmetic are recomputed, not judged.

Confidence bands are shown only for fields calibrated on our annotated test set. None is calibrated yet, so no band is shown.

What counts as a claim ›How we measure confidence ›How we check this ›

Are you an author, or do you see a problem with this page? Request a review

How to cite

Cite CoChat for the checks on this page, and the paper for its own findings.

This page
CoChat. (2026). Citation check: A TFEB nuclear export signal integrates amino acid supply and glucose availability. https://app.cochat.ai/papers/10.1038/s41467-018-04849-7
The paper
Li, L., Friedrichsen, H. J., Andrews, S., Picaud, S., Volpon, L., Ngeow, K., Berridge, G., Fischer, R., Borden, K. L. B., Filippakopoulos, P., & Goding, C. R. (2018). A TFEB nuclear export signal integrates amino acid supply and glucose availability. Nature Communications. https://doi.org/10.1038/s41467-018-04849-7