

The DOI matches its Crossref record; 79 of the 79 references it cites were found in a registry or an index.
The origin and adaptive evolution of domesticated populations of yeast from Far East Asia
Open accessAbstract
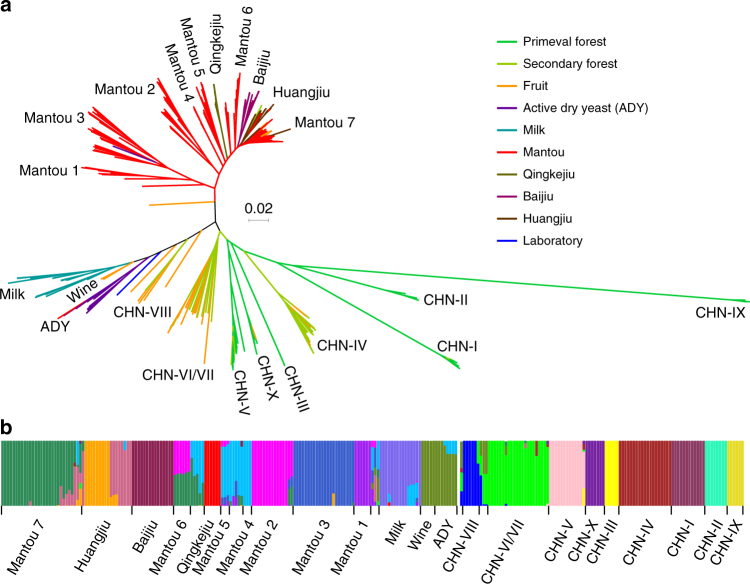
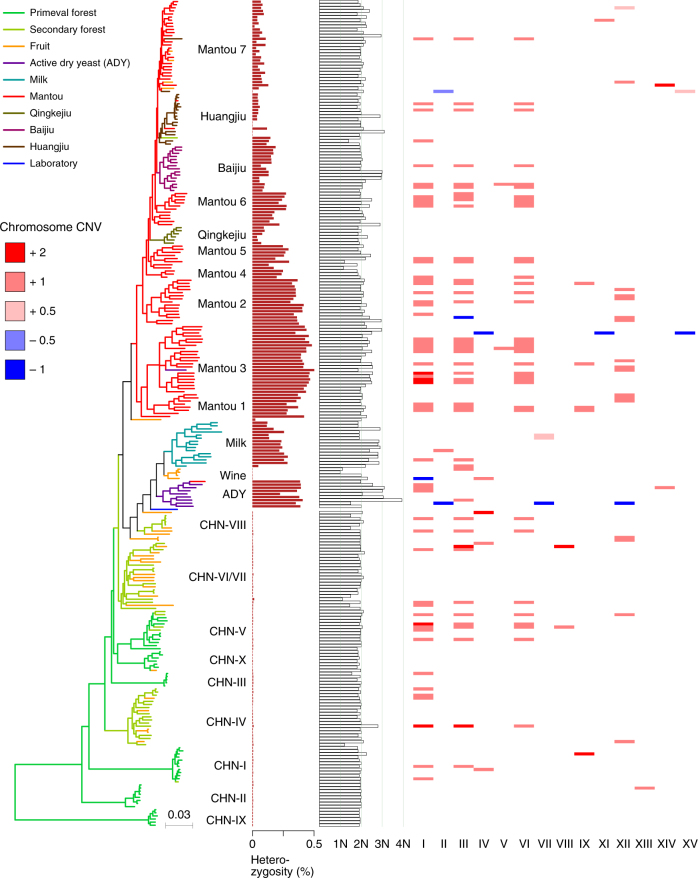
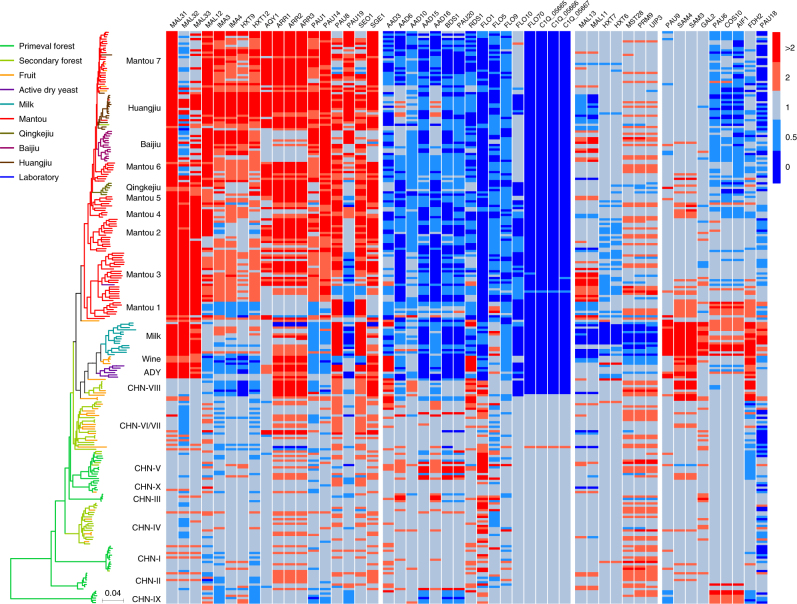
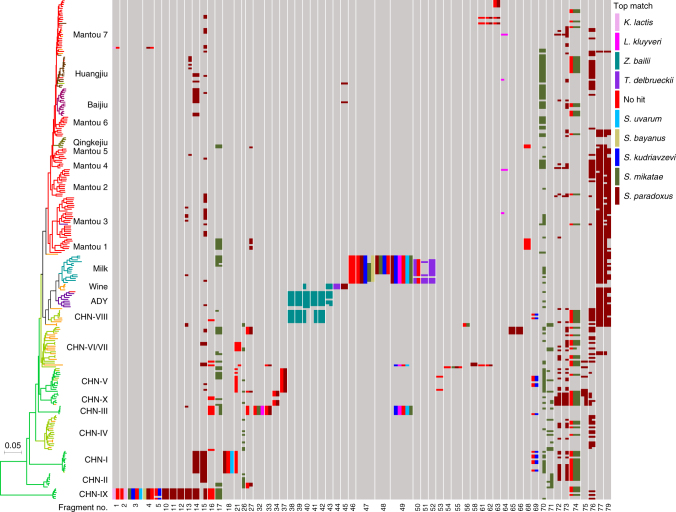
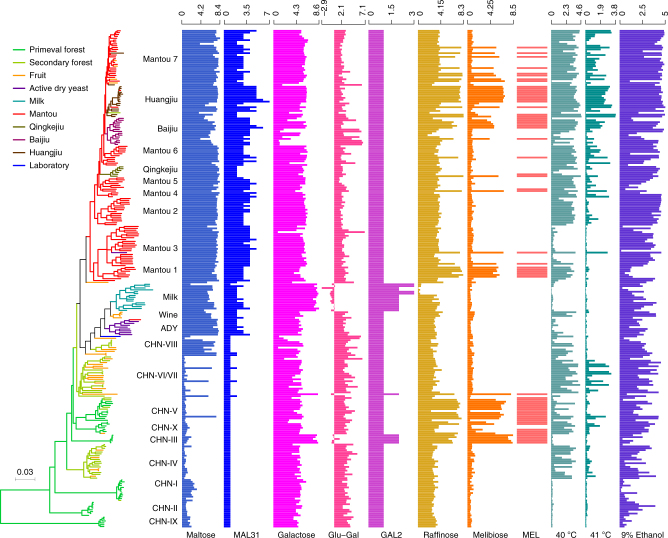
The yeast Saccharomyces cerevisiae has been an essential component of human civilization because of its long global history of use in food and beverage fermentation. However, the diversity and evolutionary history of the domesticated populations of the yeast remain elusive. We show here that China/Far East Asia is likely the center of origin of the domesticated populations of the species. The domesticated populations form two major groups associated with solid- and liquid-state fermentation and appear to have originated from heterozygous ancestors, which were likely formed by outcrossing between diverse wild isolates primitively for adaptation to maltose-rich niches. We found consistent gene expansion and contraction in the whole domesticated population, as well as lineage-specific genome variations leading to adaptation to different environments. We show a nearly panoramic view of the diversity and life history of S. cerevisiae and provide new insights into the origin and evolution of the species.
Overview
The claims and statistics of this paper haven’t been checked yet.
Run the check — free, no account needed. It reads the open-access text and checks the sources it cites.
Integrity signals
Registry
Cites
Statistics
Figures
Verification
Claims the paper makes
The claims and statistics of this paper haven’t been checked yet.
Run the check — free, no account needed. It reads the open-access text and checks the sources it cites.
Claims other papers make about this one
Each is checked against this paper’s own text: does it say what the citing paper says it does?
The cited source says what the claim attributes to it.
In the citing paper
“Our phylogeny (Figure 7C) comprised 424 strains and showed a stratification by food type and geography in accordance with literature. 21,116,120”
From Unexplored microbial diversity from 2,500 food metagenomes and links with the human microbiome. (2024) · cites this paper as [120]
Self-check
Percentages, sums and reported differences re-computed from the paper’s own numbers.
The self-check needs the paper’s full text.
Citations
Cites
Basic local alignment search tool
Altschul, S. F., Gish, W., Miller, W., Myers, E. W., & Lipman, D. J. (1990) · Journal of Molecular Biology · doi:10.1006/jmbi.1990.9999 · Cited by 98,669
Fast gapped-read alignment with Bowtie 2
Langmead, B., & Salzberg, S. L. (2012) · Nature Methods · doi:10.1038/nmeth.1923 · Cited by 56,400
MAFFT Multiple Sequence Alignment Software Version 7: Improvements in Performance and Usability
Katoh, K., & Standley, D. M. (2013) · Molecular Biology and Evolution · doi:10.1093/molbev/mst010 · Cited by 46,209
PLINK: a tool set for whole-genome association and population-based linkage analyses.
Purcell, S., Neale, B., Todd-Brown, K., Thomas, L., Ferreira, M. A. R., Bender, D., Maller, J., Sklar, P., de Bakker, P. I. W., Daly, M. J., et al. (2007) · The American Journal of Human Genetics · doi:10.1086/519795 · Cited by 34,089
RAxML version 8: a tool for phylogenetic analysis and post-analysis of large phylogenies
Stamatakis, A. (2014) · Bioinformatics · doi:10.1093/bioinformatics/btu033 · Cited by 32,291
The Genome Analysis Toolkit: A MapReduce framework for analyzing next-generation DNA sequencing data
McKenna, A., Hanna, M., Banks, E., Sivachenko, A., Cibulskis, K., Kernytsky, A., Garimella, K., Altshuler, D., Gabriel, S., Daly, M., et al. (2010) · Genome Research · doi:10.1101/gr.107524.110 · Cited by 27,895
Cingolani, P., Platts, A., Wang, L. L., Coon, M., Nguyen, T., Wang, L., Land, S. J., Lu, X., & Ruden, D. M. (2012) · Fly · doi:10.4161/fly.19695 · Cited by 11,816
Fast model-based estimation of ancestry in unrelated individuals
Alexander, D. H., Novembre, J., & Lange, K. (2009) · Genome Research · doi:10.1101/gr.094052.109 · Cited by 9,898
Velvet: Algorithms for de novo short read assembly using de Bruijn graphsPreprint
Zerbino, D. R., & Birney, E. (2008) · Genome Research · doi:10.1101/gr.074492.107 · Cited by 9,587
Walker, B. J., Abeel, T., Shea, T., Priest, M., Abouelliel, A., Sakthikumar, S., Cuomo, C. A., Zeng, Q., Wortman, J. R., Young, S., et al. (2014) · PLoS ONE · doi:10.1371/journal.pone.0112963 · Cited by 9,130
Research works printed but not linked: 1
- Naumov, G. I. & Nikonenko, P. E. The East Asia is a probable land of the cultured yeasts Saccharomyces cerevisiae (in Russia). Izv. Sib. Otd. Akad. Nauk SSSR Seriya Biol. Nauk 20, 97–101 (1988).
Cited by
Sorted by citations
Items 101–200 of 244
Next Generation Winemakers: Genetic Engineering in Saccharomyces cerevisiae for Trendy Challenges
Molina‐Espeja, P. (2020) · Bioengineering · doi:10.3390/bioengineering7040128 · Cited by 16
Ethanol production process driving changes on industrial strains
Nagamatsu, S. T., Coutouné, N., José, J., Fiamenghi, M. B., Pereira, G. A. G., Oliveira, J., & Carazzolle, M. F. (2021) · FEMS Yeast Research · doi:10.1093/femsyr/foaa071 · Cited by 15
Guidi, I. D., Farines, V., Legras, J., & Blondin, B. (2021) · Fermentation · doi:10.3390/fermentation7040213 · Cited by 16
Comparative genomics of infective Saccharomyces cerevisiae strains reveals their food origin
Morard, M., Pérez‐Través, L., Perpiñá, C., Lairón‐Peris, M., Collado, M. C., Pérez‐Torrado, R., & Querol, A. (2023) · Scientific Reports · doi:10.1038/s41598-023-36857-z · Cited by 16
Vicente, J., Friedrich, A., Schacherer, J., Freel, K. C., Marquina, D., & Santos, A. (2025) · Molecular Ecology · doi:10.1111/mec.17667 · Cited by 16
Ma, B., Chen, J., Yang, X., Bai, J., Ouyang, S., Mo, X., Chen, W., Wang, C., & Hai, X. (2021) · Frontiers in Genetics · doi:10.3389/fgene.2021.795570 · Cited by 16
Evolution and molecular bases of reproductive isolation
Bozdag, G. O., & Ono, J. (2022) · Current Opinion in Genetics & Development · doi:10.1016/j.gde.2022.101952 · Cited by 19
European farmhouse brewing yeasts form a distinct genetic group
Preiss, R., Fletcher, E., Garshol, L. M., Foster, B., Özşahin, E., Lubberts, M., van der Merwe, G. K., & Krogerus, K. (2024) · Applied Microbiology and Biotechnology · doi:10.1007/s00253-024-13267-3 · Cited by 15
Vandermeulen, M. D., Lorenz, M. C., & Cullen, P. J. (2024) · Genetics · doi:10.1093/genetics/iyae122 · Cited by 15
Jiang, R., Zhang, P., Wu, X., Wang, Y., Rehman, T., Yao, X., Luo, Y., & Yang, Z. (2020) · Electronic Journal of Biotechnology · doi:10.1016/j.ejbt.2020.12.006 · Cited by 15
Ancient and recent origins of shared polymorphisms in yeast
Tellini, N., Chiara, M. D., Mozzachiodi, S., Tattini, L., Vischioni, C., Naumova, E. S., Warringer, J., Bergström, A., & Liti, G. (2024) · Nature Ecology & Evolution · doi:10.1038/s41559-024-02352-5 · Cited by 17
Crossbreeding of Yeasts Domesticated for Fermentation: Infertility Challenges
福田, 展. (2020) · International Journal of Molecular Sciences · doi:10.3390/ijms21217985 · Cited by 13
Sampaio, J. P., & Pontes, A. (2025) · Current Biology · doi:10.1016/j.cub.2025.04.056 · Cited by 13
Walker, M. E., Liccioli, T., Large, C. R. L., Berkovich, Y., Lang, T. A., Dunham, M. J., Formby, S., & Jiranek, V. (2022) · FEMS Yeast Research · doi:10.1093/femsyr/foac022 · Cited by 13
Higgins, P., Grace, C. A., Lee, S., & Goddard, M. R. (2020) · G3 Genes Genomes Genetics · doi:10.1093/g3journal/jkaa027 · Cited by 13
Domestication of different varieties in the cheese-making fungus Geotrichum candidum
Bennetot, B., Vernadet, J., Perkins, V., Hautefeuille, S., de la Vega, R. C. R., O’Donnell, S., Snirc, A., Grondin, C., Lessard, M.-H., Péron, A.-C., et al. (2023) · Peer Community Journal · doi:10.24072/pcjournal.266 · Cited by 14
Ward, C. M., Onetto, C. A., Heuvel, S. V. D., Cuijvers, K. M., Hale, L. J., & Borneman, A. R. (2024) · PLoS Genetics · doi:10.1371/journal.pgen.1011223 · Cited by 13
Shi, G., Dai, Y., Zhou, D., Chen, M., Zhang, J., Bi, Y., Liu, S., & Wu, Q. (2024) · Mycology: An International Journal on Fungal Biology · doi:10.1080/21501203.2024.2358868 · Cited by 11
Sun, H., Liu, S., Zhang, J., Zhang, S., Mao, J., Xu, Y., Zhou, J., & Mao, J. (2022) · International Journal of Food Microbiology · doi:10.1016/j.ijfoodmicro.2022.109859 · Cited by 11
Song, L., Shi, J., Duan, S., Han, D., Li, K., Zhang, R., He, P., Han, P., Wang, Q., & Bai, F. (2021) · Genome Research · doi:10.1101/gr.262055.120 · Cited by 10
Self-citationDíaz-Muñoz, C., Verce, M., De Vuyst, L., & Weckx, S. (2022) · iScience · doi:10.1016/j.isci.2022.105309 · Cited by 10
Peter, J., Friedrich, A., Liti, G., & Schacherer, J. (2022) · Philosophical Transactions of the Royal Society B Biological Sciences · doi:10.1098/rstb.2020.0514 · Cited by 10
Martínez, A. A., Conboy, A., Buskirk, S. W., Marad, D. A., & Lang, G. I. (2022) · Journal of Molecular Evolution · doi:10.1007/s00239-022-10079-9 · Cited by 11
García-Mazcorro, J. F., Rodriguez‐Herrera, M., Marroquín-Cardona, A. G., & Kawas, J. R. (2019) · Letters in Applied Microbiology · doi:10.1111/lam.13141 · Cited by 12
Winans, M. J., Yamamoto, Y., Fujimaru, Y., Kusaba, Y., Gallagher, J. E. G., & Kitagaki, H. (2020) · Fermentation · doi:10.3390/fermentation6010014 · Cited by 10
Kanownik, W., Policht-Latawiec, A., & Dąbrowska, J. (2020) · Desalination and Water Treatment · doi:10.5004/dwt.2020.26629 · Cited by 10
Gene by Environment Interactions reveal new regulatory aspects of signaling network plasticity
Vandermeulen, M. D., & Cullen, P. J. (2022) · PLoS Genetics · doi:10.1371/journal.pgen.1009988 · Cited by 9
Revealing the 2300-Year-Old Fermented Beverage in a Bronze Bottle from Shaanxi, China
Li, L., Zhang, Y., Ge, W., Lin, Z., Sinnott-Armstrong, N., & Yang, L. (2024) · Fermentation · doi:10.3390/fermentation10070365 · Cited by 9
Fan, H., Wan, Y., YiXin, H., Yuan, J., Fan, J., Kou, Y., Yu, X., Pan, Y., Huang, D., & Fu, G. (2024) · Food Microbiology · doi:10.1016/j.fm.2024.104717 · Cited by 9
Yeast adapts to diverse ecological niches driven by genomics and metabolic reprogramming
Wang, H., Nielsen, J., Zhou, Y. J., & Lu, H. (2025) · Proceedings of the National Academy of Sciences · doi:10.1073/pnas.2502044122 · Cited by 12
Avelar‐Rivas, J. A., Sedeño, I., García-Ortega, L. F., Aragon, J. A. U., López-Gallegos, C., Dugua, X. A., Mancera, E., DeLuna, A., & Morales, L. (2026) · Nature Communications · doi:10.1038/s41467-026-69138-0 · Cited by 9
Introduction: Alcohol, rituals, and politics in the ancient world
Wang, J., & Li, L. (2022) · Journal of Anthropological Archaeology · doi:10.1016/j.jaa.2022.101397 · Cited by 9
Raas, M. W. D., & Dutheil, J. Y. (2023) · Molecular Ecology · doi:10.1111/mec.16980 · Cited by 9
Vandermeulen, M. D., & Cullen, P. J. (2023) · mSphere · doi:10.1128/msphere.00284-23 · Cited by 9
Cui, W., Liu, J., Zhu, L. D., Mandlaa, Sun, Z., & Chen, Z. (2024) · LWT · doi:10.1016/j.lwt.2024.117243 · Cited by 8
Paraíso, F., Pontes, A., Neves, J., Lebani, K., Hutzler, M., Zhou, N., & Sampaio, J. P. (2023) · Food Microbiology · doi:10.1016/j.fm.2023.104320 · Cited by 8
Pontes, A., Paraíso, F., Liu, Y., Limtong, S., Jindamorakot, S., Jespersen, L., Gonçalves, C., Rosa, C. A., Tsai, I. J., Rokas, A., et al. (2024) · iScience · doi:10.1016/j.isci.2024.108987 · Cited by 8
Cloning of the SPO11 gene that complements a meiotic recombination defect in sake yeast
Shimoi, H., Kawamura, N., & Yamada, M. (2020) · Journal of Bioscience and Bioengineering · doi:10.1016/j.jbiosc.2020.06.005 · Cited by 8
Rácz, H. V., Mukhtar, F., Imre, A., Rádai, Z., Gombert, A. K., Rátonyi, T., Nagy, J., Pócsi, I., & Pfliegler, W. P. (2021) · Yeast · doi:10.1002/yea.3562 · Cited by 8
Hatanaka, H., Toyonaga, H., Ishida, Y., Mizohata, E., & Ono, E. (2022) · FEMS Yeast Research · doi:10.1093/femsyr/foac055 · Cited by 8
Nie, Y., Zhao, H., Wang, Z., Zhou, Z., Liu, X., & Huang, B. (2021) · Frontiers in Microbiology · doi:10.3389/fmicb.2021.765733 · Cited by 8
Perspectives on current and future yeast technologies for ethanol-based biofuels and bioproducts
Attfield, P. V., Boyd, K., Purkovic, D., Ng, W. S., Arcenal, P., Kroukamp, H., & Bell, P. (2025) · FEMS Yeast Research · doi:10.1093/femsyr/foaf044 · Cited by 7
Ma, J., Huang, W., Ma, Y., Li, J., Feng, N., Bo, W., Jia, F., Wang, Y., & Gao, Z. (2024) · Food Chemistry X · doi:10.1016/j.fochx.2024.101584 · Cited by 7
Solieri, L., Cassanelli, S., Huff, F., Barroso, L., Branduardi, P., Louis, E. J., & Morrissey, J. P. (2021) · FEMS Yeast Research · doi:10.1093/femsyr/foab058 · Cited by 7
Renewing Lost Genetic Variability with a Classical Yeast Genetics Approach
Gupte, A. P., Pierantoni, D. C., Conti, A., Donati, L., Basaglia, M., Casella, S., Favaro, L., Corte, L., & Cardinali, G. (2023) · Journal of Fungi · doi:10.3390/jof9020264 · Cited by 6
Hu, S., Zhu, Q.-Y., Zhu, H., Liu, J.-Y., Shi, Y., Qiu, Y. T., Wen, Z., Li, A.-H., Han, P., & Bai, F. (2025) · IMA Fungus · doi:10.3897/imafungus.16.146163 · Cited by 6
Self-citationThe role of flour type and feeding schedule on the sourdough microbiome
Taheri, S., Schwarzkopf, E. J., Berman, H. L., Brandt, N. J., McNeill, J., Sevier, N., Ruffieux, M., Dunn, R. R., & Heil, C. S. (2025) · Microbiology Spectrum · doi:10.1128/spectrum.02380-25 · Cited by 6
Evolution of a Restriction Factor by Domestication of a Yeast Retrotransposon
Hannon-Hatfield, J. A., Chen, J., Bergman, C., & Garfinkel, D. J. (2024) · Molecular Biology and Evolution · doi:10.1093/molbev/msae050 · Cited by 6
Purine Auxotrophic Starvation Evokes Phenotype Similar to Stationary Phase Cells in Budding Yeast
Kokina, A., Tanilas, K., Ozoliņa, Z., Pleiko, K., Shvirksts, K., Vamža, I., & Liepiņš, J. (2021) · Journal of Fungi · doi:10.3390/jof8010029 · Cited by 7
Aguilar-Rodríguez, J., Vila, J. C. C., Chen, S.-A. A., Razo‐Mejia, M., Ghosh, O. M., Jarosz, D. F., Fraser, H. B., & Petrov, D. A. (2024) · bioRxiv (Cold Spring Harbor Laboratory) · doi:10.1101/2024.10.30.621178 · Cited by 12
Domestication drives repeated evolution of sexual–asexual life cycle trade-offs in yeast
Becerra-Rodríguez, C., Thiele, P., Brach, G., Dutta, A., Garin, M., Tan, G., Loegler, V., Friedrich, A., Andrews, B., Boone, C. M., et al. (2026) · Proceedings of the National Academy of Sciences · doi:10.1073/pnas.2526682123 · Cited by 10
Footprints of Human Migration in the Population Structure of Wild Baker's Yeast
Peña, J. J., da Costa, E. S. F., Ward, A. K., & Bensasson, D. (2025) · Molecular Ecology · doi:10.1111/mec.17669 · Cited by 5
Species-wide survey of the expressivity and complexity spectrum of traits in yeast
Tsouris, A., Fournier, T., Friedrich, A., Hou, J., Dunham, M. J., & Schacherer, J. (2024) · PLoS Genetics · doi:10.1371/journal.pgen.1011119 · Cited by 5
Studying on genetic diversity and metabolic differences of Saccharomyces cerevisiae in Baijiu
Li, Q., Lin, B., Tang, J., An, L., Jiang, W., Li, R., Zhang, G., Yang, Q., Yang, S., & Chen, S. (2024) · European Food Research and Technology · doi:10.1007/s00217-024-04489-w · Cited by 5
Hsiung, R.-T., Chiu, M.-C., & Chou, J.-Y. (2022) · Microbes and Environments · doi:10.1264/jsme2.me21053 · Cited by 5
Cat8 Response to Nutritional Changes and Interaction With Ehrlich Pathway Related Factors
Du, Z., Deng, H. X., Cheng, Y., Zhai, Z., Guo, X., Wang, Z., & He, X. (2022) · Frontiers in Microbiology · doi:10.3389/fmicb.2022.898938 · Cited by 5
The teenage years of yeast population genomics — trace history, admixing and getting wilder
Tsai, I. J. (2022) · Current Opinion in Genetics & Development · doi:10.1016/j.gde.2022.101942 · Cited by 5
Human-associated migration of Holarctic Saccharomyces uvarum strains to Patagonia
Flores, M. G., Rodríguez, M. E., Peris, D., Querol, A., Barrio, E., & Lopes, C. A. (2020) · Fungal ecology · doi:10.1016/j.funeco.2020.100990 · Cited by 5
The Population Genetics of Ploidy Change in FungiPreprint
Gerstein, A. C., & Sharp, N. P. (2020) · Preprints.org · doi:10.20944/preprints202009.0279.v1 · Cited by 5
Adaptive laboratory evolution of Saccharomyces cerevisiae CEN.PK 113-7D to enhance ethanol tolerance
Sheikhi, F., Babaei, M., Rostami, K., Azin, M., Asadollahi, M. A., Ghiaci, P., Ebrahimi, M., Feizi, A., & Borodina, I. (2025) · FEMS Yeast Research · doi:10.1093/femsyr/foaf058 · Cited by 4
Repeated losses of self-fertility shaped heterozygosity and polyploidy in yeast evolution
Vittorelli, N., Gómez-Muñoz, C., Andriushchenko, I., Ollivier, L., Agier, N., Delmas, S., Corbeau, Y., Achaz, G., Lagomarsino, M. C., Liti, G., et al. (2026) · Proceedings of the National Academy of Sciences · doi:10.1073/pnas.2525679123 · Cited by 4
Synthetic gene expression circuits regulating sexual reproduction
福田, 展., & Honda, S. (2019) · Methods in enzymology on CD-ROM/Methods in enzymology · doi:10.1016/bs.mie.2019.02.036 · Cited by 4
Fermenting Futures: an artistic view on yeast biotechnology
Dumitriu, A., May, A., Ata, Ö., & Mattanovich, D. (2021) · FEMS Yeast Research · doi:10.1093/femsyr/foab042 · Cited by 5
Takashi Nakase's last tweet: what is the current direction of microbial taxonomy research?
Takashima, M., Suh, S., Bai, F., & Sugita, T. (2019) · FEMS Yeast Research · doi:10.1093/femsyr/foz066 · Cited by 5
Self-citationNew Insights Into Wine Yeast Diversities
Albertin, W., Masneuf‐Pomarède, I., Galéote, V., & Legras, J. (2019) · Springer eBooks · doi:10.1007/978-1-4939-9782-4_4 · Cited by 4
Deciphering the formation mechanism of 2-furfurylthiol by multi-omics approach
Zhang, G., Xiao, P., Lv, S., Xu, L., Zhang, F., Xu, Y., Li, H., Sun, J., & Sun, B. (2024) · Food Bioscience · doi:10.1016/j.fbio.2024.105527 · Cited by 3
Contreras, Á., Villalobos-Cid, M., Valdés, C., Villarroel, C. A., Castro, F., Farías, I., & Lorca, G. (2025) · Frontiers in Microbiology · doi:10.3389/fmicb.2025.1599904 · Cited by 3
Fay, J. C., Miller, J. H., Dashko, S., Hyma, K. E., Liu, P., Volk, H., Cohen, H., Rahman, N. F., Tang, K., Longan, E. R., et al. (2025) · FEMS Yeast Research · doi:10.1093/femsyr/foaf074 · Cited by 3
Beyond recombination: Exploring the impact of meiotic frequency on genome-wide genetic diversity
Ollivier, L., Charlesworth, B., & Pouyet, F. (2025) · PLoS Genetics · doi:10.1371/journal.pgen.1011798 · Cited by 3
Simbaña, J., Barahona, P. P., & Barriga, E. J. C. (2021) · Journal of the American Society of Brewing Chemists · doi:10.1080/03610470.2021.1945366 · Cited by 3
Field-isolated brewing yeast produces wheat beer flavor without wheat ingredients
Shen, X., Chen, I., Chen, W.-H., Hsu, Y.-C., & Tsai, C. (2024) · LWT · doi:10.1016/j.lwt.2024.116088 · Cited by 3
Chen, G., Shi, G., Dai, Y., Zhao, R.-L., & Wu, Q. (2024) · Journal of Fungi · doi:10.3390/jof10080575 · Cited by 3
Sánchez‐Adriá, I. E., Prieto, J. A., Sanmartín, G., Morard, M., García‐Ríos, E., Estruch, F., & Rández‐Gil, F. (2025) · Microbial Biotechnology · doi:10.1111/1751-7915.70092 · Cited by 3
Wong, R. W. K., Foo, M., Lay, J. R. S., Wai, T. L. T., Moore, J., Dutreux, F., Molzahn, C. M., Nislow, C., Measday, V., Schacherer, J., et al. (2025) · Microbial Cell Factories · doi:10.1186/s12934-025-02677-1 · Cited by 3
Dai, Y., Shi, G., Chen, M., Chen, G., & Wu, Q. (2022) · Journal of Fungi · doi:10.3390/jof8090914 · Cited by 3
Clark, A. E., Dunham, M. J., & Akey, J. M. (2022) · bioRxiv (Cold Spring Harbor Laboratory) · doi:10.1101/2022.08.01.502362 · Cited by 4
Rácz, H. V., Imre, A., Németh, B., Antunovics, Z., Bazenova, R., Bendixsen, D. P., Harmath, A., Herman, L., Fulep, A., Lopandić, K., et al. (2025) · bioRxiv (Cold Spring Harbor Laboratory) · doi:10.1101/2025.02.07.637159 · Cited by 3
Drosophila courtship: neuronal coordination of behavioural sequences and a 60-year-old hypothesis
Cobb, M. (2019) · Current Biology · doi:10.1016/j.cub.2019.02.030 · Cited by 2
Vandermeulen, M. D., Khaiwal, S., Rubio, G., Liti, G., & Cullen, P. J. (2024) · iScience · doi:10.1016/j.isci.2024.110860 · Cited by 2
Horizontal Transfer and Recombination Fuel Ty4 Retrotransposon Evolution in Saccharomyces
Chen, J., Garfinkel, D. J., & Bergman, C. (2025) · Genome Biology and Evolution · doi:10.1093/gbe/evaf004 · Cited by 2
Su, C., Wang, H. Z., Jia, Y., Wang, W., Ma, X., Han, P., & Zhu, L. (2025) · Frontiers in Microbiology · doi:10.3389/fmicb.2025.1581370 · Cited by 2
Self-citationA haploid wild yeast resource for exploring the natural ecology of Saccharomyces cerevisiae
Yang, C.-J., Yeh, Y.-C., Hsiao, C., Liu, Y., Lu, M., Liu, Y., Liti, G., Tsai, I. J., & Ke, H. (2026) · iScience · doi:10.1016/j.isci.2026.117320 · Cited by 2
Fungal Rhizomes: Mycorrhizae and Posthumanism
Finzi, J. (2024) · Green Letters · doi:10.1080/14688417.2024.2361359 · Cited by 2
The modifiers that cause changes in gene essentiality
Batté, A., Bosch-Guiteras, N., Pons, C., Ota, M., Lopes, M., Sharma, S., Tellini, N., Paltenghi, C., Conti, M. M., Kan, K. T., et al. (2026) · Cell Systems · doi:10.1016/j.cels.2025.101515 · Cited by 2
Predicted yeast interactome and network‐based interpretation of transcriptionally changed genes
Jin, J., Tao, Y., Ding, X., Guo, W., Ruan, L., Yang, Q., Chen, P., Yao, H., Zhang, H., & Chen, X. (2020) · Yeast · doi:10.1002/yea.3516 · Cited by 2
Utilization of Saccharomyces cerevisiae as a Source of Natural Food Additives
Ienczak, J. L., Pereira, I. D. O., & da Silveira, J. M. (2022) · Springer eBooks · doi:10.1007/978-3-031-17346-2_7 · Cited by 2
Traditional Norwegian Kveik Yeast: An Ancient Sister Group to Domesticated Saccharomyces cerevisiaePreprint
Dondrup, M., Eiken, H. G., Martinussen, A. O., Haugland, L. K., Holdhus, R., Dolan, D., Grellscheid, S. N., Hagen, S. B., Elameen, A., & Myking, T. (2023) · bioRxiv (Cold Spring Harbor Laboratory) · doi:10.1101/2023.07.03.547515 · Cited by 2
Maria Rasheed1, *. A. X. D. (2023) · Agrobiological Records · doi:10.47278/journal.abr/2023.023 · Cited by 2
Genomic signatures of evolution and domestication in the button mushroom Agaricus bisporus
Ling, Z.-L., Chen, G.-T., Zhang, M.-Z., Wu, Q., Xu, J.-P., Cao, B., Liu, F., Ma, X.-B., & Zhao, R.-L. (2026) · Current Biology · doi:10.1016/j.cub.2025.12.008 · Cited by 1
Exploring the Controllability of Microbial Metabolism on the Flavor of Chinese Baijiu
Ying, H., Guo, X., Cheng, Y., Sheng, Q., Luo, Y., Yuan, Y., & Yue, T. (2026) · eFood · doi:10.1002/efd2.70126 · Cited by 1
N’Guessan, A., Wang, V., Bakerlee, C. W., Belousova, J., Brenna, G., Dillingham, M. E., Dupic, T., Gopalakrishnan, S., Goyal, J., Gupta, M., et al. (2026) · Nature Ecology & Evolution · doi:10.1038/s41559-026-03017-1 · Cited by 1
Izquierdo‐Gea, S., Vicente, J., Peña, T. A., Villarreal, P. D., Cubillos, F. A., Neuvéglise, C., Barriuso, J., Belda, I., & Ruíz, J. (2026) · Cell Reports · doi:10.1016/j.celrep.2026.117163 · Cited by 2
Yang, M., Yin, D., Zhong, Y., Wen, L., Li, Y., Wen, Y., & Hu, J. (2026) · Food Bioscience · doi:10.1016/j.fbio.2026.109000 · Cited by 1
Lebleux, M., Rouil, J., Segond, D., Marlin, T., Howell, K. S., Bechara, P., Nidelet, T., Arnould, L., Sicard, D., & Devillers, H. (2026) · Genome Biology and Evolution · doi:10.1093/gbe/evag176 · Cited by 1
McNeill, J., Brandt, N. J., Schwarzkopf, E. J., Jimenez, M., & Heil, C. S. (2025) · Heredity · doi:10.1038/s41437-025-00778-6 · Cited by 1
André Goffeau's imprinting on second generation yeast “genomologists”
Fairhead, C., Fischer, G., Liti, G., Neuvéglise, C., & Schacherer, J. (2019) · Yeast · doi:10.1002/yea.3377 · Cited by 1
Evolution: The Genetics of Milk Champagne Yeast
Brem, R. B. (2019) · Current Biology · doi:10.1016/j.cub.2019.02.040 · Cited by 1
Widespread positive selection for mRNA secondary structure at synonymous sites in domesticated yeastPreprint
Yu, M., Guo, W., Wang, Q., & Chen, J. (2019) · bioRxiv (Cold Spring Harbor Laboratory) · doi:10.1101/685016 · Cited by 1
Self-citationBraun‐Galleani, S., Dias, J. A., Coughlan, A. Y., Ryan, A. P., Byrne, K. P., & Wolfe, K. H. (2019) · bioRxiv (Cold Spring Harbor Laboratory) · doi:10.1101/704627 · Cited by 1
Lee, T. J., Liu, Y., Liu, W., Lin, Y., Lee, H., Ke, H., Huang, J.-P., Lu, M. J., Hsieh, C.-L., Chung, K., et al. (2021) · bioRxiv (Cold Spring Harbor Laboratory) · doi:10.1101/2021.09.07.459046 · Cited by 1
Self-citation
Metadata
- Authors
- Duan, S.-F., Han, P.-J., Wang, Q.-M., Liu, W.-Q., Shi, J.-Y., Li, K., Zhang, X.-L., & Bai, F.-Y.
- Affiliations
- Chinese Academy of Sciences (CN)
- Corresponding author
- Bai, Feng-Yan
- Venue
- Nature Communications
- Published
- 2018-07-12
- Volume
- 9
- Issue
- 1
- Pages
- 2690-2690
- ISSN
- 2041-1723 (ISSN-L)
- PMC
- PMC6043522
- OpenAlex
- W2812634658
- Cited by
- 244
- References
- 79
- Citations by year
- 2026: 23 · 2025: 26 · 2024: 38 · 2023: 25 · 2022: 34 · 2021: 35 · 2020: 32 · 2019: 27 · 2018: 3
- FWCI
- 8.63
- Type
- journal article
- Language
- en
- Open access
- gold
- doi.org
- Locations
- Nature Communications (publishedVersion, cc-by)
- Europe PMC (PubMed Central) (publishedVersion, other-oa)
- PubMed Central (publishedVersion, cc-by)
- PubMed (publishedVersion)
- RePEc: Research Papers in Economics (submittedVersion)
- DOAJ (DOAJ: Directory of Open Access Journals) (submittedVersion, cc-by-sa)
- DOAJ (DOAJ: Directory of Open Access Journals) (submittedVersion)
- Funders
- National Natural Science Foundation of China (31470150, 91131004, 31461143027)
- Chinese Academy of Sciences (QYZDJ-SSW-SWC013)
- Topics
- Life Sciences › Immunology and Microbiology › Microbiology › Yeasts and Rust Fungi Studies
- Life Sciences › Biochemistry, Genetics and Molecular Biology › Molecular Biology › Fungal and yeast genetics research
- Life Sciences › Biochemistry, Genetics and Molecular Biology › Genetics › Genetic diversity and population structure
- Keywords
- Saccharomyces cerevisiae, domestication, center of origin, adaptive evolution, solid-state fermentation, liquid fermentation, outcrossing, yeast diversity, Far East Asia
- MeSH terms
- Adaptation, Physiological, Asia, Asia, Eastern, Fermentation, Genetics, Population, Phylogeny, Saccharomyces cerevisiae, Genetic Variation, Genome, Fungal, Evolution, Molecular
About these checks
Registry, retraction, Cites and statistics results are computed, not judged, with one exception: a printed reference that no index lists is read once by a model before it counts as a citation error. Claims are extracted by a model and kept only when their quote appears verbatim in the text; each cited source is then checked, with a model’s help, for whether it says what the claim relies on. Those verdicts can be wrong — read the claim’s quote and the cited source before relying on one.
Statistics and arithmetic are recomputed, not judged.
Confidence bands are shown only for fields calibrated on our annotated test set. None is calibrated yet, so no band is shown.
What counts as a claim ›How we measure confidence ›How we check this ›
Are you an author, or do you see a problem with this page? Request a review
