Cited by 171Neuroscience and Neuropharmacology ResearchAutism Spectrum Disorder ResearchNeurotransmitter Receptor Influence on Behavior

The DOI matches its Crossref record; 94 of the 94 references it cites were found in a registry or an index.

Role of VTA dopamine neurons and neuroligin 3 in sociability traits related to nonfamiliar conspecific interaction

Open access

Published version of a preprint

Abstract

Atypical habituation and aberrant exploration of novel stimuli have been related to the severity of autism spectrum disorders (ASDs), but the underlying neuronal circuits are unknown. Here we show that chemogenetic inhibition of dopamine (DA) neurons of the ventral tegmental area (VTA) attenuates exploration toward nonfamiliar conspecifics and interferes with the reinforcing properties of nonfamiliar conspecific interaction in mice. Exploration of nonfamiliar stimuli is associated with the insertion of GluA2-lacking AMPA receptors at excitatory synapses on VTA DA neurons. These synaptic adaptations persist upon repeated exposure to social stimuli and sustain conspecific interaction. Global or VTA DA neuron-specific loss of the ASD-associated synaptic adhesion molecule neuroligin 3 alters the behavioral response toward nonfamiliar conspecifics and the reinforcing properties of conspecific interaction. These behavioral deficits are accompanied by an aberrant expression of AMPA receptors and an occlusion of synaptic plasticity. Altogether, these findings link impaired exploration of nonfamiliar conspecifics to VTA DA neuron dysfunction in mice.

Overview

The claims and statistics of this paper haven’t been checked yet.

Run the check — free, no account needed. It reads the open-access text and checks the sources it cites.

A few free checks a day · papers already verified open instantly · results are public

Integrity signals

Registry

Crossref · 10.1038/s41467-018-05382-3

Cites

94 of 94 references verified0 citation errors · 0 not checkable

Statistics

Figures

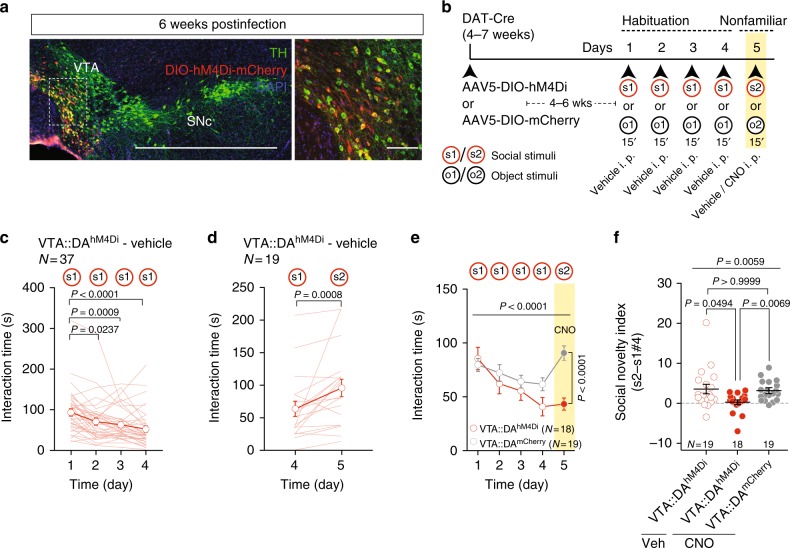
Fig. 1 VTA DA neuron excitability controls exploration of nonfamiliar conspecific. a Representative images (low and high magnification) of immuno-staining experiments against tyrosine hydroxylase (TH) enzyme (in green) performed on midbrain slices of DAT-Cre mice infected with AAV5-DIO-hM4Di-mCherry (red). Scale bar: 1 mm and 100 μm. b Experimental time-course for the habituation/nonfamiliar exploration task. c Time course of time interaction for VTA::DAhM4Di mice treated with vehicle during habituation phase. Friedman test (x2(4) = 32.94, P < 0.0001) followed by Dunn’s test for planned multiple comparisons. d Graph reporting the time interaction at day 4 with s1 and at day 5 with s2 for VTA::DAhM4Di mice treated with vehicle. Wilcoxon test (W = 156). e Time interaction over days during the habituation/nonfamiliar exploration task (s1 and s2 are nonfamiliar conspecific stimuli presented at day 1–4 and 5, respectively) for VTA::DAhM4Di and VTA::DAmCherry mice treated with CNO. Repeated measures (RM) two-way ANOVA (time main effect: F(4,140) = 12.38, P < 0.0001; virus main effect: F(1,35) = 3.13, P = 0.0854; time × drug interaction: F(4,140) = 9.32, P < 0.0001) followed by Bonferroni post hoc test. f Social novelty index calculated from VTA::DAhM4Di treated with vehicle, VTA::DAhM4Di and VTA::DAmCherry both treated with CNO. Kruskal–Wallis test (K(3) = 10.26, P = 0.0059) followed by Dunn’s multiple comparisons test. N indicates number of mice. Error bars report s.e.m
Fig. 1 VTA DA neuron excitability controls exploration of nonfamiliar conspecific. a Representative images (low and high magnification) of immuno-staining experiments against tyrosine hydroxylase (TH) enzyme (in green) performed on midbrain slices of DAT-Cre mice infected with AAV5-DIO-hM4Di-mCherry (red). Scale bar: 1 mm and 100 μm. b Experimental time-course for the habituation/nonfamiliar exploration task. c Time course of time interaction for VTA::DAhM4Di mice treated with vehicle during habituation phase. Friedman test (x2(4) = 32.94, P < 0.0001) followed by Dunn’s test for planned multiple comparisons. d Graph reporting the time interaction at day 4 with s1 and at day 5 with s2 for VTA::DAhM4Di mice treated with vehicle. Wilcoxon test (W = 156). e Time interaction over days during the habituation/nonfamiliar exploration task (s1 and s2 are nonfamiliar conspecific stimuli presented at day 1–4 and 5, respectively) for VTA::DAhM4Di and VTA::DAmCherry mice treated with CNO. Repeated measures (RM) two-way ANOVA (time main effect: F(4,140) = 12.38, P < 0.0001; virus main effect: F(1,35) = 3.13, P = 0.0854; time × drug interaction: F(4,140) = 9.32, P < 0.0001) followed by Bonferroni post hoc test. f Social novelty index calculated from VTA::DAhM4Di treated with vehicle, VTA::DAhM4Di and VTA::DAmCherry both treated with CNO. Kruskal–Wallis test (K(3) = 10.26, P = 0.0059) followed by Dunn’s multiple comparisons test. N indicates number of mice. Error bars report s.e.mCC BY · PubMed Central
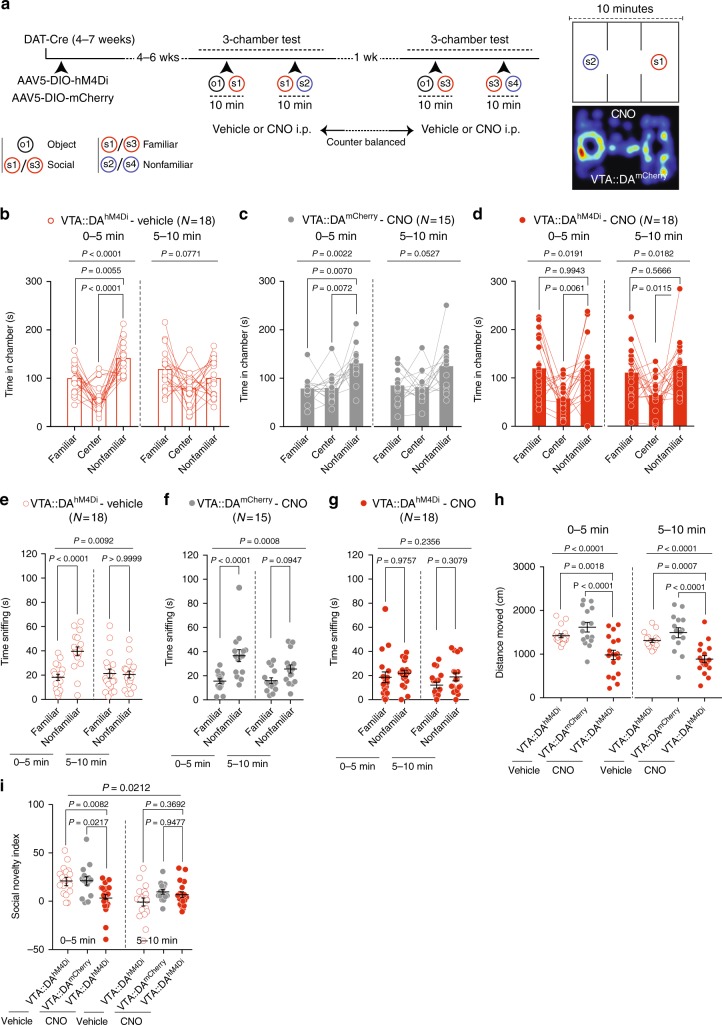
Fig. 2 VTA DA neuron excitability controls preference for nonfamiliar conspecific. a Left: experimental time-course. Right: apparatus schematic and occupancy plot. b Time in chamber for vehicle treated VTA::DAhM4Di. RM one-way ANOVA (chamber main effect: F(1.969, 33.48) = 21.79, P < 0.0001, first 5 mins; chamber main effect: F(1.881, 31.98) = 2.825, P = 0.0771, last 5 mins) followed by Holm-Sidak post hoc test. c Time in chamber for CNO treated VTA::DAmCherry. RM one-way ANOVA (chamber main effect: F(1.645, 23.03) = 8.959, P = 0.0022, first 5 mins; chamber main effect: F(1.545, 21.63) = 3.665, P = 0.0527, last 5 mins) followed by Holm-Sidak post hoc test. d Time in chamber for CNO treated VTA::DAhM4Di mice. RM one-way ANOVA (chamber main effect: F(1.494, 25.4) = 5.248, P = 0.0191, first 5 mins; chamber main effect: F(1.663, 28.27) = 5.006, P = 0.0182, last 5 mins) followed by Holm-Sidak post hoc test. e Time sniffing for vehicle treated VTA::DAhM4Di. RM two-way ANOVA (stimulus main effect: F(1,34) = 7.634, P = 0.0092; time main effect: F(1,34) = 9.617, P = 0.0039; time × stimulus interaction: F(1,34) = 18.41, P = 0.0001) followed by Bonferroni post hoc test. f Time sniffing for CNO treated VTA::DAmCherry. RM two-way ANOVA (stimulus main effect: F(1,28) = 13.96, P = 0.0008; time main effect: F(1,28) = 5.028, P = 0.0330; time × stimulus interaction: F(1,28) = 5.629, P = 0.0248) followed by Bonferroni post hoc test. g Time sniffing for CNO treated VTA::DAhM4Di mice. RM two-way ANOVA (stimulus main effect: F(1,34) = 1.458, P = 0.2356; Time main effect: F(1,34) = 4.806, P = 0.0353; time × stimulus interaction: F(1,34) = 0.6434, P = 0.4281) followed by Bonferroni post hoc test. h Distance moved. One-way ANOVA (group main effect: F(2, 48) = 12.86, P < 0.0001, first 5 mins; group main effect: F(2, 48) = 15.01, P < 0.0001, last 5 mins) followed by Bonferroni post hoc test for planned comparisons. i Social novelty index. RM two-way ANOVA (time main effect: F(2,48) = 10.54, P = 0.0021; group main effect: F(2,48) = 35.503, P = 0.0212; time × group interaction: F(2,48) = 6.23, P = 0.0039) followed by Bonferroni post hoc test for planned comparisons. N indicates number of mice. Error bars represent s.e.m
Fig. 2 VTA DA neuron excitability controls preference for nonfamiliar conspecific. a Left: experimental time-course. Right: apparatus schematic and occupancy plot. b Time in chamber for vehicle treated VTA::DAhM4Di. RM one-way ANOVA (chamber main effect: F(1.969, 33.48) = 21.79, P < 0.0001, first 5 mins; chamber main effect: F(1.881, 31.98) = 2.825, P = 0.0771, last 5 mins) followed by Holm-Sidak post hoc test. c Time in chamber for CNO treated VTA::DAmCherry. RM one-way ANOVA (chamber main effect: F(1.645, 23.03) = 8.959, P = 0.0022, first 5 mins; chamber main effect: F(1.545, 21.63) = 3.665, P = 0.0527, last 5 mins) followed by Holm-Sidak post hoc test. d Time in chamber for CNO treated VTA::DAhM4Di mice. RM one-way ANOVA (chamber main effect: F(1.494, 25.4) = 5.248, P = 0.0191, first 5 mins; chamber main effect: F(1.663, 28.27) = 5.006, P = 0.0182, last 5 mins) followed by Holm-Sidak post hoc test. e Time sniffing for vehicle treated VTA::DAhM4Di. RM two-way ANOVA (stimulus main effect: F(1,34) = 7.634, P = 0.0092; time main effect: F(1,34) = 9.617, P = 0.0039; time × stimulus interaction: F(1,34) = 18.41, P = 0.0001) followed by Bonferroni post hoc test. f Time sniffing for CNO treated VTA::DAmCherry. RM two-way ANOVA (stimulus main effect: F(1,28) = 13.96, P = 0.0008; time main effect: F(1,28) = 5.028, P = 0.0330; time × stimulus interaction: F(1,28) = 5.629, P = 0.0248) followed by Bonferroni post hoc test. g Time sniffing for CNO treated VTA::DAhM4Di mice. RM two-way ANOVA (stimulus main effect: F(1,34) = 1.458, P = 0.2356; Time main effect: F(1,34) = 4.806, P = 0.0353; time × stimulus interaction: F(1,34) = 0.6434, P = 0.4281) followed by Bonferroni post hoc test. h Distance moved. One-way ANOVA (group main effect: F(2, 48) = 12.86, P < 0.0001, first 5 mins; group main effect: F(2, 48) = 15.01, P < 0.0001, last 5 mins) followed by Bonferroni post hoc test for planned comparisons. i Social novelty index. RM two-way ANOVA (time main effect: F(2,48) = 10.54, P = 0.0021; group main effect: F(2,48) = 35.503, P = 0.0212; time × group interaction: F(2,48) = 6.23, P = 0.0039) followed by Bonferroni post hoc test for planned comparisons. N indicates number of mice. Error bars represent s.e.mCC BY · PubMed Central
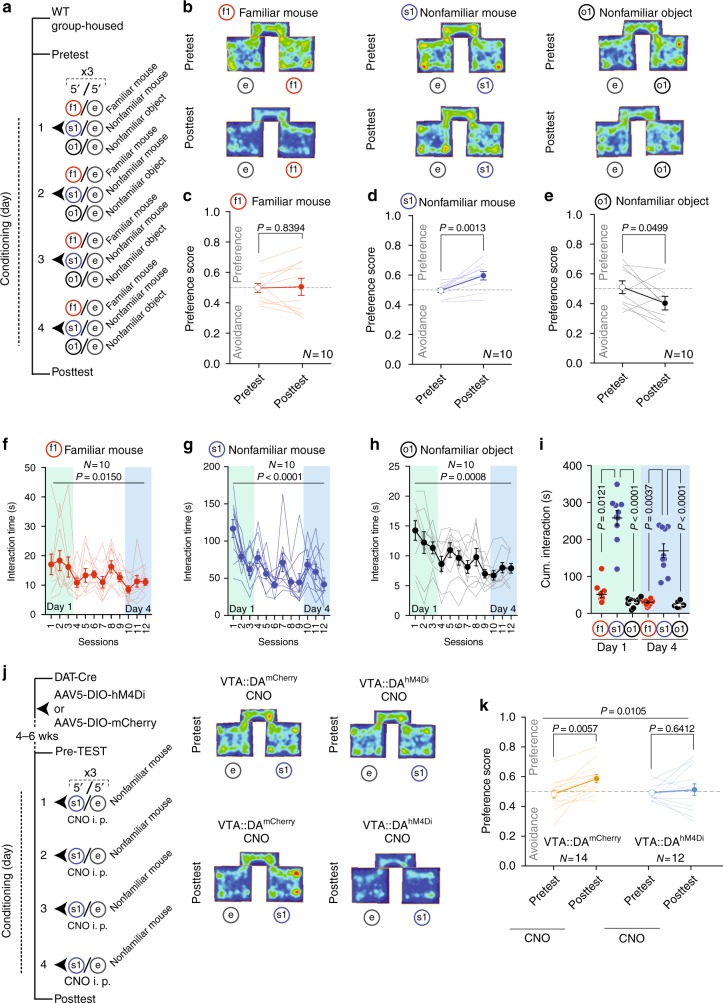
Fig. 3 VTA DA neuron excitability mediates the reinforcing properties of nonfamiliar conspecific. a Experimental protocol for conditioned place preference with different stimuli. b Representative occupancy plots. c Scatter plot of preference score measured for familiar mouse pairing during CPP. Paired t test (t(9) = 0.2086; mean and s.e.m for Pre-TEST: 0.498 ± 0.0298; mean and s.e.m for Post-TEST: 0.506 ± 0.0562). d Scatter plot of preference score for nonfamiliar conspecific pairing during CPP. Paired t test (t(9) = 4.578; mean and s.e.m for Pre-TEST: 0.497 ± 0.0144; mean and s.e.m for Post-TEST: 0.596 ± 0.0285). e Scatter plot of preference score for novel object pairing during CPP. Paired t test (t(9) = 2.263; mean and s.e.m for Pre-TEST: 0.510 ± 0.0430; mean and s.e.m for Post-TEST: 0.403 ± 0.0455). f Time course of interaction during conditioning blocks with a familiar mouse (f1). Friedman test (P = 0.0150; x2(12) = 23.51). g Time course of interaction during conditioning blocks with a nonfamiliar conspecific (s1). Friedman test (P < 0.0001; x2(12) = 52.71). h Time course of interaction during conditioning blocks with a novel object (o1). Friedman test (P = 0.0008; x2(12) = 31.88). i Cumulative interaction during conditioning sessions at day 1 and day 4, respe–Wallis test (K(6) = 46.09, P < 0.0001) followed by Dunn’s test for planned comparisons. j Left: experimental protocol for VTA::DAhM4Di and VTA::DAmCherry treated with CNO during CPP with nonfamiliar conspecific pairings. Right: representative occupancy plots for CNO treated VTA::DAmCherry and VTA::DAhM4Di. k Scatter plot of preference score for VTA::DAmCherry treated with CNO during conditioning sessions with a nonfamiliar conspecific (mean and s.e.m for Pre-TEST: 0.4808 ± 0.0267; mean and s.e.m for Post-TEST: 0.5836 ± 0.0275), and scatter plot of preference score for VTA::DAhM4Di treated with CNO during conditioning sessions with a nonfamiliar conspecific (mean and s.e.m for Pre-TEST: 0.4903 ± 0.0162; mean and s.e.m for Post-TEST: 0.5091 ± 0.0428). RM two-way ANOVA (time main effect: F(1, 24) = 7.7048, P = 0.0105; virus main effect: F(1,24) = 0.8678, P = 0.3609; time × virus interaction: F(1,24) = 3.2861, P = 0.0824) followed by Bonferroni post hoc test for planned comparisons. N indicates number of mice. Error bars represent s.e.m
Fig. 3 VTA DA neuron excitability mediates the reinforcing properties of nonfamiliar conspecific. a Experimental protocol for conditioned place preference with different stimuli. b Representative occupancy plots. c Scatter plot of preference score measured for familiar mouse pairing during CPP. Paired t test (t(9) = 0.2086; mean and s.e.m for Pre-TEST: 0.498 ± 0.0298; mean and s.e.m for Post-TEST: 0.506 ± 0.0562). d Scatter plot of preference score for nonfamiliar conspecific pairing during CPP. Paired t test (t(9) = 4.578; mean and s.e.m for Pre-TEST: 0.497 ± 0.0144; mean and s.e.m for Post-TEST: 0.596 ± 0.0285). e Scatter plot of preference score for novel object pairing during CPP. Paired t test (t(9) = 2.263; mean and s.e.m for Pre-TEST: 0.510 ± 0.0430; mean and s.e.m for Post-TEST: 0.403 ± 0.0455). f Time course of interaction during conditioning blocks with a familiar mouse (f1). Friedman test (P = 0.0150; x2(12) = 23.51). g Time course of interaction during conditioning blocks with a nonfamiliar conspecific (s1). Friedman test (P < 0.0001; x2(12) = 52.71). h Time course of interaction during conditioning blocks with a novel object (o1). Friedman test (P = 0.0008; x2(12) = 31.88). i Cumulative interaction during conditioning sessions at day 1 and day 4, respe–Wallis test (K(6) = 46.09, P < 0.0001) followed by Dunn’s test for planned comparisons. j Left: experimental protocol for VTA::DAhM4Di and VTA::DAmCherry treated with CNO during CPP with nonfamiliar conspecific pairings. Right: representative occupancy plots for CNO treated VTA::DAmCherry and VTA::DAhM4Di. k Scatter plot of preference score for VTA::DAmCherry treated with CNO during conditioning sessions with a nonfamiliar conspecific (mean and s.e.m for Pre-TEST: 0.4808 ± 0.0267; mean and s.e.m for Post-TEST: 0.5836 ± 0.0275), and scatter plot of preference score for VTA::DAhM4Di treated with CNO during conditioning sessions with a nonfamiliar conspecific (mean and s.e.m for Pre-TEST: 0.4903 ± 0.0162; mean and s.e.m for Post-TEST: 0.5091 ± 0.0428). RM two-way ANOVA (time main effect: F(1, 24) = 7.7048, P = 0.0105; virus main effect: F(1,24) = 0.8678, P = 0.3609; time × virus interaction: F(1,24) = 3.2861, P = 0.0824) followed by Bonferroni post hoc test for planned comparisons. N indicates number of mice. Error bars represent s.e.mCC BY · PubMed Central
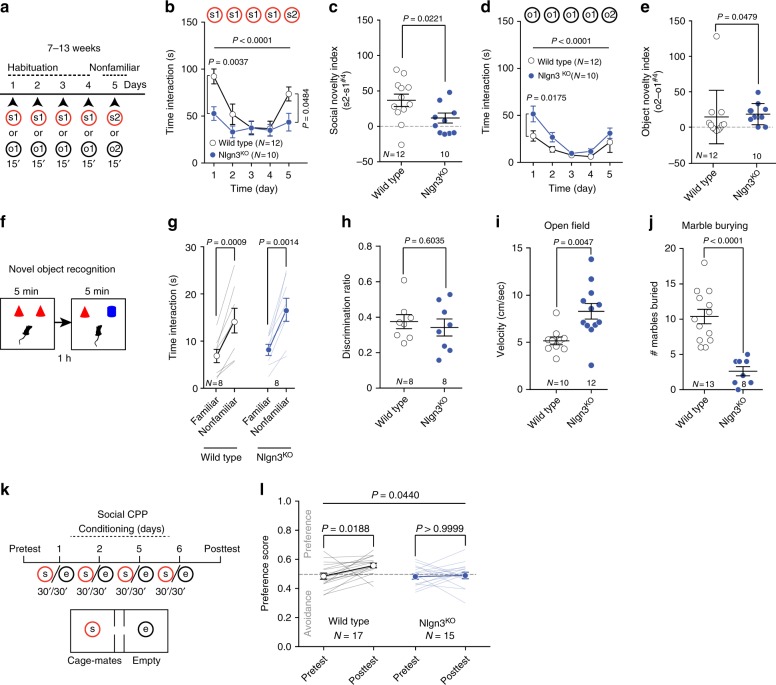
Fig. 4 Global knockdown of Nlgn3 alters sociability and social reward behaviors. a Experimental time-course for the habituation/nonfamiliar exploration task. b Mean social interaction time for wild type (WT) and Nlgn3KO mice. RM two-way ANOVA (time main effect: F(4, 80) = 20.3, P < 0.0001; genotype main effect: F(1, 20) = 3.629, P = 0.0713; time × genotype interaction: F(4, 80) = 6.071, P = 0.0003) followed by Bonferroni’s post hoc test. c Social novelty index of WT and Nlgn3KO mice. Unpaired t test (t(20) = 2.481). d Mean object interaction of WT and Nlgn3KO mice. RM two-way ANOVA (time main effect: F(4, 80) = 17.07, P < 0.0001; genotype main effect: F(1, 20) = 3.858, P = 0.0636; time × genotype interaction: F(4, 80) = 1.715, P = 0.1547) followed by Bonferroni’s post hoc test. e Dot plot of object novelty index for WT and Nlgn3KO mice. Mann–Whitney U = 30. f Schematic of novel object recognition test. g Time spent investigating a novel and a familiar object. Paired t test (WT: t(7) = 5.494. Mean and s.e.m familiar = 6.841 ± 1.41, mean and s.e.m novel = 14.33 ± 2.617. KO: t(7) = 5.12. Mean and s.e.m familiar = 8.115 ± 1.186, mean and s.e.m novel = 16.63 ± 2.441). h Object discrimination ratio for WT and Nlgn3KO mice. Unpaired t test (t(14) = 0.5314). i Mean velocity of WT and Nlgn3KO mice during a 7 min-open field test. Unpaired t test (t(20) = 3.178). j Number of marbles buried for WT and Nlgn3KO mice. Unpaired t test (t(19) = 5.505). (k) Schematics of the social conditioned place preference (CPP) test. l Scatter plot of preference score measured during the Pre- and Post-TEST for WT (mean and s.e.m for Pre-TEST: 0.4846 ± 0.0209; mean and s.e.m for Post-TEST: 0.5578 ± 0.0158), and Nlgn3KO mice (mean and s.e.m for Pre-TEST: 0.4809 ± 0.0178; mean and s.e.m for Post-TEST: 0.4886 ± 0.0225). RM two-way ANOVA (time main effect: F(1, 30) = 4.422, P = 0.0440; genotype main effect: F(1,30) = 3.492, P = 0.0715; time × genotype interaction: F(1,30) = 2.885, P = 0.0998) followed by Bonferroni post hoc test for planned comparisons. N numbers indicate mice. All error bars are s.e.m
Fig. 4 Global knockdown of Nlgn3 alters sociability and social reward behaviors. a Experimental time-course for the habituation/nonfamiliar exploration task. b Mean social interaction time for wild type (WT) and Nlgn3KO mice. RM two-way ANOVA (time main effect: F(4, 80) = 20.3, P < 0.0001; genotype main effect: F(1, 20) = 3.629, P = 0.0713; time × genotype interaction: F(4, 80) = 6.071, P = 0.0003) followed by Bonferroni’s post hoc test. c Social novelty index of WT and Nlgn3KO mice. Unpaired t test (t(20) = 2.481). d Mean object interaction of WT and Nlgn3KO mice. RM two-way ANOVA (time main effect: F(4, 80) = 17.07, P < 0.0001; genotype main effect: F(1, 20) = 3.858, P = 0.0636; time × genotype interaction: F(4, 80) = 1.715, P = 0.1547) followed by Bonferroni’s post hoc test. e Dot plot of object novelty index for WT and Nlgn3KO mice. Mann–Whitney U = 30. f Schematic of novel object recognition test. g Time spent investigating a novel and a familiar object. Paired t test (WT: t(7) = 5.494. Mean and s.e.m familiar = 6.841 ± 1.41, mean and s.e.m novel = 14.33 ± 2.617. KO: t(7) = 5.12. Mean and s.e.m familiar = 8.115 ± 1.186, mean and s.e.m novel = 16.63 ± 2.441). h Object discrimination ratio for WT and Nlgn3KO mice. Unpaired t test (t(14) = 0.5314). i Mean velocity of WT and Nlgn3KO mice during a 7 min-open field test. Unpaired t test (t(20) = 3.178). j Number of marbles buried for WT and Nlgn3KO mice. Unpaired t test (t(19) = 5.505). (k) Schematics of the social conditioned place preference (CPP) test. l Scatter plot of preference score measured during the Pre- and Post-TEST for WT (mean and s.e.m for Pre-TEST: 0.4846 ± 0.0209; mean and s.e.m for Post-TEST: 0.5578 ± 0.0158), and Nlgn3KO mice (mean and s.e.m for Pre-TEST: 0.4809 ± 0.0178; mean and s.e.m for Post-TEST: 0.4886 ± 0.0225). RM two-way ANOVA (time main effect: F(1, 30) = 4.422, P = 0.0440; genotype main effect: F(1,30) = 3.492, P = 0.0715; time × genotype interaction: F(1,30) = 2.885, P = 0.0998) followed by Bonferroni post hoc test for planned comparisons. N numbers indicate mice. All error bars are s.e.mCC BY · PubMed Central
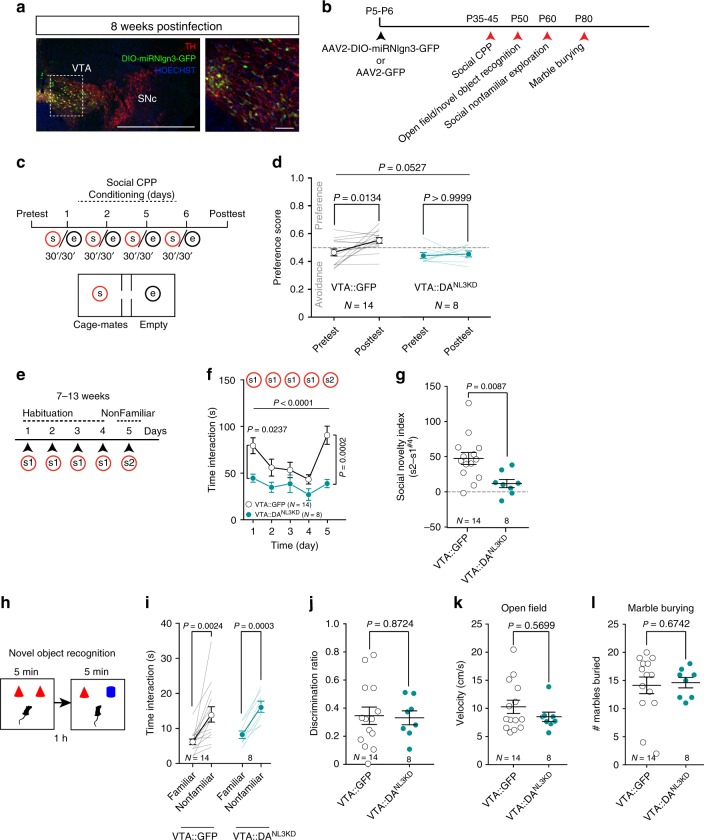
Fig. 5 Nlgn3 in VTA DA neurons is required for social exploration and the reinforcing properties of conspecific interaction. a Left: representative image of coronal slice of VTA and SNc from an AAV2 DIO-miRNlgn3-GFP infected DAT-Cre mouse. Right: higher magnification of VTA. Scale bar: 1 mm and 100 μm. b Experimental schematic of behavioral test order in VTA-injected mice. c Experimental schematic of the social-CPP test. d Scatter plot of preference score measured during the Pre- and Post-TEST for VTA::GFP (mean and s.e.m for pre-TEST = 0.4642 ± 0.0247. Mean and s.e.m post-TEST = 0.5526 ± 0.0200), and VTA::DANL3KD mice (mean and s.e.m for Pre-TEST: 0.4434 ± 0.0218; mean and s.e.m for Post-TEST: 0.4548 ± 0.0214). RM two-way ANOVA (time main effect: F(1, 20) = 4.24, P = 0.0527; virus main effect: F(1,20) = 6.103, P = 0.0226; time × virus interaction: F(1,20) = 2.527, P = 0.1276) followed by Bonferroni post hoc test for planned comparisons. e Experimental schematic of the habituation/nonfamiliar exploration task. f Mean social interaction plotted for VTA::GFP and VTA::DANL3KD mice. RM two-way ANOVA (time main effect: F(4, 80) = 8.058, P < 0.0001, virus main effect: F(1, 20) = 9.164, P = 0.0067; time × virus interaction: F(4, 80) = 3.179, P = 0.0178) followed by Bonferroni’s post hoc test. g Social novelty index for VTA::GFP and VTA::DANL3KD mice. Unpaired t test (t(20) = 2.908). h Experimental schematic of novel object recognition test. i Time spent investigating a novel and a familiar object. Paired t test (VTA::GFP: t(13) = 3.763. Mean and s.e.m familiar = 6.199 ± 0.805, mean and s.e.m novel = 14.03 ± 2.188. VTA::DANL3KD: t(7) = 6.518. Mean familiar = 8.226, s.e.m ± 1.069, mean novel = 16.2, s.e.m ± 1.582). j Discrimination ratio for object discrimination plotted for VTA::GFP and VTA::DANL3KD. Unpaired t test (t(20) = 0.1627). k Mean velocity of VTA::GFP and VTA::DANL3KD mice during a 7 min open field test. Mann–Whitney U = 47. l Number of marbles buried plotted for VTA::GFP and VTA::DANL3KD. Mann–Whitney U = 49.5. N numbers indicate mice. All error bars are s.e.m
Fig. 5 Nlgn3 in VTA DA neurons is required for social exploration and the reinforcing properties of conspecific interaction. a Left: representative image of coronal slice of VTA and SNc from an AAV2 DIO-miRNlgn3-GFP infected DAT-Cre mouse. Right: higher magnification of VTA. Scale bar: 1 mm and 100 μm. b Experimental schematic of behavioral test order in VTA-injected mice. c Experimental schematic of the social-CPP test. d Scatter plot of preference score measured during the Pre- and Post-TEST for VTA::GFP (mean and s.e.m for pre-TEST = 0.4642 ± 0.0247. Mean and s.e.m post-TEST = 0.5526 ± 0.0200), and VTA::DANL3KD mice (mean and s.e.m for Pre-TEST: 0.4434 ± 0.0218; mean and s.e.m for Post-TEST: 0.4548 ± 0.0214). RM two-way ANOVA (time main effect: F(1, 20) = 4.24, P = 0.0527; virus main effect: F(1,20) = 6.103, P = 0.0226; time × virus interaction: F(1,20) = 2.527, P = 0.1276) followed by Bonferroni post hoc test for planned comparisons. e Experimental schematic of the habituation/nonfamiliar exploration task. f Mean social interaction plotted for VTA::GFP and VTA::DANL3KD mice. RM two-way ANOVA (time main effect: F(4, 80) = 8.058, P < 0.0001, virus main effect: F(1, 20) = 9.164, P = 0.0067; time × virus interaction: F(4, 80) = 3.179, P = 0.0178) followed by Bonferroni’s post hoc test. g Social novelty index for VTA::GFP and VTA::DANL3KD mice. Unpaired t test (t(20) = 2.908). h Experimental schematic of novel object recognition test. i Time spent investigating a novel and a familiar object. Paired t test (VTA::GFP: t(13) = 3.763. Mean and s.e.m familiar = 6.199 ± 0.805, mean and s.e.m novel = 14.03 ± 2.188. VTA::DANL3KD: t(7) = 6.518. Mean familiar = 8.226, s.e.m ± 1.069, mean novel = 16.2, s.e.m ± 1.582). j Discrimination ratio for object discrimination plotted for VTA::GFP and VTA::DANL3KD. Unpaired t test (t(20) = 0.1627). k Mean velocity of VTA::GFP and VTA::DANL3KD mice during a 7 min open field test. Mann–Whitney U = 47. l Number of marbles buried plotted for VTA::GFP and VTA::DANL3KD. Mann–Whitney U = 49.5. N numbers indicate mice. All error bars are s.e.mCC BY · PubMed Central
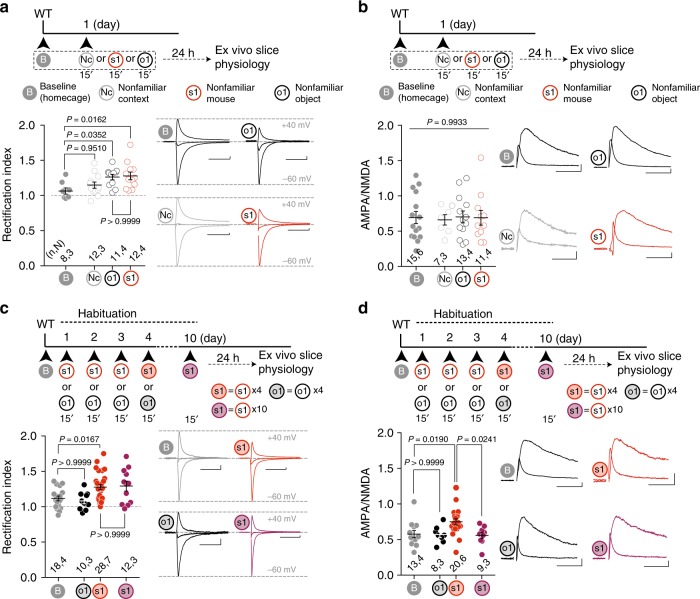
Fig. 6 Novelty-induced synaptic plasticity. a Top: experimental paradigm. Bottom: scatter plot of rectification index and AMPAR-EPSCs example traces (−60, 0, and 40 mV) recorded from VTA DA neurons at baseline (B, homecage), or 24 h after 15 min of novel context (Nc), nonfamiliar conspecific (s1) or novel object (o1) exposure. One-way ANOVA (F(3, 39) = 4.153, P = 0.0120) followed by Bonferroni post hoc test for planned comparisons. b Top: experimental paradigm. Bottom: scatter plot and example traces of AMPA/NMDA ratio recorded from VTA DA neurons at baseline (B, homecage), or 24 h after 15 min of novel context (Nc), nonfamiliar conspecific (s1) or novel object (o1) exposure. One-way ANOVA (F(3, 42) = 0.0287, P = 0.9933). c Top: experimental paradigm. Bottom: scatter plot and example traces of rectification index recorded from VTA DA neurons at baseline (B), 24 h after four repeated exposures to either a novel mouse (s1) or a novel object (o1) and ten repeated exposures to a nonfamiliar conspecific (s1, bold purple). One-way ANOVA (F(3, 64) = 5.149, P = 0.0030) followed by Bonferroni post hoc test for planned multiple comparisons. d Top: experimental paradigm. Bottom: scatter plot and example traces of AMPA/NMDA ratio recorded from VTA DA neurons at baseline (b), 24 h after four repeated exposures to either a nonfamiliar conspecific (s1) or a novel object (o1) and ten repeated exposures to a nonfamiliar conspecific (s1, bold purple). One-way ANOVA (F(3,46) = 4.4939, P = 0.0076) followed by Bonferroni post hoc test for planned multiple comparisons. n,N indicates number of cells and mice respectively. Scale bars: 20 msec, 20 pA. Error bars report s.e.m
Fig. 6 Novelty-induced synaptic plasticity. a Top: experimental paradigm. Bottom: scatter plot of rectification index and AMPAR-EPSCs example traces (−60, 0, and 40 mV) recorded from VTA DA neurons at baseline (B, homecage), or 24 h after 15 min of novel context (Nc), nonfamiliar conspecific (s1) or novel object (o1) exposure. One-way ANOVA (F(3, 39) = 4.153, P = 0.0120) followed by Bonferroni post hoc test for planned comparisons. b Top: experimental paradigm. Bottom: scatter plot and example traces of AMPA/NMDA ratio recorded from VTA DA neurons at baseline (B, homecage), or 24 h after 15 min of novel context (Nc), nonfamiliar conspecific (s1) or novel object (o1) exposure. One-way ANOVA (F(3, 42) = 0.0287, P = 0.9933). c Top: experimental paradigm. Bottom: scatter plot and example traces of rectification index recorded from VTA DA neurons at baseline (B), 24 h after four repeated exposures to either a novel mouse (s1) or a novel object (o1) and ten repeated exposures to a nonfamiliar conspecific (s1, bold purple). One-way ANOVA (F(3, 64) = 5.149, P = 0.0030) followed by Bonferroni post hoc test for planned multiple comparisons. d Top: experimental paradigm. Bottom: scatter plot and example traces of AMPA/NMDA ratio recorded from VTA DA neurons at baseline (b), 24 h after four repeated exposures to either a nonfamiliar conspecific (s1) or a novel object (o1) and ten repeated exposures to a nonfamiliar conspecific (s1, bold purple). One-way ANOVA (F(3,46) = 4.4939, P = 0.0076) followed by Bonferroni post hoc test for planned multiple comparisons. n,N indicates number of cells and mice respectively. Scale bars: 20 msec, 20 pA. Error bars report s.e.mCC BY · PubMed Central
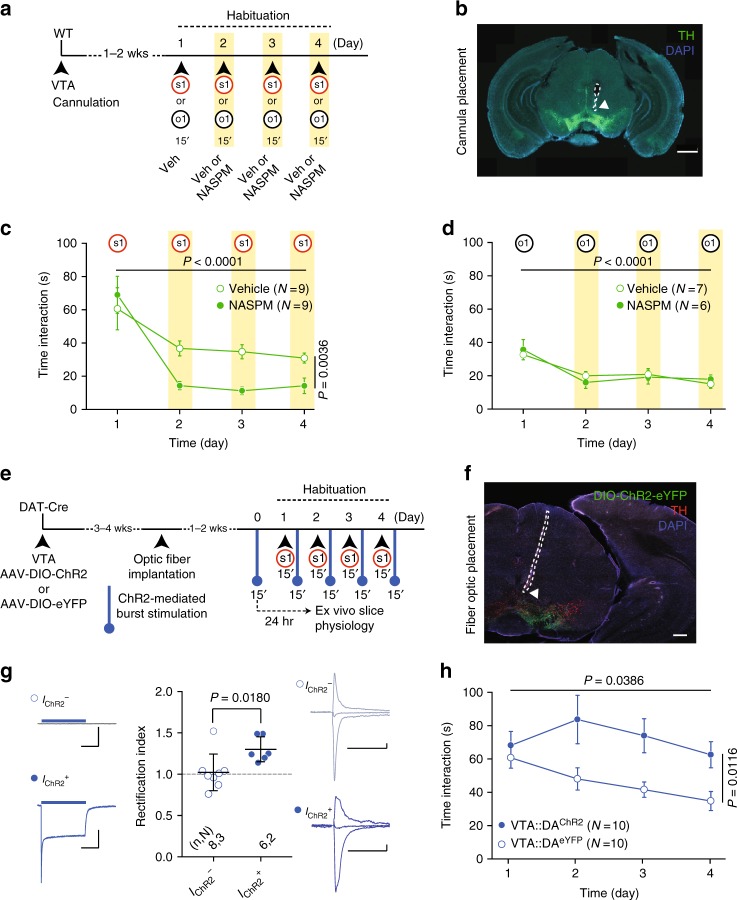
Fig. 7 GluA2-lacking AMPAR function controls habituation to nonfamiliar conspecific. a Schema of the experimental paradigm. b Representative image of cannula placement for NASPM or vehicle infusion (green: TH; blue: DAPI; white arrow indicates cannula tip). c Time course of time interaction with a nonfamiliar conspecific (s1) for vehicle or NASPM infused mice at day 2, day 3, and day 4. RM two-way ANOVA (time main effect: F(3, 24) = 17.57, P < 0.0001; drug main effect: F(1, 8) = 16.48, P = 0.0036; time × drug interaction: F(3, 24) = 3.141, P = 0.0439). d Time course of time interaction with a novel object (o1) over 4 days for Vehicle and NASPM groups. RM two-way ANOVA (time main effect: F(3, 33) = 24.71, P < 0.0001; drug main effect: F(1,11) = 0.00005, P = 0.9942; time × drug interaction: F(3, 33) = 1.109, P = 0.3595). e Experimental paradigm for noncontingent optogenetic stimulation. f Representative image of optic fiber placement for DIO-ChR2 expressing mice (red: TH, green: AAV-DIO-ChR2-eYFP, blue: DAPI; white arrow indicates fiber optic tip). g Left: example traces of a photocurrent negative (IChR2−) and a photocurrent positive (IChR2+) VTA DA neuron. Scale bars: 20 msec, 1 nA. Middle: scatter plot of RI recorded from photocurrent negative (IChR−) and photocurrent positive (IChR2+) VTA DA neurons and AMPAR-EPSCs example traces (−60, 0, and 40 mV) recorded from VTA DA neurons. Mann−Whitney test (U = 6). Scale bars: 20 msec, 20 pA. h Time course over 4 days of time interaction with a nonfamiliar conspecific (s1) for VTA::DAChR2 and VTA::DAeYFP mice with noncontingent optical stimulation. RM two-way ANOVA (time main effect: F(3, 18) = 2.9966, P = 0.0386; virus main effect: F(1, 18) = 7.9034, P = 0.0116; time × virus interaction: F(3, 18) = 1.9532, P = 0.1320). N indicates number of mice. Error bars represent s.e.m
Fig. 7 GluA2-lacking AMPAR function controls habituation to nonfamiliar conspecific. a Schema of the experimental paradigm. b Representative image of cannula placement for NASPM or vehicle infusion (green: TH; blue: DAPI; white arrow indicates cannula tip). c Time course of time interaction with a nonfamiliar conspecific (s1) for vehicle or NASPM infused mice at day 2, day 3, and day 4. RM two-way ANOVA (time main effect: F(3, 24) = 17.57, P < 0.0001; drug main effect: F(1, 8) = 16.48, P = 0.0036; time × drug interaction: F(3, 24) = 3.141, P = 0.0439). d Time course of time interaction with a novel object (o1) over 4 days for Vehicle and NASPM groups. RM two-way ANOVA (time main effect: F(3, 33) = 24.71, P < 0.0001; drug main effect: F(1,11) = 0.00005, P = 0.9942; time × drug interaction: F(3, 33) = 1.109, P = 0.3595). e Experimental paradigm for noncontingent optogenetic stimulation. f Representative image of optic fiber placement for DIO-ChR2 expressing mice (red: TH, green: AAV-DIO-ChR2-eYFP, blue: DAPI; white arrow indicates fiber optic tip). g Left: example traces of a photocurrent negative (IChR2−) and a photocurrent positive (IChR2+) VTA DA neuron. Scale bars: 20 msec, 1 nA. Middle: scatter plot of RI recorded from photocurrent negative (IChR−) and photocurrent positive (IChR2+) VTA DA neurons and AMPAR-EPSCs example traces (−60, 0, and 40 mV) recorded from VTA DA neurons. Mann−Whitney test (U = 6). Scale bars: 20 msec, 20 pA. h Time course over 4 days of time interaction with a nonfamiliar conspecific (s1) for VTA::DAChR2 and VTA::DAeYFP mice with noncontingent optical stimulation. RM two-way ANOVA (time main effect: F(3, 18) = 2.9966, P = 0.0386; virus main effect: F(1, 18) = 7.9034, P = 0.0116; time × virus interaction: F(3, 18) = 1.9532, P = 0.1320). N indicates number of mice. Error bars represent s.e.mCC BY · PubMed Central
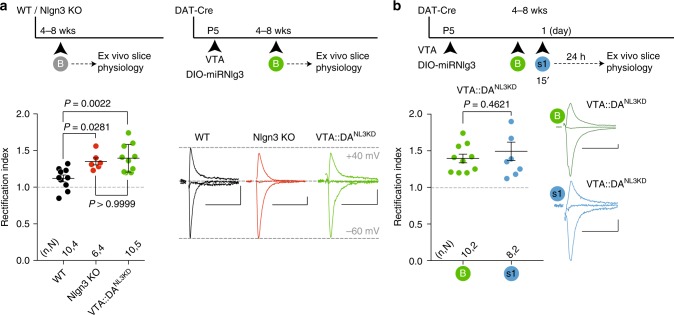
Fig. 8 Aberrant increase of GluA2-lacking AMPARs in Nlgn3-deficient VTA DA neurons. a Top: experimental paradigm. Bottom: scatter plot of rectification index and example traces of AMPAR-EPSCs (−60, 0, and 40 mV) measured from adolescent WT, Nlgn3KO and VTA::DANL3KD. One-way ANOVA (F(2, 23) = 8.363, P = 0.0019) followed by Bonferroni post hoc test. b Top: experimental paradigm. Bottom: scatter plot of rectification index and example traces of AMPAR-EPSCs (−60, 0, and 40 mV) measured from VTA::DANLKD mice at baseline (B) or 24 h after 15 min exposure to a nonfamiliar conspecific (s1). Unpaired t test (t(16) = 0.7536). n, N indicates number of cells and mice respectively. Scale bars: 20 msec, 20 pA. Error bars represent s.e.m
Fig. 8 Aberrant increase of GluA2-lacking AMPARs in Nlgn3-deficient VTA DA neurons. a Top: experimental paradigm. Bottom: scatter plot of rectification index and example traces of AMPAR-EPSCs (−60, 0, and 40 mV) measured from adolescent WT, Nlgn3KO and VTA::DANL3KD. One-way ANOVA (F(2, 23) = 8.363, P = 0.0019) followed by Bonferroni post hoc test. b Top: experimental paradigm. Bottom: scatter plot of rectification index and example traces of AMPAR-EPSCs (−60, 0, and 40 mV) measured from VTA::DANLKD mice at baseline (B) or 24 h after 15 min exposure to a nonfamiliar conspecific (s1). Unpaired t test (t(16) = 0.7536). n, N indicates number of cells and mice respectively. Scale bars: 20 msec, 20 pA. Error bars represent s.e.mCC BY · PubMed Central

Verification

Claims the paper makes

The claims and statistics of this paper haven’t been checked yet.

Run the check — free, no account needed. It reads the open-access text and checks the sources it cites.

A few free checks a day · papers already verified open instantly · results are public

Claims other papers make about this one

Each is checked against this paper’s own text: does it say what the citing paper says it does?

Self-check

Percentages, sums and reported differences re-computed from the paper’s own numbers.

The self-check needs the paper’s full text.

Citations

Cites

Show all 94 references

Cited by

Sorted by citations

See all 171

Metadata

Authors
Bariselli, S., Hörnberg, H., Prévost-Solié, C., Musardo, S., Hatstatt-Burklé, L., Scheiffele, P., & Bellone, C.
Affiliations
  • University of Geneva (CH)
  • University of Basel (CH)
Corresponding author
Bellone, Camilla
Venue
Nature Communications
Published
2018-08-09
Volume
9
Issue
1
Pages
3173-3173
ISSN
2041-1723 (ISSN-L)
OpenAlex
W2886986075
Cited by
171
References
94
Citations by year
2026: 12 · 2025: 20 · 2024: 27 · 2023: 27 · 2022: 31 · 2021: 23 · 2020: 18 · 2019: 9 · 2018: 3
FWCI
6.04
Type
journal article
Language
en
Open access
Locations
  • Nature Communications (publishedVersion, cc-by)
  • bioRxiv (Cold Spring Harbor Laboratory) (acceptedVersion)
  • Europe PMC (PubMed Central) (publishedVersion, cc-by)
  • PubMed Central (publishedVersion, cc-by)
  • PubMed (publishedVersion)
  • Archive ouverte UNIGE (University of Geneva) (publishedVersion, other-oa)
  • MDC Repository (Max-Delbrueck-Center for Molecular Medicine) (acceptedVersion)
  • RePEc: Research Papers in Economics (submittedVersion)
  • DOAJ (DOAJ: Directory of Open Access Journals) (submittedVersion, cc-by-sa)
  • DOAJ (DOAJ: Directory of Open Access Journals) (submittedVersion)
  • edoc (University of Basel) (submittedVersion)
  • Archive ouverte UNIGE (University of Geneva) (submittedVersion, cc-by)
Funders
  • National Science Foundation
  • Schweizerischer Nationalfonds zur Förderung der Wissenschaftlichen Forschung (150704)
  • Fondation Pierre Mercier
Topics
  • Life Sciences › Neuroscience › Cellular and Molecular Neuroscience › Neuroscience and Neuropharmacology Research
  • Life Sciences › Neuroscience › Cognitive Neuroscience › Autism Spectrum Disorder Research
  • Life Sciences › Neuroscience › Cellular and Molecular Neuroscience › Neurotransmitter Receptor Influence on Behavior
Keywords
ventral tegmental area, dopaminergic neurons, neuroligin-3, autism spectrum disorder, sociability, habituation, synaptic plasticity, chemogenetic inhibition, social reinforcement, synaptic adhesion molecules
MeSH terms
Animals, Behavior, Animal, Female, Male, Membrane Proteins, Mice, Inbred C57BL, Mice, Transgenic, Nerve Tissue Proteins, Neuronal Plasticity, Neurons, Social Behavior, Synapses, Cell Adhesion Molecules, Neuronal, Ventral Tegmental Area, Receptors, AMPA, Mice, Dopaminergic Neurons

About these checks

Registry, retraction, Cites and statistics results are computed, not judged, with one exception: a printed reference that no index lists is read once by a model before it counts as a citation error. Claims are extracted by a model and kept only when their quote appears verbatim in the text; each cited source is then checked, with a model’s help, for whether it says what the claim relies on. Those verdicts can be wrong — read the claim’s quote and the cited source before relying on one.

Statistics and arithmetic are recomputed, not judged.

Confidence bands are shown only for fields calibrated on our annotated test set. None is calibrated yet, so no band is shown.

What counts as a claim ›How we measure confidence ›How we check this ›

Are you an author, or do you see a problem with this page? Request a review