

The DOI matches its Crossref record; 45 of the 45 references it cites were found in a registry or an index.
Conditional control of fluorescent protein degradation by an auxin-dependent nanobody
Open accessPublished version of a preprint
Abstract
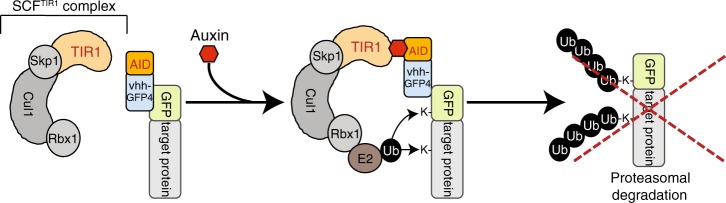
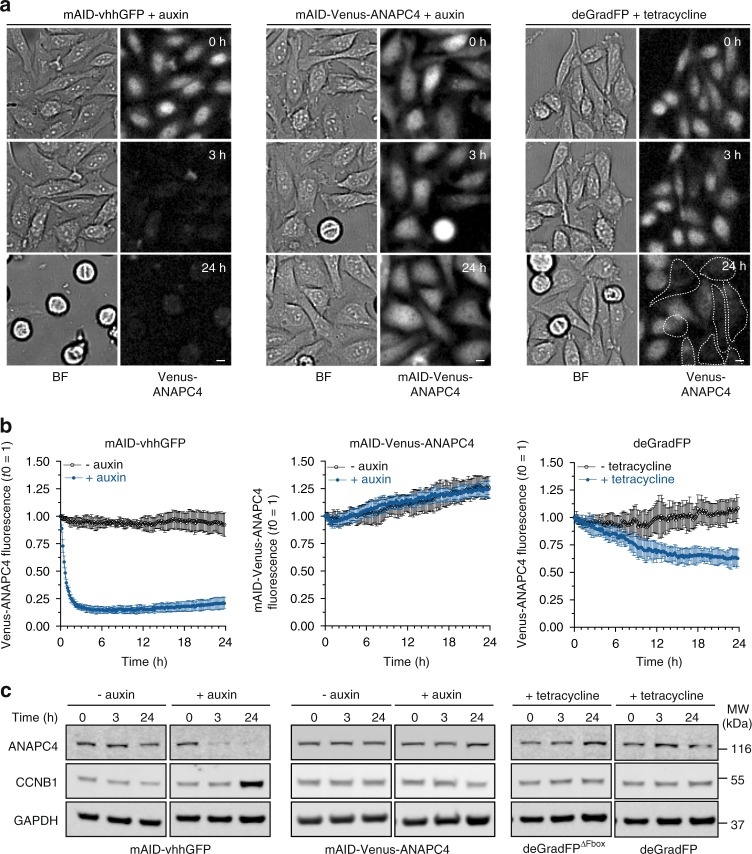
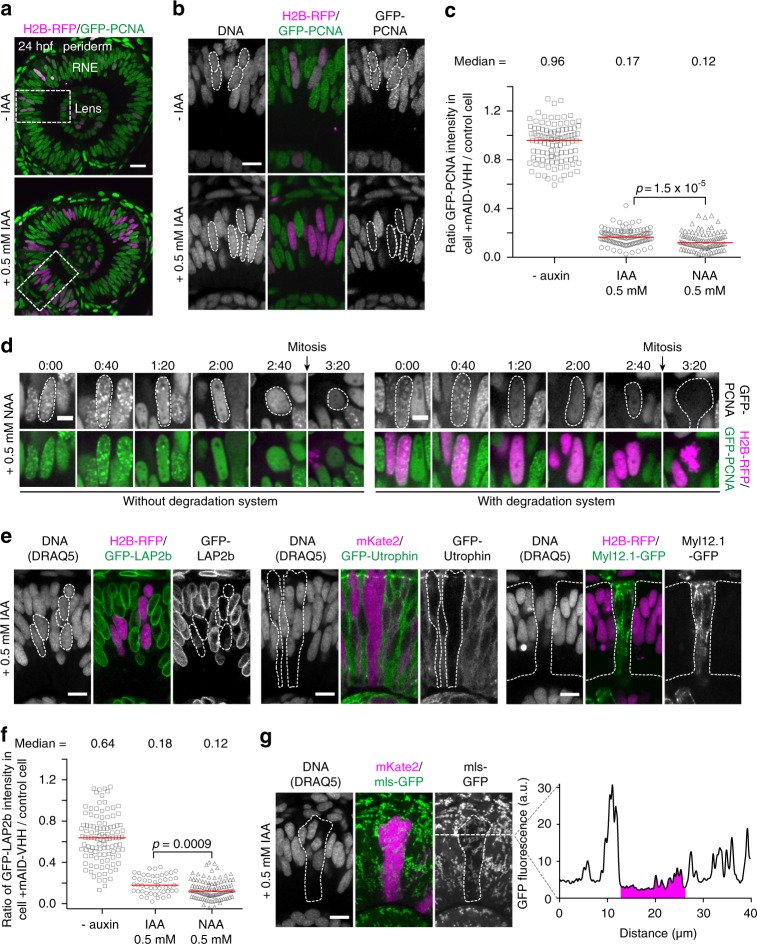
The conditional and reversible depletion of proteins by auxin-mediated degradation is a powerful tool to investigate protein functions in cells and whole organisms. However, its wider applications require fusing the auxin-inducible degron (AID) to individual target proteins. Thus, establishing the auxin system for multiple proteins can be challenging. Another approach for directed protein degradation are anti-GFP nanobodies, which can be applied to GFP stock collections that are readily available in different experimental models. Here, we combine the advantages of auxin and nanobody-based degradation technologies creating an AID-nanobody to degrade GFP-tagged proteins at different cellular structures in a conditional and reversible manner in human cells. We demonstrate efficient and reversible inactivation of the anaphase promoting complex/cyclosome (APC/C) and thus provide new means to study the functions of this essential ubiquitin E3 ligase. Further, we establish auxin degradation in a vertebrate model organism by employing AID-nanobodies in zebrafish.
Overview
The claims and statistics of this paper haven’t been checked yet.
Run the check — free, no account needed. It reads the open-access text and checks the sources it cites.
Integrity signals
Registry
Cites
Statistics
Figures
Verification
Claims the paper makes
The claims and statistics of this paper haven’t been checked yet.
Run the check — free, no account needed. It reads the open-access text and checks the sources it cites.
Claims other papers make about this one
Each is checked against this paper’s own text: does it say what the citing paper says it does?
In the citing paper
“In this case, endogenously GFP-tagged proteins in both human cells and zebrafish could be degraded in an auxin-inducible manner, when co-expressing the AID–anti-GFP nanobody fusion as well as TIR1 [29].”
From Advances in targeted degradation of endogenous proteins (2019) · cites this paper as [29]
Self-check
Percentages, sums and reported differences re-computed from the paper’s own numbers.
The self-check needs the paper’s full text.
Citations
Cites
Fiji: an open-source platform for biological-image analysis
Schindelin, J., Arganda-Carreras, I., Frise, E., Kaynig, V., Longair, M., Pietzsch, T., Preibisch, S., Rueden, C., Saalfeld, S., Schmid, B., et al. (2012) · Nature Methods · doi:10.1038/nmeth.2019 · Cited by 66,890
Sakamoto, K. M., Kim, K. B., Kumagai, A., Mercurio, F., Crews, C. M., & Deshaies, R. J. (2001) · Proceedings of the National Academy of Sciences · doi:10.1073/pnas.141230798 · Cited by 2,609
The Tol2kit: A multisite gateway‐based construction kit for Tol2 transposon transgenesis constructs
Kwan, K. M., Fujimoto, E., Grabher, C., Mangum, B. D., Hardy, M., Campbell, D. S., Parant, J. M., Yost, H. J., Kanki, J. P., & Chien, C.-B. (2007) · Developmental Dynamics · doi:10.1002/dvdy.21343 · Cited by 1,768
An auxin-based degron system for the rapid depletion of proteins in nonplant cells
Nishimura, K., Fukagawa, T., Takisawa, H., Kakimoto, T., & Kanemaki, M. (2009) · Nature Methods · doi:10.1038/nmeth.1401 · Cited by 1,663
Morin, X., Daneman, R., Zavortink, M., & Chia, W. N. (2001) · Proceedings of the National Academy of Sciences · doi:10.1073/pnas.261408198 · Cited by 775
Targeting and tracing antigens in live cells with fluorescent nanobodies
Rothbauer, U., Zolghadr, K., Tillib, S. V., Nowak, D., Schermelleh, L., Gahl, A., Backmann, N., Conrath, K., Muyldermans, S., Cardoso, M. C., et al. (2006) · Nature Methods · doi:10.1038/nmeth953 · Cited by 715
Rapid protein depletion in human cells by auxin-inducible degron tagging with short homology donors
Natsume, T., Kiyomitsu, T., Saga, Y., & Kanemaki, M. T. (2016) · Cell Reports · doi:10.1016/j.celrep.2016.03.001 · Cited by 673
Aurora B-Mediated Abscission Checkpoint Protects against Tetraploidization
Steigemann, P., Wurzenberger, C., Schmitz, M. H. A., Held, M., Guizetti, J., Maar, S., & Gerlich, D. W. (2009) · Cell · doi:10.1016/j.cell.2008.12.020 · Cited by 638
Adhesion Functions in Cell Sorting by Mechanically Coupling the Cortices of Adhering Cells
Maître, J., Berthoumieux, H., Krens, G., Salbreux, G., Jülicher, F., Paluch, E. K., & Heisenberg, C. (2012) · Science · doi:10.1126/science.1225399 · Cited by 624
BAC TransgeneOmics: a high-throughput method for exploration of protein function in mammals
Poser, I., Sarov, M., Hutchins, J. R. A., Hèriché, J.-K., Toyoda, Y., Pozniakovsky, A., Weigl, D., Nitzsche, A., Hegemann, B., Bird, A. W., et al. (2008) · Nature Methods · doi:10.1038/nmeth.1199 · Cited by 605
Cited by
Sorted by citations
Yesbolatova, A., Saito, Y., Kitamoto, N., Makino‐Itou, H., Ajima, R., Nakano, R., Nakaoka, H., Fukui, K., Gamo, K., Tominari, Y., et al. (2020) · Nature Communications · doi:10.1038/s41467-020-19532-z · Cited by 544
Prey for the Proteasome: Targeted Protein Degradation—A Medicinal Chemist's Perspective
Luh, L. M., Scheib, U., Juenemann, K., Wortmann, L., Brands, M., & Cromm, P. M. (2020) · Angewandte Chemie International Edition · doi:10.1002/anie.202004310 · Cited by 201
Electric Fano resonance-based terahertz metasensors
Wang, R., Xu, L., Wang, J., Sun, L., Jiao, Y., Meng, Y., Chen, S., Chang, C., & Fan, C. (2021) · Nanoscale · doi:10.1039/d1nr04477j · Cited by 191
Azo-PROTAC: Novel Light-Controlled Small-Molecule Tool for Protein Knockdown
Jin, Y., Lu, M., Wang, Y., Shan, W.-X., Wang, X.-Y., You, Q., & Jiang, Z. (2020) · Journal of Medicinal Chemistry · doi:10.1021/acs.jmedchem.9b02058 · Cited by 189
Harnessing the Power of Proteolysis for Targeted Protein Inactivation
Verma, R., Mohl, D., & Deshaies, R. J. (2020) · Molecular Cell · doi:10.1016/j.molcel.2020.01.010 · Cited by 185
An efficient auxin-inducible degron system with low basal degradation in human cells
Li, S., Prasanna, X., Salo, V. T., Vattulainen, I., & Ikonen, E. (2019) · Nature Methods · doi:10.1038/s41592-019-0512-x · Cited by 191
An expanded auxin-inducible degron toolkit for Caenorhabditis elegans
Ashley, G. E., Duong, T., Levenson, M. T., Martinez, M. A. Q., Johnson, L. C., Hibshman, J. D., Saeger, H. N., Palmisano, N. J., Doonan, R., Martínez-Méndez, R., et al. (2021) · Genetics · doi:10.1093/genetics/iyab006 · Cited by 156
The Caenorhabditis elegans Transgenic Toolbox
Nance, J., & Frøkjær‐Jensen, C. (2019) · Genetics · doi:10.1534/genetics.119.301506 · Cited by 142
Yesbolatova, A., Natsume, T., Hayashi, K., & Kanemaki, M. T. (2019) · Methods · doi:10.1016/j.ymeth.2019.04.010 · Cited by 122
An overview of polymeric nanomicelles in clinical trials and on the market
Zheng, X., Xie, J., Zhang, X., Sun, W., Zhao, H., Li, Y., & Wang, C. (2020) · Chinese Chemical Letters · doi:10.1016/j.cclet.2020.11.029 · Cited by 112
Transgenic fluorescent zebrafish lines that have revolutionized biomedical research
Choe, C. P., Choi, S., Kee, Y., Kim, J. M., Kim, S.-H., Lee, Y., Park, H., & Ro, H. (2021) · Laboratory Animal Research · doi:10.1186/s42826-021-00103-2 · Cited by 104
Advances in targeted degradation of endogenous proteins
Röth, S., Fulcher, L. J., & Sapkota, G. P. (2019) · Cellular and Molecular Life Sciences · doi:10.1007/s00018-019-03112-6 · Cited by 92
Exploring cellular biochemistry with nanobodies
Cheloha, R. W., Harmand, T. J., Wijne, C., Schwartz, T., & Ploegh, H. L. (2020) · Journal of Biological Chemistry · doi:10.1074/jbc.rev120.012960 · Cited by 98
Super-resolved live-cell imaging using random illumination microscopy
Mangeat, T., Labouesse, S., Allain, M., Negash, A., Martin, E., Guénolé, A., Poincloux, R., Estibal, C., Bouissou, A., Cantaloube, S., et al. (2021) · Cell Reports Methods · doi:10.1016/j.crmeth.2021.100009 · Cited by 92
Using Ubiquitin Binders to Decipher the Ubiquitin Code
Mattern, M. R., Sutherland, J. D., Kadimisetty, K., Barrio, R., & Rodríguez, M. S. (2019) · Trends in Biochemical Sciences · doi:10.1016/j.tibs.2019.01.011 · Cited by 80
Silicon‐Nanotube‐Mediated Intracellular Delivery Enables Ex Vivo Gene Editing
Chen, Y., Aslanoglou, S., Murayama, T., Gervinskas, G., FitzGerald, L. I., Sriram, S., Tian, J. M., Johnston, A. P. R., Morikawa, Y., Suu, K., et al. (2020) · Advanced Materials · doi:10.1002/adma.202000036 · Cited by 78
Chan, A., Haley, R. M., Najar, M. A., Gonzalez-Martinez, D., Bugaj, L. J., Burslem, G. M., Mitchell, M. J., & Tsourkas, A. (2024) · Nature Communications · doi:10.1038/s41467-024-50235-x · Cited by 72
Rapid Degradation ofCaenorhabditis elegansProteins at Single-Cell Resolution with a Synthetic Auxin
Martinez, M. A. Q., Kinney, B. A., Medwig-Kinney, T. N., Ashley, G. E., Ragle, J. M., Johnson, L. C., Aguilera, J., Hammell, C. M., Ward, J. D., & Matus, D. Q. (2019) · G3 Genes Genomes Genetics · doi:10.1534/g3.119.400781 · Cited by 69
Zhang, Z., Wang, Y., Ding, Y., & Hattori, M. (2020) · Scientific Reports · doi:10.1038/s41598-020-62606-7 · Cited by 70
Simpson, L. M., Macartney, T., Nardin, A., Fulcher, L. J., Röth, S., Testa, A., Maniaci, C., Ciulli, A., Ganley, I. G., & Sapkota, G. P. (2020) · Cell chemical biology · doi:10.1016/j.chembiol.2020.06.013 · Cited by 71
A super-sensitive auxin-inducible degron system with an engineered auxin-TIR1 pair
Nishimura, K., Yamada, R., Hagihara, S., Iwasaki, R., Uchida, N., Kamura, T., Takahashi, K. U., Torii, K. U., & Fukagawa, T. (2020) · Nucleic Acids Research · doi:10.1093/nar/gkaa748 · Cited by 68
Genetically encoded multimeric tags for subcellular protein localization in cryo-EM
Fung, H. K. H., Hayashi, Y., Salo, V. T., Babenko, A., Zagoriy, I., Brunner, A. H., Ellenberg, J., Müller, C. W., Cuylen‐Haering, S., & Mahamid, J. (2023) · Nature Methods · doi:10.1038/s41592-023-02053-0 · Cited by 71
zGrad is a nanobody-based degron system that inactivates proteins in zebrafish
Yamaguchi, N., Colak-Champollion, T., & Knaut, H. (2019) · eLife · doi:10.7554/elife.43125 · Cited by 64
Reisser, M., Palmer, A., Popp, A. P., Jahn, C., Weidinger, G., & Gebhardt, J. C. M. (2018) · Nature Communications · doi:10.1038/s41467-018-07731-8 · Cited by 60
Knock-in tagging in zebrafish facilitated by insertion into non-coding regions
Levic, D. S., Yamaguchi, N., Wang, S., Knaut, H., & Bagnat, M. (2021) · Development · doi:10.1242/dev.199994 · Cited by 53
Tunable light and drug induced depletion of target proteins
Deng, W., Bates, J. A., Wei, H., Bartoschek, M. D., Conradt, B., & Leonhardt, H. (2020) · Nature Communications · doi:10.1038/s41467-019-14160-8 · Cited by 50
Mandipropamid as a chemical inducer of proximity for in vivo applications
Ziegler, M. J., Yserentant, K., Dunsing, V., Middel, V., Gralak, A. J., Pakari, K., Bargstedt, J., Kern, C., Petrich, A., Chiantia, S., et al. (2021) · Nature Chemical Biology · doi:10.1038/s41589-021-00922-3 · Cited by 44
Wagner, T. R., & Rothbauer, U. (2020) · Biomolecules · doi:10.3390/biom10121701 · Cited by 42
Applications of nanobodies in plant science and biotechnology
Wang, W., Yuan, J., & Jiang, C. (2020) · Plant Molecular Biology · doi:10.1007/s11103-020-01082-z · Cited by 43
Zhang, C., Ötjengerdes, R., Roewe, J., Mejı́as, R., & Marschall, A. L. J. (2020) · BioDrugs · doi:10.1007/s40259-020-00419-w · Cited by 44
Bakos, G., Yu, L., Gak, I. A., Roumeliotis, T. I., Liakopoulos, D., Choudhary, J. S., & Mansfeld, J. (2018) · Nature Communications · doi:10.1038/s41467-018-07251-5 · Cited by 39
Self-citationRational structural design of aromatic Azo photoactive small molecules for biomedical applications
Ding, J., Huang, Z. H., Zhang, D., Qu, Y., Zhang, S., Zhang, C., Fang, B., Li, L., & Huang, W. (2025) · Chemical Society Reviews · doi:10.1039/d5cs00334b · Cited by 38
Ultra-compact broadband terahertz spectroscopy sensor enabled by resonant-gradient metasurface
Wang, R., Zhang, D., Chen, L., Zhang, N., Li, D., Jiang, R., Zhang, X., Yang, X., Zhang, L., Wang, S., et al. (2025) · Nature Communications · doi:10.1038/s41467-025-66310-w · Cited by 37
Ligand-induced genetic degradation as a tool for target validation
Yesbolatova, A., Tominari, Y., & Kanemaki, M. T. (2018) · Drug Discovery Today Technologies · doi:10.1016/j.ddtec.2018.11.001 · Cited by 35
Synthetic Control of Protein Degradation during Cell Proliferation and Developmental Processes
Trauth, J., Scheffer, J., Hasenjäger, S., & Taxis, C. (2019) · ACS Omega · doi:10.1021/acsomega.8b03011 · Cited by 34
Ligand-induced degrons for studying nuclear functions
Kanemaki, M. T. (2022) · Current Opinion in Cell Biology · doi:10.1016/j.ceb.2021.12.006 · Cited by 35
Sun, X., Zhou, C., Xia, S., & Chen, X. (2023) · Nature Communications · doi:10.1038/s41467-023-37237-x · Cited by 32
30 years of nanobodies – an ongoing success story of small binders in biological research
Frecot, D. I., Fröhlich, T., & Rothbauer, U. (2023) · Journal of Cell Science · doi:10.1242/jcs.261395 · Cited by 31
Transforming nanobodies into high-precision tools for protein function analysis
Gettemans, J., & Dobbelaer, B. D. (2020) · American Journal of Physiology-Cell Physiology · doi:10.1152/ajpcell.00435.2020 · Cited by 29
Nanobodies – Little helpers unravelling intracellular signaling
Wagner, T. R., & Rothbauer, U. (2021) · Free Radical Biology and Medicine · doi:10.1016/j.freeradbiomed.2021.09.005 · Cited by 29
Using Nanobodies to Study Protein Function in Developing Organisms
Aguilar, G., Matsuda, S., Viganò, M., & Affolter, M. (2019) · Antibodies · doi:10.3390/antib8010016 · Cited by 27
Auxin-Inducible Degron System: An Efficient Protein Degradation Tool to Study Protein Function
Phanindhar, K., & Mishra, R. K. (2023) · BioTechniques · doi:10.2144/btn-2022-0108 · Cited by 30
Degron-Based bioPROTACs for Controlling Signaling in CAR T Cells
Kim, M. S., Bhargava, H. K., Shavey, G. E., Lim, W. A., El‐Samad, H., & Ng, A. H. (2024) · ACS Synthetic Biology · doi:10.1021/acssynbio.4c00109 · Cited by 23
Monobodies as tool biologics for accelerating target validation and druggable site discovery
Akkapeddi, P., Teng, K. W., & Koide, S. (2021) · RSC Medicinal Chemistry · doi:10.1039/d1md00188d · Cited by 24
Rapid depletion of target proteins in plants by an inducible protein degradation system
Huang, L., & Rojas‐Pierce, M. (2024) · The Plant Cell · doi:10.1093/plcell/koae072 · Cited by 23
Rega, C., Tsitsa, I., Roumeliotis, T. I., Krystkowiak, I., Portillo, M. G., Yu, L., Vorhauser, J., Pines, J., Mansfeld, J., Choudhary, J. S., et al. (2025) · Nature Communications · doi:10.1038/s41467-025-57537-8 · Cited by 22
Self-citationBeer, K. B., Fazeli, G., Judasová, K., Irmisch, L., Causemann, J., Mansfeld, J., & Wehman, A. M. (2019) · Nature Communications · doi:10.1038/s41467-019-11442-z · Cited by 23
Self-citationCamlin, N. J., & Evans, J. P. (2019) · Biology of Reproduction · doi:10.1093/biolre/ioz113 · Cited by 21
Unintended perturbation of protein function using GFP nanobodies in human cells
Küey, C., Larocque, G., Clarke, N. I., & Royle, S. (2019) · Journal of Cell Science · doi:10.1242/jcs.234955 · Cited by 21
Chromatin dynamics at the maternal to zygotic transition: recent advances from the zebrafish model
Akdogan‐Ozdilek, B., Duval, K. L., & Goll, M. G. (2020) · F1000Research · doi:10.12688/f1000research.21809.1 · Cited by 21
Research trends in the use of nanobodies for cancer therapy
Hou, J., Du, K., Li, J., Li, Z., Cao, S., Zhang, S., Huang, W., Liu, H., Yang, X., Sun, S., et al. (2025) · Journal of Controlled Release · doi:10.1016/j.jconrel.2025.01.045 · Cited by 18
Reflections on the use of protein binders to study protein function in developmental biology
Aguilar, G., Viganò, M., Affolter, M., & Matsuda, S. (2019) · Wiley Interdisciplinary Reviews Developmental Biology · doi:10.1002/wdev.356 · Cited by 17
Kenny-Ganzert, I. W., & Sherwood, D. R. (2023) · Seminars in Cell and Developmental Biology · doi:10.1016/j.semcdb.2023.07.002 · Cited by 17
Control of cardiac contractions using Cre-lox and degron strategies in zebrafish
Juan, T., Bellec, M., Cardoso, B., Athéa, H., Fukuda, N., Albu, M., Günther, S., Looso, M., & Stainier, D. Y. R. (2024) · Proceedings of the National Academy of Sciences · doi:10.1073/pnas.2309842121 · Cited by 16
ZC3HC1 is a structural element of the nuclear basket effecting interlinkage of TPR polypeptides
Gunkel, P., & Cordes, V. C. (2022) · Molecular Biology of the Cell · doi:10.1091/mbc.e22-02-0037 · Cited by 18
UFMylation regulates translational homeostasis and cell cycle progressionPreprint
Gak, I. A., Vasiljević, D., Zerjatke, T., Yu, L., Brosch, M., Roumeliotis, T. I., Horenburg, C., Klemm, N., Bakos, G., Herrmann, A., et al. (2020) · bioRxiv (Cold Spring Harbor Laboratory) · doi:10.1101/2020.02.03.931196 · Cited by 15
Self-citationAuxin confers protection against ER stress in Caenorhabditis elegans
Bhoi, A., Palladino, F., & Fabrizio, P. (2021) · Biology Open · doi:10.1242/bio.057992 · Cited by 14
Functionalized Protein Binders in Developmental Biology
Schnider, S. T., Viganò, M., Affolter, M., & Aguilar, G. (2024) · Annual Review of Cell and Developmental Biology · doi:10.1146/annurev-cellbio-112122-025214 · Cited by 14
A degron system targeting endogenous PD-1 inhibits the growth of tumor cells in mice
Naruse, C., Sugihara, K., Miyazaki, T., Pan, X., Sugiyama, F., & Asano, M. (2022) · NAR Cancer · doi:10.1093/narcan/zcac019 · Cited by 13
Generation of Plasmodium yoelii malaria parasite for conditional degradation of proteins
Liu, C., Yang, Z., Cai, M., Shi, Y., Cui, H., & Yuan, J. (2020) · Molecular and Biochemical Parasitology · doi:10.1016/j.molbiopara.2020.111346 · Cited by 13
Inutsuka, A., Maejima, S., Mizoguchi, H., Kaneko, R., Nomura, R., Takanami, K., Sakamoto, H., & Onaka, T. (2022) · Communications Biology · doi:10.1038/s42003-022-03944-2 · Cited by 12
Chemical tools for dissecting cell division
Chen, G.-Y., & Lampson, M. A. (2021) · Nature Chemical Biology · doi:10.1038/s41589-021-00798-3 · Cited by 12
Positively charged specificity site in cyclin B1 is essential for mitotic fidelity
Heinzle, C., Höfler, A., Yu, J., Heid, P., Kremer, N., Schunk, R., Stengel, F., Bange, T., Boland, A., & Mayer, T. U. (2025) · Nature Communications · doi:10.1038/s41467-024-55669-x · Cited by 10
A Nanobody-Based Toolset to Monitor and Modify the Mitochondrial GTPase Miro1
Fagbadebo, F. O., Kaiser, P. D., Zittlau, K. I., Bartlick, N., Wagner, T. R., Fröhlich, T., Jarjour, G., Nueske, S., Scholz, A. M., Traenkle, B., et al. (2022) · Frontiers in Molecular Biosciences · doi:10.3389/fmolb.2022.835302 · Cited by 10
Development of AlissAID system targeting GFP or mCherry fusion protein
Ogawa, Y., Nishimura, K., Obara, K., & Kamura, T. (2023) · PLoS Genetics · doi:10.1371/journal.pgen.1010731 · Cited by 9
Nuclear deformability facilitates apical nuclear migration in the developing zebrafish retina
Maia-Gil, M., Gorjão, M., Belousov, R., Espina, J. A., Coelho, J., Gouhier, J., Ramos, A. P., Barriga, E. H., Erzberger, A., & Norden, C. (2024) · Current Biology · doi:10.1016/j.cub.2024.10.015 · Cited by 9
Self-citationStrategies for Post-Translational Control of Protein Expression and Their Applications
Utsugi, Y., & Miyamae, Y. (2021) · Applied Sciences · doi:10.3390/app11188300 · Cited by 9
Ogawa, Y., Ueda, T. P., Obara, K., Nishimura, K., & Kamura, T. (2024) · Cells · doi:10.3390/cells13020175 · Cited by 8
Sural, S., Botero, J. Q., Hobert, O., & Tekle‐Smith, M. A. (2024) · STAR Protocols · doi:10.1016/j.xpro.2024.102901 · Cited by 8
Morabito, R. M., Tatarakis, D., Swick, R., Stettnisch, S., Nayak, P. K., Schilling, T. F., Horsfield, J. A., & Martin, B. L. (2025) · Development · doi:10.1242/dev.204661 · Cited by 7
Beute für das Proteasom: Gezielter Proteinabbau aus medizinalchemischer Perspektive
Luh, L. M., Scheib, U., Juenemann, K., Wortmann, L., Brands, M., & Cromm, P. M. (2020) · Angewandte Chemie · doi:10.1002/ange.202004310 · Cited by 7
hGRAD: A versatile “one-fits-all” system to acutely deplete RNA binding proteins from condensates
Arnold, B., Riegger, R. J., Okuda, E. K., Slišković, I., Keller, M., Bakisoglu, C., McNicoll, F., Zarnack, K., & Müller-McNicoll, M. (2023) · The Journal of Cell Biology · doi:10.1083/jcb.202304030 · Cited by 7
Li, J., Dai, C., Xie, W., Zhang, H., Huang, X., Chronis, C., Ye, Y., & Zhang, W. (2022) · Frontiers in Cell and Developmental Biology · doi:10.3389/fcell.2022.964119 · Cited by 7
Wang, R., Wang, Z., Zhang, H., Liu, X., Zhu, P., Zhou, F., Ma, J., & Hu, Q. (2025) · TrAC Trends in Analytical Chemistry · doi:10.1016/j.trac.2025.118526 · Cited by 6
Molecular tags for electron cryo-tomography
Silvester, E., & Baker, L. A. (2024) · Emerging Topics in Life Sciences · doi:10.1042/etls20240006 · Cited by 6
Vo, A. A., Levenson, M. T., Ragle, J. M., & Ward, J. D. (2021) · PubMed Central · doi:10.17912/micropub.biology.000425 · Cited by 6
Synthetic Biology Approaches in Immunology
Mohammad, N. B., Lam, C. C. K., & Truong, K. (2018) · Biochemistry · doi:10.1021/acs.biochem.8b01081 · Cited by 6
Shi, D., Zhao, X., Zhao, C., & Shao, M. (2025) · Developmental Biology · doi:10.1016/j.ydbio.2025.09.006 · Cited by 5
Zhou, Z., Wang, Y., Zheng, X., Zhang, X., Ji, L., Han, J.-Y., Zuo, Z., Mo, W., & Zhang, L. (2024) · Science China Life Sciences · doi:10.1007/s11427-024-2707-9 · Cited by 4
Photoactivatable Plant Hormone-Based Chemical Inducers of Proximity for In Vivo Applications
Pöschko, P., Berrou, C. M., Pakari, K., Ziegler, M. J., Kern, C., Koch, B., Wittbrodt, J., & Wombacher, R. (2025) · ACS Chemical Biology · doi:10.1021/acschembio.4c00592 · Cited by 4
Regulation of cell shape and mechanics by Rho GEFs and GAPs in a proliferative epithelial tissue
Durel, E., Bécot, N., Pinot, M., Chesneau, L., Pécot, T., & Borgne, R. L. (2025) · Journal of Cell Science · doi:10.1242/jcs.264163 · Cited by 6
Nanobodies against the metal binding domains of ATP7B as tools to study copper transport in the cell
Uhlemann, E.-M. E., Yu, C. H., Patry, J., Dolgova, N. V., Lutsenko, S., Muyldermans, S., & Dmitriev, O. Y. (2020) · Metallomics · doi:10.1039/d0mt00191k · Cited by 3
Elucidating the Role of Toxoplasma gondii’s Mitochondrial Superoxide Dismutase
Tirtorahardjo, J. A., I-H., C., Shaikh, A., & Andrade, R. M. (2025) · Biomolecules · doi:10.3390/biom15070972 · Cited by 3
Enhanced precision of circadian rhythm by output system
Kaji, H., Mori, F., & Ito, H. (2023) · Journal of Theoretical Biology · doi:10.1016/j.jtbi.2023.111621 · Cited by 3
Marican, H. T. A., & Shen, H. (2024) · Environmental Science & Technology · doi:10.1021/acs.est.3c05389 · Cited by 3
Core biological principles and tools stemming from basic Arabidopsis research
Strader, L. C., Edwards, D., Sureshkumar, S., Balasubramanian, S., Chen, T., Dong, X., Antunes, M. S., Zebluim, L., Chaisupa, P., & Wright, R. C. (2025) · The Plant Cell · doi:10.1093/plcell/koaf141 · Cited by 3
Islam, M., Negishi, T., Kitamoto, N., Hatoyama, Y., Gamo, K., Hayashi, K., & Kanemaki, M. T. (2025) · Journal of Cell Science · doi:10.1242/jcs.263961 · Cited by 3
Ward, J. D., Reiner, D. J., Daul, A. L., & Rougvie, A. E. (2026) · Genetics · doi:10.1093/genetics/iyaf256 · Cited by 2
Tiny tools closing the gap: nanobodies in research and therapy
Abdellatif, M., Rajurkar, J., & Leonhardt, H. (2026) · Function · doi:10.1152/function.107.2025 · Cited by 2
Camlin, N. J. (2025) · Molecular Human Reproduction · doi:10.1093/molehr/gaaf008 · Cited by 2
Tools and methods for cell ablation and cell inhibition in Caenorhabditis elegans
Rentsch, D., Bergs, A. C. F., Shao, J., Elvers, N., Ruse, C., Seidenthal, M., Aoki, I., & GOTTSCHALK, A. R. (2024) · Genetics · doi:10.1093/genetics/iyae119 · Cited by 2
Pakari, K., Jakab, S., Rasch, J., Salvador, E., Wittbrodt, B., Thiel, C., Wittbrodt, J., & Thumberger, T. (2025) · Biology Open · doi:10.1242/bio.062081 · Cited by 2
A spontaneous TIR1 loss-of-function allele in C. elegans
Myles, K. M., Vo, A. A., Ragle, J. M., & Ward, J. D. (2023) · PubMed Central · doi:10.17912/micropub.biology.000994 · Cited by 1
De Novo-Designed APC/C Inhibitors Provide a Rationale for Targeting RING-Type E3 Ubiquitin Ligases
Ruiz‐Gómez, G., Uvizl, A., Bakos, G., Leung, J. K., Pisabarro, M. T., & Mansfeld, J. (2025) · Journal of Medicinal Chemistry · doi:10.1021/acs.jmedchem.5c00416 · Cited by 2
Self-citationA Comprehensive Review on the Potential of Charged Dendrimers in Pharmaceutical Development
Karati, D., Mukherjee, S., Prajapati, B. G., Basu, B., & Das, B. (2025) · Regenerative Engineering and Translational Medicine · doi:10.1007/s40883-025-00492-z · Cited by 1
Garling, E. E., Li, S., Ho, K., & Gibbs, K. A. (2025) · mBio · doi:10.1128/mbio.03342-25 · Cited by 1
Ying, Z., Zhang, Y., Saquet, A., Shao, M., Shi, D., & Grifone, R. (2025) · Developmental Biology · doi:10.1016/j.ydbio.2025.11.001 · Cited by 1
A nanobody-based degron system for targeted protein knockdown in Dictyostelium discoideum
Hashimura, H., Fujishiro, S., Shimada, N., Adachi, T., Sugita, T., Kuwana, S., & Sawai, S. (2026) · BMC Molecular and Cell Biology · doi:10.1186/s12860-026-00572-0 · Cited by 1
Optogenetic Activation of Intracellular Nanobodies
Yu, D., & Heo, W. D. (2022) · Methods in molecular biology · doi:10.1007/978-1-0716-2075-5_31 · Cited by 1
Rapid degradation of C. elegans proteins at single-cell resolution with a synthetic auxinPreprint
Martinez, M. A. Q., Kinney, B. A., Medwig-Kinney, T. N., Ashley, G. E., Ragle, J. M., Johnson, L. C., Aguilera, J. L., Hammell, C. M., Ward, J. D., & Matus, D. Q. (2019) · bioRxiv (Cold Spring Harbor Laboratory) · doi:10.1101/716837 · Cited by 1
Metadata
- Authors
- Daniel, K., Icha, J., Horenburg, C., Müller, D., Norden, C., & Mansfeld, J.
- Affiliations
- Biotechnologisches Zentrum (DE)
- University of Turku (FI)
- Max Planck Institute of Molecular Cell Biology and Genetics (DE)
- Corresponding author
- Norden, Caren
- Mansfeld, Jörg
- Venue
- Nature Communications
- Published
- 2018-08-17
- Volume
- 9
- Issue
- 1
- Pages
- 3297-3297
- ISSN
- 2041-1723 (ISSN-L)
- PMC
- PMC6098157
- OpenAlex
- W2951829327
- Cited by
- 113
- References
- 45
- Citations by year
- 2026: 9 · 2025: 22 · 2024: 13 · 2023: 9 · 2022: 7 · 2021: 12 · 2020: 23 · 2019: 14 · 2018: 4
- FWCI
- 4.71
- Type
- journal article
- Language
- en
- Open access
- gold
- doi.org
- Locations
- Nature Communications (publishedVersion, cc-by)
- bioRxiv (Cold Spring Harbor Laboratory) (acceptedVersion, cc-by-nc-nd)
- Europe PMC (PubMed Central) (publishedVersion, other-oa)
- PubMed Central (publishedVersion, cc-by)
- PubMed (publishedVersion)
- UTUPub (University of Turku) (submittedVersion, other-oa)
- RePEc: Research Papers in Economics (submittedVersion)
- DOAJ (DOAJ: Directory of Open Access Journals) (submittedVersion)
- DOAJ (DOAJ: Directory of Open Access Journals) (submittedVersion, cc-by-sa)
- MPG.PuRe (Max Planck Society) (submittedVersion)
- Funders
- Deutsche Forschungsgemeinschaft (MA 5831/1-1)
- EC | European Research Council (680042)
- Topics
- Life Sciences › Biochemistry, Genetics and Molecular Biology › Molecular Biology › Protein Degradation and Inhibitors
- Life Sciences › Biochemistry, Genetics and Molecular Biology › Molecular Biology › Ubiquitin and proteasome pathways
- Life Sciences › Biochemistry, Genetics and Molecular Biology › Biophysics › Advanced Fluorescence Microscopy Techniques
- Keywords
- auxin-inducible degron, nanobodies, anti-GFP nanobody, anaphase-promoting complex, E3 ubiquitin ligase, zebrafish, human cells
- MeSH terms
- Animals, Cell Compartmentation, HeLa Cells, Humans, Indoleacetic Acids, Kinetics, Lysine, Recombinant Fusion Proteins, Zebrafish, Green Fluorescent Proteins, Proteolysis, Single-Domain Antibodies, Anaphase-Promoting Complex-Cyclosome
About these checks
Registry, retraction, Cites and statistics results are computed, not judged, with one exception: a printed reference that no index lists is read once by a model before it counts as a citation error. Claims are extracted by a model and kept only when their quote appears verbatim in the text; each cited source is then checked, with a model’s help, for whether it says what the claim relies on. Those verdicts can be wrong — read the claim’s quote and the cited source before relying on one.
Statistics and arithmetic are recomputed, not judged.
Confidence bands are shown only for fields calibrated on our annotated test set. None is calibrated yet, so no band is shown.
What counts as a claim ›How we measure confidence ›How we check this ›
Are you an author, or do you see a problem with this page? Request a review
