

The DOI matches its Crossref record; 52 of the 54 references it cites were found in a registry or an index.
Gender differences in individual variation in academic grades fail to fit expected patterns for STEM
Open accessAbstract
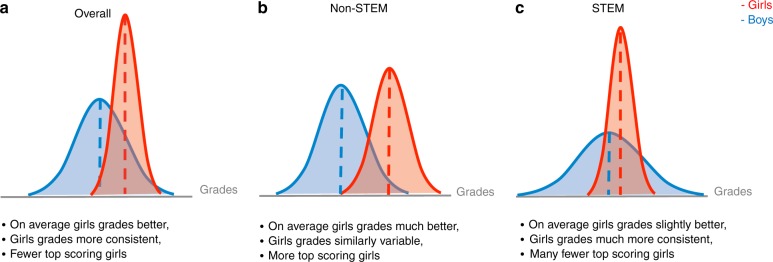
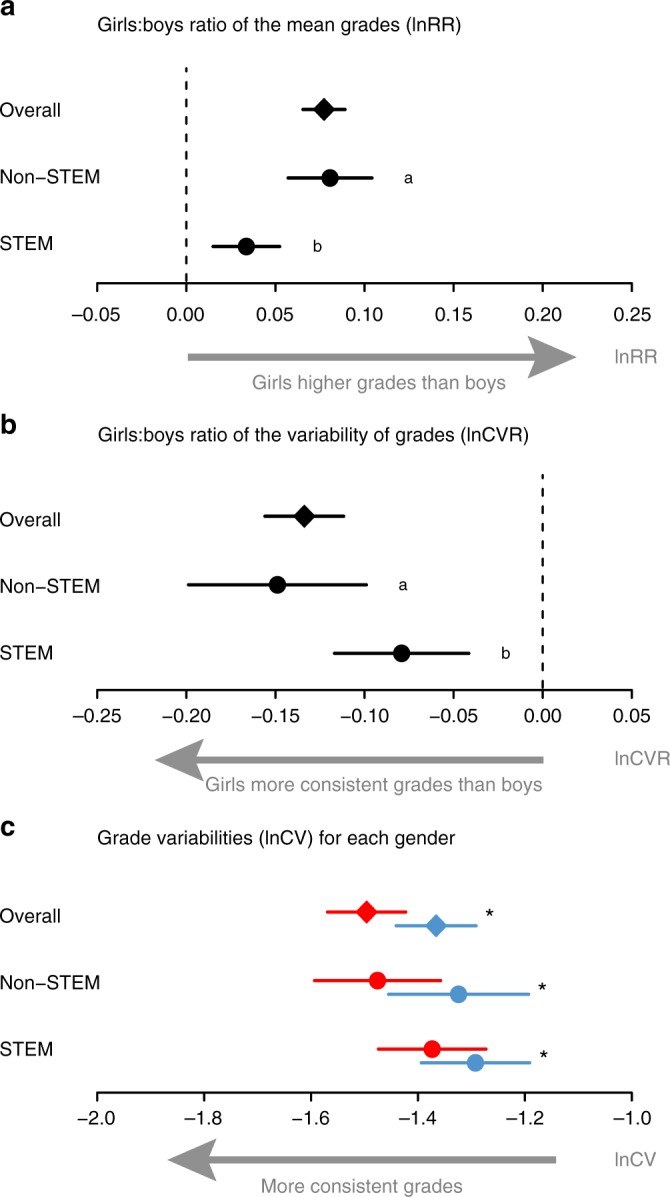
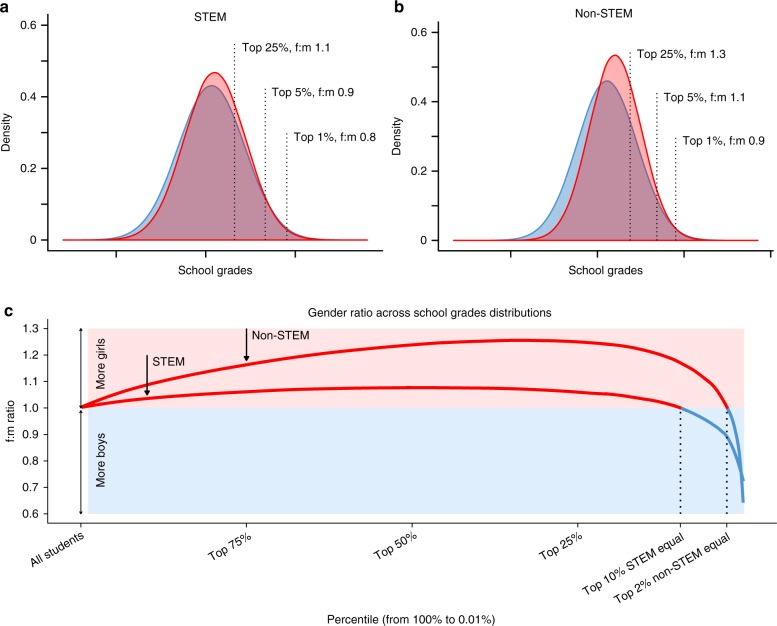
Fewer women than men pursue careers in science, technology, engineering and mathematics (STEM), despite girls outperforming boys at school in the relevant subjects. According to the 'variability hypothesis', this over-representation of males is driven by gender differences in variance; greater male variability leads to greater numbers of men who exceed the performance threshold. Here, we use recent meta-analytic advances to compare gender differences in academic grades from over 1.6 million students. In line with previous studies we find strong evidence for lower variation among girls than boys, and of higher average grades for girls. However, the gender differences in both mean and variance of grades are smaller in STEM than non-STEM subjects, suggesting that greater variability is insufficient to explain male over-representation in STEM. Simulations of these differences suggest the top 10% of a class contains equal numbers of girls and boys in STEM, but more girls in non-STEM subjects.
Overview
The claims and statistics of this paper haven’t been checked yet.
Run the check — free, no account needed. It reads the open-access text and checks the sources it cites.
Integrity signals
Registry
Cites
Statistics
Figures
Verification
Claims the paper makes
The claims and statistics of this paper haven’t been checked yet.
Run the check — free, no account needed. It reads the open-access text and checks the sources it cites.
Claims other papers make about this one
Each is checked against this paper’s own text: does it say what the citing paper says it does?
The cited source doesn’t support the claim as written.
In the citing paper
“This finding corroborates broader trends in the literature, which showed no significant influence of gender on academic performance [45,46].”
From Relationships Between Physical Activity, Sleep, Psychological Well-Being, and Academic Performance Among Native American College Students (2026) · cites this paper as [46]
Checked by a reasoning model — may be wrong.
Experimental — accuracy not yet measured
Self-check
Percentages, sums and reported differences re-computed from the paper’s own numbers.
The self-check needs the paper’s full text.
Citations
Cites
Preferred Reporting Items for Systematic Reviews and Meta-Analyses: the PRISMA statement
Moher, D., Liberati, A., Tetzlaff, J., Altman, D. G., & for the PRISMA Group (2009) · BMJ · doi:10.1136/bmj.b2535 · Cited by 83,823
Bias in meta-analysis detected by a simple, graphical test
Egger, M., Smith, G. D., Schneider, M., & Minder, C. (1997) · BMJ · doi:10.1136/bmj.315.7109.629 · Cited by 56,722
Preferred reporting items for systematic reviews and meta-analyses: the PRISMA Statement.
(2009) · PubMed Central · Cited by 44,859
Conducting Meta-Analyses in R with the metafor Package
Viechtbauer, W. (2010) · Journal of Statistical Software · doi:10.18637/jss.v036.i03 · Cited by 20,464
Preferred Reporting Items for Systematic Reviews and Meta-Analyses: The PRISMA Statement
Moher, D., Liberati, A., Tetzlaff, J., & Altman, D. G. (2009) · Journal of Clinical Epidemiology · doi:10.1016/j.jclinepi.2009.06.005 · Cited by 19,575
The meta-analysis of response ratios in experimental ecology
Hedges, L. V., Gurevitch, J., & Curtis, P. S. (1999) · Ecology · doi:10.1890/0012-9658(1999)080[1150:tmaorr]2.0.co;2 · Cited by 4,704
Aggregation, Variance and the Mean
TAYLOR, L. R. (1961) · Nature · doi:10.1038/189732a0 · Cited by 2,496
Cross-national patterns of gender differences in mathematics: A meta-analysis.
Else-Quest, N. M., Hyde, J. S., & Linn, M. C. (2010) · Psychological Bulletin · doi:10.1037/a0018053 · Cited by 1,630
Expectations of brilliance underlie gender distributions across academic disciplines
Leslie, S.-J., Cimpian, A., Meyer, M., & Freeland, E. (2015) · Science · doi:10.1126/science.1261375 · Cited by 1,516
Wang, M., & Degol, J. L. (2016) · Educational Psychology Review · doi:10.1007/s10648-015-9355-x · Cited by 1,418
Research works printed but not linked: 2
- OECD. STEM workers receive a significant earnings premium over other workers with the same level of education: private wage and salary, workers aged 25 and over. https://doi.org/10.1787/eco_surveys-usa-2012-graph47-en (2012). · DOI
- Lackey, L. W. & Lackey, W. J. Grade inflation: potential causes and solutions. Int. J. Eng. Educ. 22, 130–139 (2006).
Cited by
Sorted by citations
Explaining the Gender Gap in Math Test Scores: The Role of Competition
Niederle, M., & Vesterlund, L. (2010) · The Journal of Economic Perspectives · doi:10.1257/jep.24.2.129 · Cited by 527
Organisational best practices towards gender equality in science and medicine
Coe, I. R., Wiley, R. E., & Bekker, L. (2019) · The Lancet · doi:10.1016/s0140-6736(18)33188-x · Cited by 228
Nakagawa, S., Yang, Y., Macartney, E. L., Spake, R., & Lagisz, M. (2023) · Environmental Evidence · doi:10.1186/s13750-023-00301-6 · Cited by 242
Self-citationCanetto, S. S., & Chen, J. (2020) · Cambridge University Press eBooks · doi:10.1017/9781108561716.042 · Cited by 194
Why Does Workplace Gender Diversity Matter? Justice, Organizational Benefits, and Policy
Fine, C., Sojo, V. E., & Lawford‐Smith, H. (2019) · Social Issues and Policy Review · doi:10.1111/sipr.12064 · Cited by 228
Metadata
- Authors
- O’Dea, R. E., Lagisz, M., Jennions, M. D., & Nakagawa, S.
- Affiliations
- Australian National University (AU)
- UNSW Sydney (AU)
- Corresponding author
- O’Dea, R. E.
- Nakagawa, S.
- Venue
- Nature Communications
- Published
- 2018-09-25
- Volume
- 9
- Issue
- 1
- Pages
- 3777-3777
- ISSN
- 2041-1723 (ISSN-L)
- PMC
- PMC6156605
- OpenAlex
- W2890559011
- Cited by
- 253
- References
- 54
- Citations by year
- 2026: 16 · 2025: 23 · 2024: 25 · 2023: 22 · 2022: 31 · 2021: 37 · 2020: 78 · 2019: 14 · 2018: 4
- FWCI
- 66.07
- Type
- journal article
- Language
- en
- Open access
- gold
- doi.org
- Locations
- Nature Communications (publishedVersion, cc-by)
- Europe PMC (PubMed Central) (publishedVersion, other-oa)
- PubMed Central (publishedVersion, cc-by)
- PubMed (publishedVersion)
- UNSWorks (University of New South Wales, Sydney, Australia) (submittedVersion, cc-by-nc-nd)
- RePEc: Research Papers in Economics (submittedVersion)
- DOAJ (DOAJ: Directory of Open Access Journals) (submittedVersion)
- DOAJ (DOAJ: Directory of Open Access Journals) (submittedVersion, cc-by-sa)
- ANU Open Research (Australian National University) (submittedVersion)
- Topics
- Social Sciences › Psychology › Applied Psychology › Career Development and Diversity
- Social Sciences › Psychology › Developmental and Educational Psychology › Education, Achievement, and Giftedness
- Social Sciences › Gender Studies › Gender and Technology in Education
- Keywords
- gender differences, student grades, individual differences, STEM careers, gender gap in science, variance, mean and variance, high-achieving students, girls' academic performance
- MeSH terms
- Academic Performance, Adolescent, Adult, Child, Engineering, Female, Humans, Male, Mathematics, Motivation, Sex Factors, Students, Technology, Models, Statistical, Sex Distribution, Young Adult, Datasets as Topic
About these checks
Registry, retraction, Cites and statistics results are computed, not judged, with one exception: a printed reference that no index lists is read once by a model before it counts as a citation error. Claims are extracted by a model and kept only when their quote appears verbatim in the text; each cited source is then checked, with a model’s help, for whether it says what the claim relies on. Those verdicts can be wrong — read the claim’s quote and the cited source before relying on one.
Statistics and arithmetic are recomputed, not judged.
Confidence bands are shown only for fields calibrated on our annotated test set. None is calibrated yet, so no band is shown.
What counts as a claim ›How we measure confidence ›How we check this ›
Are you an author, or do you see a problem with this page? Request a review
