

The DOI matches its Crossref record; 37 of the 38 references it cites were found in a registry or an index.
Closed-loop functional optogenetic stimulation
Open accessAbstract
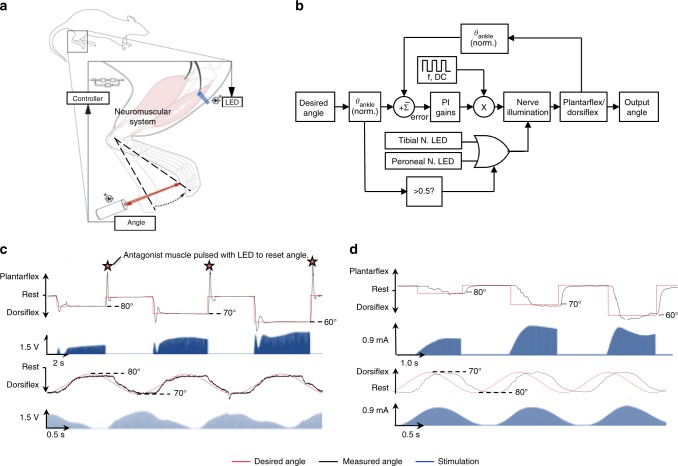
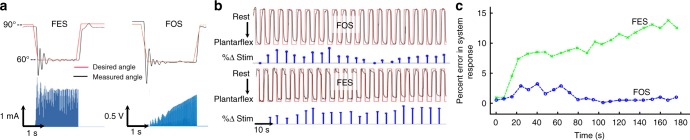
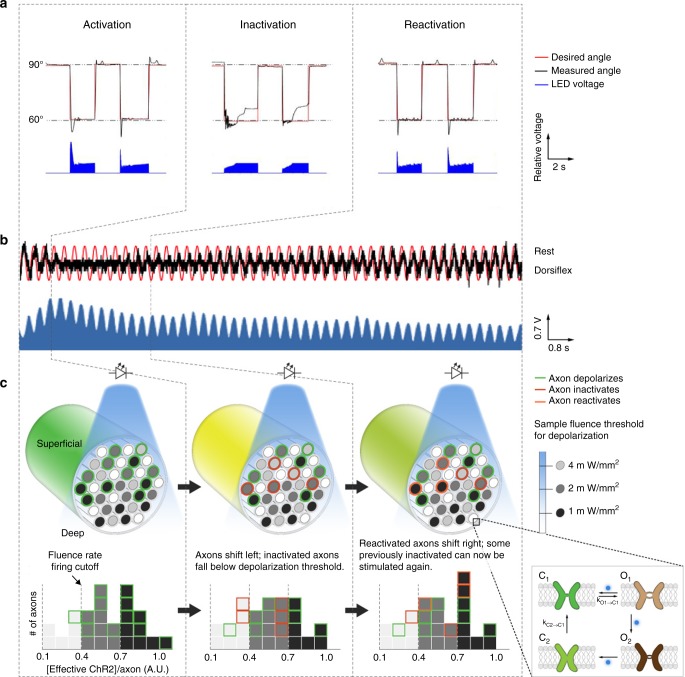
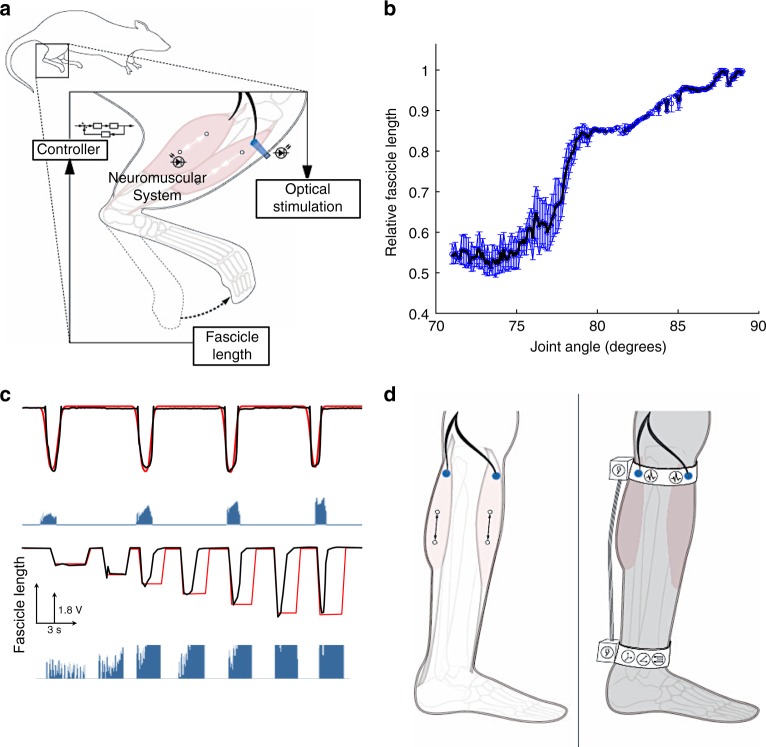
Optogenetics has been used to orchestrate temporal- and tissue-specific control of neural tissues and offers a wealth of unique advantages for neuromuscular control. Here, we establish a closed-loop functional optogenetic stimulation (CL-FOS) system to control ankle joint position in murine models. Using the measurement of either joint angle or fascicle length as a feedback signal, we compare the controllability of CL-FOS to closed-loop functional electrical stimulation (CL-FES) and demonstrate significantly greater accuracy, lower rise times and lower overshoot percentages. We demonstrate orderly recruitment of motor units and reduced fatigue when performing cyclical movements with CL-FOS compared with CL-FES. We develop and investigate a 3-phase, photo-kinetic model to elucidate the underlying mechanisms for temporal variations in optogenetically activated neuromusculature during closed-loop control experiments. Methods and insights from this study lay the groundwork for the development of closed-loop optogenetic neuromuscular stimulation therapies and devices for peripheral limb control.
Overview
The claims and statistics of this paper haven’t been checked yet.
Free: it reads the open-access text and checks the first 5 claims that cite a source we can check. Create a free account to check every claim.
Integrity signals
Registry
Cites
Statistics
Figures
Verification
Claims the paper makes
The claims and statistics of this paper haven’t been checked yet.
Free: it reads the open-access text and checks the first 5 claims that cite a source we can check. Create a free account to check every claim.
Claims other papers make about this one
Each is checked against this paper’s own text: does it say what the citing paper says it does?
The cited source says what the claim attributes to it.
In the citing paper
“Stimulation holds tremendous promise for prosthetic information feedback[86,515] and rehabilitation.[329,516,517]”
From Flexible Electronics and Devices as Human–Machine Interfaces for Medical Robotics (2022) · cites this paper as [515]
The check wasn’t confident either way, so it gives no verdict — never disputed.
In the citing paper
“Common substrate materials include PI and hydrogel, which can remain chemically inert in vivo while also providing sufficient dielectric strength to prevent discharge breakdown.”
From Flexible Electronics and Devices as Human–Machine Interfaces for Medical Robotics (2022) · cites this paper as [515]
Experimental — accuracy not yet measuredThe check wasn’t confident either way, so it gives no verdict — never disputed.
In the citing paper
“Afferents and efferent projections from the spinal grey matter also carry somatosensory and motorial information.[515]”
From Flexible Electronics and Devices as Human–Machine Interfaces for Medical Robotics (2022) · cites this paper as [515]
Experimental — accuracy not yet measured
Self-check
Percentages, sums and reported differences re-computed from the paper’s own numbers.
The self-check needs the paper’s full text.
Citations
Cites
Millisecond-timescale, genetically targeted optical control of neural activity
Boyden, E. S., Zhang, F., Bamberg, E., Nagel, G., & Deisseroth, K. (2005) · Nature Neuroscience · doi:10.1038/nn1525 · Cited by 4,861
Channelrhodopsin-2, a directly light-gated cation-selective membrane channel
Nagel, G., Szellas, T., Huhn, W., Kateriya, S., Adeishvili, N., Berthold, P., Ollig, D., Hegemann, P., & Bamberg, E. (2003) · Proceedings of the National Academy of Sciences · doi:10.1073/pnas.1936192100 · Cited by 2,663
BioelectromagnetismPrinciples and Applications of Bioelectric and Biomagnetic Fields
Malmivuo, J., & Plonsey, R. (1995) · doi:10.1093/acprof:oso/9780195058239.001.0001 · Cited by 1,834
Functional Electrical Stimulation for Neuromuscular Applications
Peckham, P. H., & Knutson, J. S. (2005) · Annual Review of Biomedical Engineering · doi:10.1146/annurev.bioeng.6.040803.140103 · Cited by 784
A neural interface provides long-term stable natural touch perception
Tan, D. W., Schiefer, M. A., Keith, M. W., Anderson, J. R., Tyler, J., & Tyler, D. J. (2014) · Science Translational Medicine · doi:10.1126/scitranslmed.3008669 · Cited by 751
The Microbial Opsin Family of Optogenetic Tools
Zhang, F., Vierock, J., Yizhar, O., Fenno, L. E., Tsunoda, S., Kianianmomeni, A., Prigge, M., Berndt, A., Cushman, J., Polle, J., et al. (2011) · Cell · doi:10.1016/j.cell.2011.12.004 · Cited by 509
Modeling the Spatiotemporal Dynamics of Light and Heat Propagation for In Vivo Optogenetics
Stujenske, J. M., Spellman, T., & Gordon, J. A. (2015) · Cell Reports · doi:10.1016/j.celrep.2015.06.036 · Cited by 383
Proprioception from a neurally controlled lower-extremity prosthesis
Clites, T. R., Carty, M. J., Ullauri, J. B., Carney, M. E., Mooney, L. M., Duval, J.-F., Srinivasan, S. S., & Herr, H. M. (2018) · Science Translational Medicine · doi:10.1126/scitranslmed.aap8373 · Cited by 233
Self-citationOrderly recruitment of motor units under optical control in vivo
Llewellyn, M. E., Thompson, K. R., Deisseroth, K., & Delp, S. L. (2010) · Nature Medicine · doi:10.1038/nm.2228 · Cited by 217
Arcourt, A., Gorham, L., Dhandapani, R., Prato, V., Taberner, F. J., Wende, H., Gangadharan, V., Birchmeier, C., Heppenstall, P. A., & Lechner, S. G. (2017) · Neuron · doi:10.1016/j.neuron.2016.11.027 · Cited by 213
Research works printed but not linked: 1
- Maimon, B. E. et al. Transdermal optogenetic peripheral nerve stimulation. J. Neural Eng. 14, 034002 (2017). · DOI · Paper page
Cited by
Flexible Electronics and Devices as Human–Machine Interfaces for Medical Robotics
Heng, W., Solomon, S., & Gao, W. (2022) · Advanced Materials · doi:10.1002/adma.202107902 · Cited by 609
Soft Sensors and Actuators for Wearable Human–Machine Interfaces
Park, J., Lee, Y., Cho, S., Choe, A., Yeom, J., Ro, Y. G., Kim, J., Kang, D.-H., Lee, S., & Ko, H. (2024) · Chemical Reviews · doi:10.1021/acs.chemrev.3c00356 · Cited by 272
Restoration of sensory information via bionic hands
Bensmaia, S. J., Tyler, D. J., & Micera, S. (2020) · Nature Biomedical Engineering · doi:10.1038/s41551-020-00630-8 · Cited by 257
Optophysiology: Illuminating cell physiology with optogenetics
Tan, P., He, L., Huang, Y., & Zhou, Y. (2022) · Physiological Reviews · doi:10.1152/physrev.00021.2021 · Cited by 153
A Comprehensive Review of Emerging Trends and Innovative Therapies in Epilepsy Management
Ghosh, S., Sinha, J. K., Ghosh, S. K., Sharma, H., Bhaskar, R., & Narayanan, K. B. (2023) · Brain Sciences · doi:10.3390/brainsci13091305 · Cited by 109
Metadata
- Authors
- Srinivasan, S. S., Maimon, B. E., Diaz, M., Song, H., & Herr, H. M.
- Affiliations
- Harvard–MIT Division of Health Sciences and Technology (US)
- MIT Media Lab (US)
- Corresponding author
- Srinivasan, Shriya S.
- Herr, Hugh M.
- Venue
- Nature Communications
- Published
- 2018-12-13
- Volume
- 9
- Issue
- 1
- Pages
- 5303-5303
- ISSN
- 2041-1723 (ISSN-L)
- PMC
- PMC6294002
- OpenAlex
- W2905338839
- Cited by
- 68
- References
- 38
- Citations by year
- 2026: 5 · 2025: 13 · 2024: 8 · 2023: 10 · 2022: 10 · 2021: 8 · 2020: 8 · 2019: 6
- FWCI
- 2.50
- Type
- journal article
- Language
- en
- Open access
- gold
- doi.org
- Licence
- cc-by
- creativecommons.org/licenses/by/4.0 (tdm)
- creativecommons.org/licenses/by/4.0 (vor)
- Locations
- Nature Communications (publishedVersion, cc-by)
- Europe PMC (PubMed Central) (publishedVersion, other-oa)
- PubMed Central (publishedVersion, cc-by)
- PubMed (publishedVersion)
- DSpace@MIT (Massachusetts Institute of Technology) (submittedVersion, cc-by-nc)
- RePEc: Research Papers in Economics (submittedVersion)
- DOAJ (DOAJ: Directory of Open Access Journals) (submittedVersion)
- DOAJ (DOAJ: Directory of Open Access Journals) (submittedVersion, cc-by-sa)
- Topics
- Life Sciences › Neuroscience › Cellular and Molecular Neuroscience › Neuroscience and Neural Engineering
- Life Sciences › Neuroscience › Cellular and Molecular Neuroscience › Photoreceptor and optogenetics research
- Physical Sciences › Engineering › Biomedical Engineering › Muscle activation and electromyography studies
- Keywords
- functional electrical stimulation, neuromuscular stimulation, motor unit recruitment, muscle fatigue, feedback control
- MeSH terms
- Animals, Ankle Joint, Electric Stimulation, Feedback, Mice, Transgenic, Movement, Rats, Inbred F344, Peripheral Nervous System, Muscle, Skeletal, Mice, Rats, Optogenetics
About these checks
Registry, retraction, Cites and statistics results are computed, not judged, with one exception: a printed reference that no index lists is read once by a model before it counts as a citation error. Claims are extracted by a model and kept only when their quote appears verbatim in the text; each cited source is then checked, with a model’s help, for whether it says what the claim relies on. Those verdicts can be wrong — read the claim’s quote and the cited source before relying on one.
Statistics and arithmetic are recomputed, not judged.
Confidence bands are shown only for fields calibrated on our annotated test set. None is calibrated yet, so no band is shown.
What counts as a claim ›How we measure confidence ›How we check this ›
Are you an author, or do you see a problem with this page? Request a review
How to cite
Cite CoChat for the checks on this page, and the paper for its own findings.
- This page
- CoChat. (2026). Citation check: Closed-loop functional optogenetic stimulation. https://app.cochat.ai/papers/10.1038/s41467-018-07721-w
- The paper
- Srinivasan, S. S., Maimon, B. E., Diaz, M., Song, H., & Herr, H. M. (2018). Closed-loop functional optogenetic stimulation. Nature Communications. https://doi.org/10.1038/s41467-018-07721-w
Data sources
Bibliographic data: Semantic Scholar, OpenAlex, Crossref.
Contains information from the Semantic Scholar Academic Graph Datasets, made available under the ODC Attribution License (ODC-BY 1.0).
Semantic Scholar’s data is described in: Kinney, R., et al. (2023). The Semantic Scholar Open Data Platform. arXiv:2301.10140.
