

The DOI matches its Crossref record; 59 of the 60 references it cites were found in a registry or an index.
Forming global estimates of self-performance from local confidence
Open accessAbstract
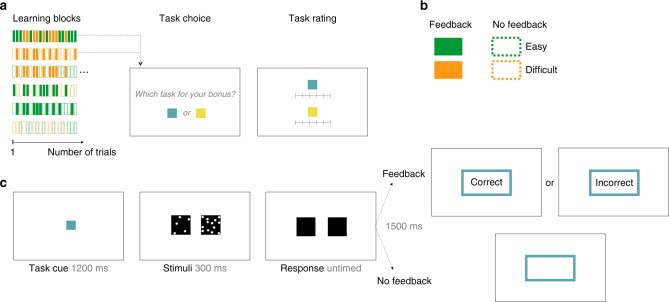
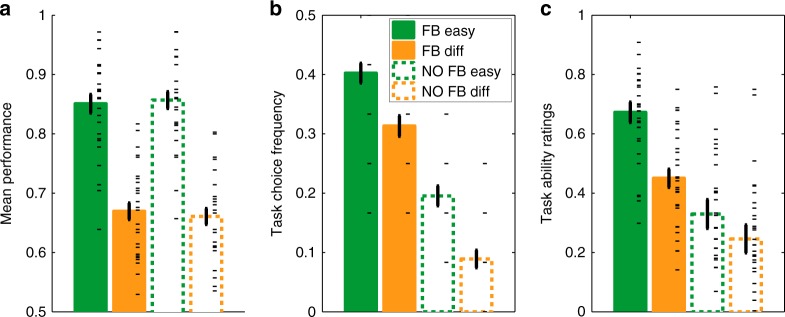
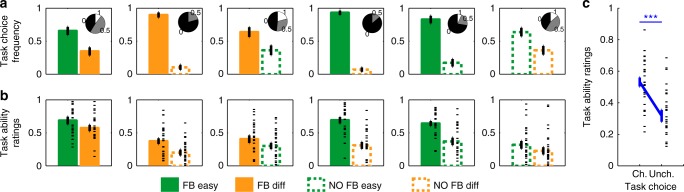
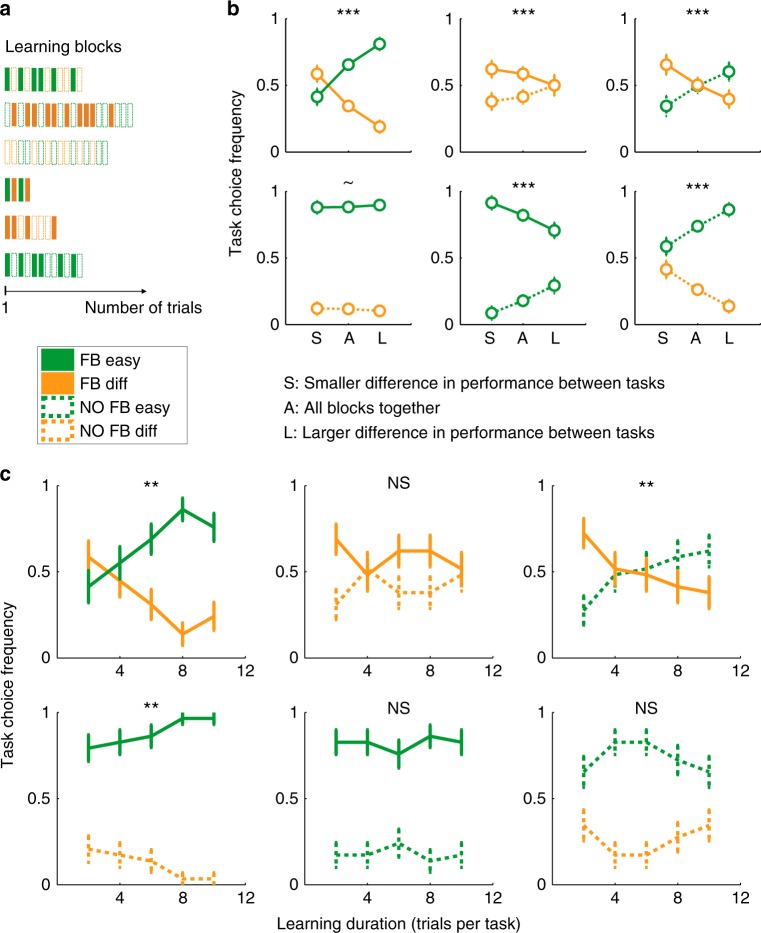
Metacognition, the ability to internally evaluate our own cognitive performance, is particularly useful since many real-life decisions lack immediate feedback. While most previous studies have focused on the construction of confidence at the level of single decisions, little is known about the formation of “global” self-performance estimates (SPEs) aggregated from multiple decisions. Here, we compare the formation of SPEs in the presence and absence of feedback, testing a hypothesis that local decision confidence supports the formation of SPEs when feedback is unavailable. We reveal that humans pervasively underestimate their performance in the absence of feedback, compared to a condition with full feedback, despite objective performance being unaffected. We find that fluctuations in confidence contribute to global SPEs over and above objective accuracy and reaction times. Our findings create a bridge between a computation of local confidence and global SPEs, and support a functional role for confidence in higher-order behavioral control.
Overview
The claims and statistics of this paper haven’t been checked yet.
Run the check — free, no account needed. It reads the open-access text and checks the sources it cites.
Integrity signals
Registry
Cites
Statistics
Figures
Verification
Claims the paper makes
The claims and statistics of this paper haven’t been checked yet.
Run the check — free, no account needed. It reads the open-access text and checks the sources it cites.
Claims other papers make about this one
Each is checked against this paper’s own text: does it say what the citing paper says it does?
The cited source says what the claim attributes to it.
In the citing paper
“One fruitful approach considers global confidence as a higher-order prior on estimates of (local) propositional confidence (Boldt et al. 2019, Marcke et al. 2022), which can be naturally modeled as a probability distribution over expected success (Rouault et al. 2019).”
From Metacognition and Confidence: A Review and Synthesis (2024) · cites this paper as Rouault et al. 2019
The cited source says what the claim attributes to it.
In the citing paper
“Global confidence was informed by local confidence fluctuations during the previous block, and using fMRI, it was found that vmPFC and precuneus integrate local confidence over longer timescales to track aggregate self-performance (Rouault & Fleming 2020, Wittmann et al. 2016).”
From Metacognition and Confidence: A Review and Synthesis (2024) · cites this paper as Rouault et al. 2019
Self-check
Percentages, sums and reported differences re-computed from the paper’s own numbers.
The self-check needs the paper’s full text.
Citations
Cites
Self-efficacy: Toward a unifying theory of behavioral change
Bandura, A. (1977) · Psychological Review · doi:10.1037/0033-295x.84.2.191 · Cited by 43,925
Self-efficacy: Toward a unifying theory of behavioral change
Bandura, A. (1978) · Advances in Behaviour Research and Therapy · doi:10.1016/0146-6402(78)90002-4 · Cited by 10,586
A neural system for error detection and compensation
Gehring, W. J., Goss, B., Coles, M. G. H., Meyer, D. E., & Donchin, E. (1993) · Psychological Science · doi:10.1111/j.1467-9280.1993.tb00586.x · Cited by 2,862
Does low self-esteem predict depression and anxiety? A meta-analysis of longitudinal studies.
Sowislo, J. F., & Orth, U. (2013) · Psychological Bulletin · doi:10.1037/a0028931 · Cited by 2,123
jsPsych: A JavaScript library for creating behavioral experiments in a Web browser
de Leeuw, J. R. (2014) · Behavior Research Methods · doi:10.3758/s13428-014-0458-y · Cited by 1,899
Model-based influences on humans’ choices and striatal prediction errors
Daw, N. D., Gershman, S. J., Seymour, B., Dayan, P., & Dolan, R. J. (2011) · Neuron · doi:10.1016/j.neuron.2011.02.027 · Cited by 1,779
Self-citationFleming, S. M., & Lau, H. C. (2014) · Frontiers in Human Neuroscience · doi:10.3389/fnhum.2014.00443 · Cited by 1,408
Self-citationRepresentation of Confidence Associated with a Decision by Neurons in the Parietal Cortex
Kiani, R., & Shadlen, M. N. (2009) · Science · doi:10.1126/science.1169405 · Cited by 1,027
Chandler, J., Mueller, P., & Paolacci, G. (2014) · Behavior Research Methods · doi:10.3758/s13428-013-0365-7 · Cited by 950
Maniscalco, B., & Lau, H. (2012) · Consciousness and Cognition · doi:10.1016/j.concog.2011.09.021 · Cited by 883
Cited by
Sorted by citations
Metacognition and Confidence: A Review and Synthesis
Fleming, S. M. (2024) · Annual Review of Psychology · doi:10.1146/annurev-psych-022423-032425 · Cited by 256
“One fruitful approach considers global confidence as a higher-order prior on estimates of (local) propositional confidence (Marcke et al., 2022, Boldt et al., 2019), which can be naturally modeled as a probability distribution over expected success (Rouault et al., 2019).”
Self-citationHow Local and Global Metacognition Shape Mental Health
Seow, T. X. F., Rouault, M., Gillan, C. M., & Fleming, S. M. (2021) · Biological Psychiatry · doi:10.1016/j.biopsych.2021.05.013 · Cited by 159
“Local subjective confidence ratings were found to predict global self-beliefs over and above objective performance (80).”
BackgroundInfluentialSelf-citationAdvances in modeling learning and decision-making in neuroscience
Collins, A. G. E., & Shenhav, A. (2021) · Neuropsychopharmacology · doi:10.1038/s41386-021-01126-y · Cited by 113
Formation of global self-beliefs in the human brain
Rouault, M., & Fleming, S. M. (2020) · Proceedings of the National Academy of Sciences · doi:10.1073/pnas.2003094117 · Cited by 76
“We have recently obtained behavioral evidence that human subjects build global SPEs by learning from local confidence over multiple instances when external feedback is withheld (3).”
InfluentialSelf-citationHow do confidence and self-beliefs relate in psychopathology: a transdiagnostic approach
Hoven, M., Luigjes, J., Denys, D. A. J. P., Rouault, M., & van Holst, R. J. (2023) · Nature Mental Health · doi:10.1038/s44220-023-00062-8 · Cited by 82
Self-citation
Metadata
- Authors
- Rouault, M., Dayan, P., & Fleming, S. M.
- Affiliations
- Wellcome Centre for Human Neuroimaging (GB)
- Corresponding author
- Rouault, Marion
- Venue
- Nature Communications
- Published
- 2019-03-08
- Volume
- 10
- Issue
- 1
- Pages
- 1141-1141
- ISSN
- 2041-1723 (ISSN-L)
- PMC
- PMC6408496
- OpenAlex
- W2921883422
- Cited by
- 134
- References
- 60
- Citations by year
- 2026: 22 · 2025: 16 · 2024: 26 · 2023: 27 · 2022: 18 · 2021: 15 · 2020: 9 · 2019: 1
- FWCI
- 6.25
- Type
- journal article
- Language
- en
- Open access
- gold
- doi.org
- Locations
- Nature Communications (publishedVersion, cc-by)
- Europe PMC (PubMed Central) (publishedVersion, other-oa)
- PubMed Central (publishedVersion, cc-by)
- PubMed (publishedVersion)
- HAL (submittedVersion, cc-by)
- RePEc: Research Papers in Economics (submittedVersion)
- DOAJ (DOAJ: Directory of Open Access Journals) (submittedVersion, cc-by-sa)
- DOAJ (DOAJ: Directory of Open Access Journals) (submittedVersion)
- UCL Discovery (University College London) (submittedVersion)
- MPG.PuRe (Max Planck Society) (submittedVersion)
- Funders
- Wellcome Trust (203147/Z/16/Z, Z/17/Z, 203147, 206648/Z/17/Z, 206648, 203147/Z/16/)
- Gatsby Charitable Foundation
- Agence Nationale de la Recherche (ANR-17-EURE-0017)
- Max-Planck-Gesellschaft (203147/Z/16/Z, 206648/Z/17/Z)
- Topics
- Life Sciences › Neuroscience › Cognitive Neuroscience › Neural and Behavioral Psychology Studies
- Life Sciences › Neuroscience › Cognitive Neuroscience › Memory Processes and Influences
- Social Sciences › Decision Sciences › General Decision Sciences › Decision-Making and Behavioral Economics
- Keywords
- metacognition, decision confidence, feedback, reaction time, behavioral control
- MeSH terms
- Metacognition, Adult, Decision Making, Female, Humans, Judgment, Male, Middle Aged, Pattern Recognition, Visual, Psychological Tests, Psychomotor Performance, Reaction Time, Self Concept, Feedback, Psychological
About these checks
Registry, retraction, Cites and statistics results are computed, not judged, with one exception: a printed reference that no index lists is read once by a model before it counts as a citation error. Claims are extracted by a model and kept only when their quote appears verbatim in the text; each cited source is then checked, with a model’s help, for whether it says what the claim relies on. Those verdicts can be wrong — read the claim’s quote and the cited source before relying on one.
Statistics and arithmetic are recomputed, not judged.
Confidence bands are shown only for fields calibrated on our annotated test set. None is calibrated yet, so no band is shown.
What counts as a claim ›How we measure confidence ›How we check this ›
Are you an author, or do you see a problem with this page? Request a review
