Student or educator? Sign up with your school email and get 6 months of Pro free.
CoChat

The DOI matches its Crossref record; 59 of the 59 references it cites were found in a registry or an index.

Exploiting interconnected synthetic lethal interactions between PARP inhibition and cancer cell reversible senescence

Open access
Fleury, Hubert, Malaquin, Nicolas, Tu, Véronique, Gilbert, Sophie, Martinez, Aurélie, Olivier, Marc-Alexandre, Sauriol, Skye Alexandre, Communal, Laudine, Leclerc-Desaulniers, Kim, Carmona, Euridice, Provencher, Diane, Mes-Masson, Anne-Marie, Rodier, Francis · 2019 · Nature Communications

Abstract

Senescence is a tumor suppression mechanism defined by stable proliferation arrest. Here we demonstrate that the known synthetic lethal interaction between poly(ADP-ribose) polymerase 1 inhibitors (PARPi) and DNA repair triggers p53-independent ovarian cancer cell senescence defined by senescence-associated phenotypic hallmarks including DNA-SCARS, inflammatory secretome, Bcl-XL-mediated apoptosis resistance, and proliferation restriction via Chk2 and p21 (CDKN1A). The concept of senescence as irreversible remains controversial and here we show that PARPi-senescent cells re-initiate proliferation upon drug withdrawal, potentially explaining the requirement for sustained PARPi therapy in the clinic. Importantly, PARPi-induced senescence renders ovarian and breast cancer cells transiently susceptible to second-phase synthetic lethal approaches targeting the senescence state using senolytic drugs. The combination of PARPi and a senolytic is effective in preclinical models of ovarian and breast cancer suggesting that coupling these synthetic lethalities provides a rational approach to their clinical use and may together be more effective in limiting resistance.

Overview

The claims and statistics of this paper haven’t been checked yet.

Free: it reads the open-access text and checks the first 5 claims that cite a source we can check. Create a free account to check every claim.

A few free checks a day · papers already verified open instantly · results are public

Integrity signals

Registry

Crossref · 10.1038/s41467-019-10460-1

Cites

59 of 59 references verified0 citation errors · 0 not checkable

Statistics

Figures

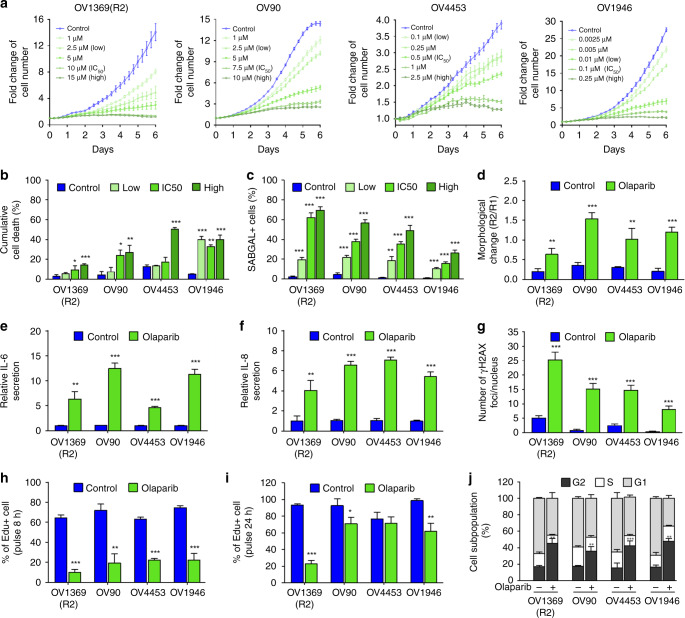
Fig. 1 Olaparib induces a senescence-like phenotype in HGSOC cell lines. a Cell proliferation curves of HGSOC H2B-GFP cell lines exposed to increasing concentrations of Olaparib. b, c HGSOC dead cells analyzed by flow cytometry (b) and SAβgal positive HGSOC cells (c) following 6 days treatment with selected Olaparib concentrations (Supplementary Fig. 1A). d HGSOC cell morphology analyzed by flow cytometry following 6 days of treatment with Olaparib IC50 concentrations (see Supplementary Fig. 1A, E for details). e, f Levels of IL-6 (e), IL-8 (f) were measured by ELISA assay following 6 days treatment with Olaparib IC50 concentrations. g Number of γ-H2AX foci per nucleus in HGSOC cells lines following 6 days of treatment with Olaparib IC50 concentrations. h, i Analysis of 8-h (h) or 24-h (i) EdU pulse after 6 days exposure of HGSOC cells to Olaparib IC50 concentrations. j Flow cytometry analysis of cell cycle populations following 6 days exposure of HGSOC cells to Olaparib IC50 concentrations. Data in (a) are representative curves of at least three independent experiments. For all the data, the mean ± SEM of three independent experiments is shown. Data were analyzed using the two-tail Student t test. *Denotes p < 0.05, **p < 0.01, and ***p < 0.001
Fig. 1 Olaparib induces a senescence-like phenotype in HGSOC cell lines. a Cell proliferation curves of HGSOC H2B-GFP cell lines exposed to increasing concentrations of Olaparib. b, c HGSOC dead cells analyzed by flow cytometry (b) and SAβgal positive HGSOC cells (c) following 6 days treatment with selected Olaparib concentrations (Supplementary Fig. 1A). d HGSOC cell morphology analyzed by flow cytometry following 6 days of treatment with Olaparib IC50 concentrations (see Supplementary Fig. 1A, E for details). e, f Levels of IL-6 (e), IL-8 (f) were measured by ELISA assay following 6 days treatment with Olaparib IC50 concentrations. g Number of γ-H2AX foci per nucleus in HGSOC cells lines following 6 days of treatment with Olaparib IC50 concentrations. h, i Analysis of 8-h (h) or 24-h (i) EdU pulse after 6 days exposure of HGSOC cells to Olaparib IC50 concentrations. j Flow cytometry analysis of cell cycle populations following 6 days exposure of HGSOC cells to Olaparib IC50 concentrations. Data in (a) are representative curves of at least three independent experiments. For all the data, the mean ± SEM of three independent experiments is shown. Data were analyzed using the two-tail Student t test. *Denotes p < 0.05, **p < 0.01, and ***p < 0.001CC BY · PubMed Central
Fig. 2 Involvement of p21 and Chk2 in Olaparib-induced senescence. a, b Relative mRNA levels of p15, p16, p21, p27, and p57 (a) or Chk2 (b) evaluated by real-time Q-PCR in HGSOC cells treated with Olaparib IC50 concentrations for 6 days. The values represent the fold change expression related to nontreated controls. c, d Real-time Q-PCR showing gene silencing by shRNA against p21 (c) or Chk2 (d) in HGSOC cells. e, f Analysis of 8-h EdU pulse after 6 days exposure of shp21 (e) or shChk2 (f) infected HGSOC cells to Olaparib IC50 concentrations. g, h Number of γ-H2AX foci per nucleus in shp21 (g) or shChk2 (h) infected HGSOC cells treated with Olaparib IC50 concentrations for 6 days were determined by analyzing >150 cells per condition. i–j Flow cytometry analysis of DNA content following 6 days exposure of shp21 (i) or shChk2 (j) infected HGSOC cells to Olaparib IC50 concentrations. k, l Clonogenic assays were performed on shp21 (k) or shChk2 (l) infected HGSOC cells treated or not with Olaparib IC50 concentrations for 6 days. For all the data, the mean ± SEM of three independent experiments is shown. Data were analyzed using the two-tail Student t test. *Denotes p < 0.05, **p < 0.01, and ***p < 0.001
Fig. 2 Involvement of p21 and Chk2 in Olaparib-induced senescence. a, b Relative mRNA levels of p15, p16, p21, p27, and p57 (a) or Chk2 (b) evaluated by real-time Q-PCR in HGSOC cells treated with Olaparib IC50 concentrations for 6 days. The values represent the fold change expression related to nontreated controls. c, d Real-time Q-PCR showing gene silencing by shRNA against p21 (c) or Chk2 (d) in HGSOC cells. e, f Analysis of 8-h EdU pulse after 6 days exposure of shp21 (e) or shChk2 (f) infected HGSOC cells to Olaparib IC50 concentrations. g, h Number of γ-H2AX foci per nucleus in shp21 (g) or shChk2 (h) infected HGSOC cells treated with Olaparib IC50 concentrations for 6 days were determined by analyzing >150 cells per condition. i–j Flow cytometry analysis of DNA content following 6 days exposure of shp21 (i) or shChk2 (j) infected HGSOC cells to Olaparib IC50 concentrations. k, l Clonogenic assays were performed on shp21 (k) or shChk2 (l) infected HGSOC cells treated or not with Olaparib IC50 concentrations for 6 days. For all the data, the mean ± SEM of three independent experiments is shown. Data were analyzed using the two-tail Student t test. *Denotes p < 0.05, **p < 0.01, and ***p < 0.001CC BY · PubMed Central
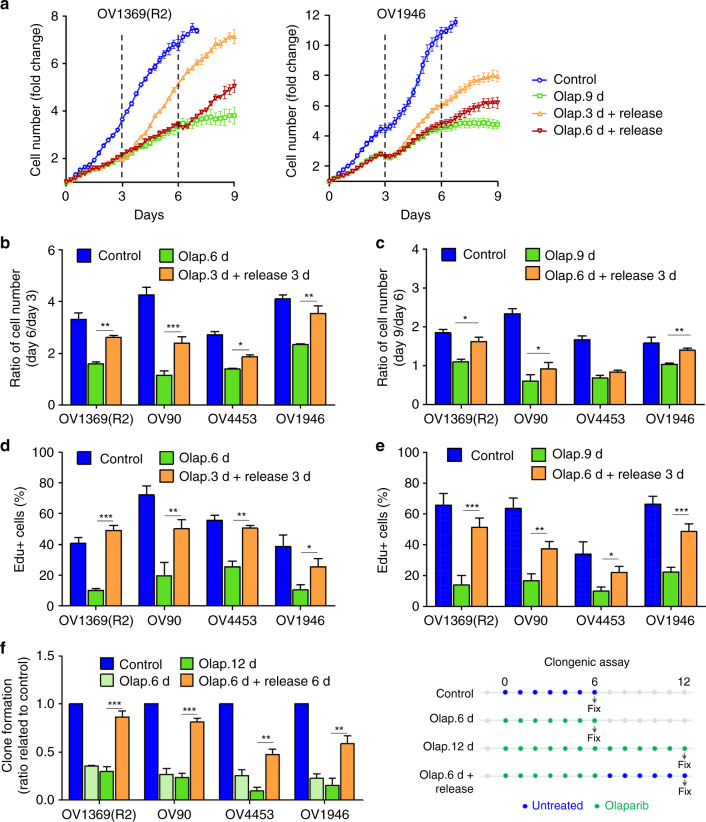
Fig. 3 Senescent phenotype induced by Olaparib is reversible. a Representative proliferation curves of HGSOC H2B-GFP cells treated with Olaparib IC50 concentrations for 9 days (9 d), or treated for 3 and 6 days (3 and 6 d) then without for the remaining days (Release). b–e Fold change in cell number (b, c) and analysis of 8-h EdU pulse (d, e) for HGSOC H2B-GFP cells treated with Olaparib IC50 for 6 days or 3 days then without for another 3 days (b, d); or treated with Olaparib IC50 for 9 days or 6 days then without for another 3 days (c, e). f Clonogenic assays were performed on untreated HGSOC cells, cells treated with Olaparib for 6 or 12 days, or treated with Olaparib for 6 days then without for the next 6 days. Data in (a) are representative curves of at least three independent experiments. For all the data, the mean ± SEM of three independent experiments is shown. Data were analyzed using the two-tail Student t test. *Denotes p < 0.05, **p < 0.01, and ***p < 0.001
Fig. 3 Senescent phenotype induced by Olaparib is reversible. a Representative proliferation curves of HGSOC H2B-GFP cells treated with Olaparib IC50 concentrations for 9 days (9 d), or treated for 3 and 6 days (3 and 6 d) then without for the remaining days (Release). b–e Fold change in cell number (b, c) and analysis of 8-h EdU pulse (d, e) for HGSOC H2B-GFP cells treated with Olaparib IC50 for 6 days or 3 days then without for another 3 days (b, d); or treated with Olaparib IC50 for 9 days or 6 days then without for another 3 days (c, e). f Clonogenic assays were performed on untreated HGSOC cells, cells treated with Olaparib for 6 or 12 days, or treated with Olaparib for 6 days then without for the next 6 days. Data in (a) are representative curves of at least three independent experiments. For all the data, the mean ± SEM of three independent experiments is shown. Data were analyzed using the two-tail Student t test. *Denotes p < 0.05, **p < 0.01, and ***p < 0.001CC BY · PubMed Central
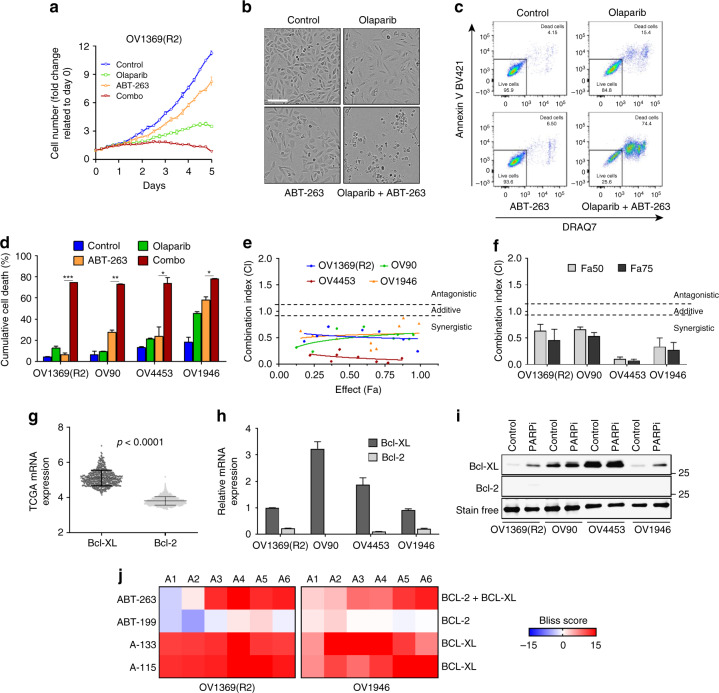
Fig. 4 Olaparib and Bcl2/Bcl-XL inhibitors are synergistic. a Cell proliferation curves of OV1369(R2) H2B-GFP cell line treated with Olaparib (10 µM), ABT-263 (0.25 µM), or Olaparib/ABT-263 (10/0.25 µM) for 6 days. b, c OV1369(R2) treated for 6 days with Olaparib (10 µM), ABT-263 (0.25 µM) or the combination Olaparib/ABT-263 (10/0.25 µM). Representative images of cell morphology and cell fate. Scale bar, 150 µm (b). Representative flow cytometry analysis of apoptosis showing DRAQ7 positive cell population (X-axis) and AnnexinV positive cells (Y-axis) (c). d Percentage of dead cells for all four HGSOC cell lines treated with their respective PARPi IC50 combined to ABT-263 (0.25 µM for OV1369(R2) and 2.5 µM for the other cell lines) analyzed by flow cytometry as in (c). e, f CI values for the entire fraction affected (Fa) (e) and the mean ± SEM of the CI at Fa 0.50/0.75 (f) of HGSOC cells expressing H2B-GFP for the combined treatment (Olaparib/ABT-263) at specific drug ratios (Supplementary Fig. 6B). g Comparison of BCL2 and BCLXL mRNA expression in HGSOC according to the TCGA dataset (530 samples, cBioPortal). h Relative mRNA expression of BCL2 and BCLXL evaluated by real-time Q-PCR in HGSOC cell lines. i Western blot analyses of Bcl-XL and Bcl2 proteins in HGSOC cells treated with Olaparib for 6 days. j Heat map of Bliss scores for combination treatments between Olaparib IC50 and different concentrations of ABT-263, ABT-199, A133, or A115 (see Supplementary Fig. 6D) of HGSOC cells expressing H2B-GFP. Data in (a–c, e, i) are a representation of at least three independent experiments. For all the data, the mean ± SEM of three independent experiments is shown. Data were analyzed using the two-tail Student t test. * Denotes p < 0.05, **p < 0.01, and ***p < 0.001
Fig. 4 Olaparib and Bcl2/Bcl-XL inhibitors are synergistic. a Cell proliferation curves of OV1369(R2) H2B-GFP cell line treated with Olaparib (10 µM), ABT-263 (0.25 µM), or Olaparib/ABT-263 (10/0.25 µM) for 6 days. b, c OV1369(R2) treated for 6 days with Olaparib (10 µM), ABT-263 (0.25 µM) or the combination Olaparib/ABT-263 (10/0.25 µM). Representative images of cell morphology and cell fate. Scale bar, 150 µm (b). Representative flow cytometry analysis of apoptosis showing DRAQ7 positive cell population (X-axis) and AnnexinV positive cells (Y-axis) (c). d Percentage of dead cells for all four HGSOC cell lines treated with their respective PARPi IC50 combined to ABT-263 (0.25 µM for OV1369(R2) and 2.5 µM for the other cell lines) analyzed by flow cytometry as in (c). e, f CI values for the entire fraction affected (Fa) (e) and the mean ± SEM of the CI at Fa 0.50/0.75 (f) of HGSOC cells expressing H2B-GFP for the combined treatment (Olaparib/ABT-263) at specific drug ratios (Supplementary Fig. 6B). g Comparison of BCL2 and BCLXL mRNA expression in HGSOC according to the TCGA dataset (530 samples, cBioPortal). h Relative mRNA expression of BCL2 and BCLXL evaluated by real-time Q-PCR in HGSOC cell lines. i Western blot analyses of Bcl-XL and Bcl2 proteins in HGSOC cells treated with Olaparib for 6 days. j Heat map of Bliss scores for combination treatments between Olaparib IC50 and different concentrations of ABT-263, ABT-199, A133, or A115 (see Supplementary Fig. 6D) of HGSOC cells expressing H2B-GFP. Data in (a–c, e, i) are a representation of at least three independent experiments. For all the data, the mean ± SEM of three independent experiments is shown. Data were analyzed using the two-tail Student t test. * Denotes p < 0.05, **p < 0.01, and ***p < 0.001CC BY · PubMed Central
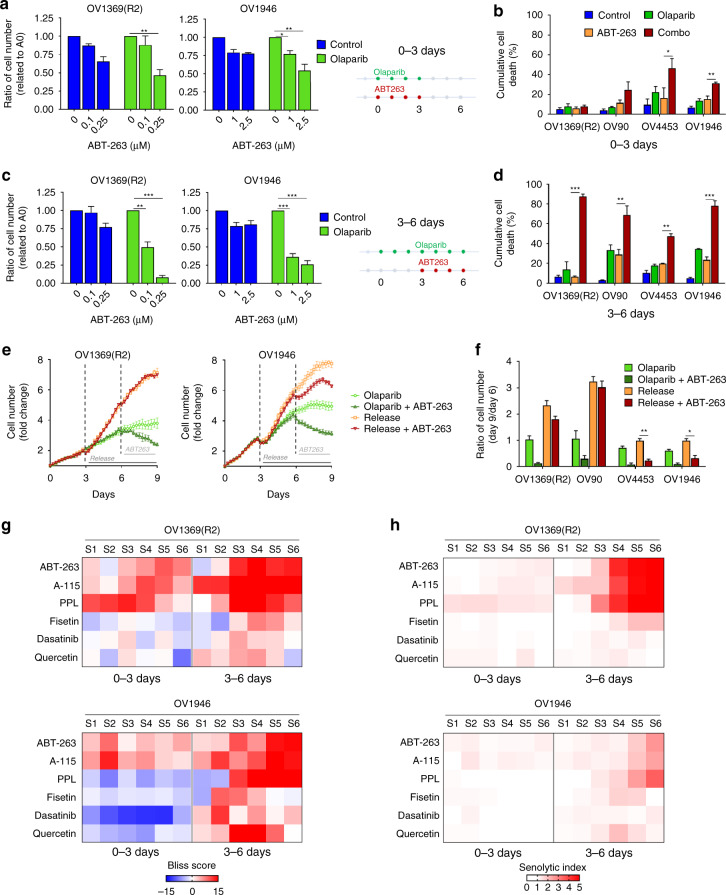
Fig. 5 Bcl2/Bcl-XL inhibitors specifically target Olaparib-induced senescent cells. a–d Fold change in cell number (a, c) and percentage of dead cells (b, d) on day-6 of treatment regimens indicated in a, c (right panels). e, f Representative proliferation curves (e) or fold change in cell number (f) of HGSOC H2B-GFP cells treated with Olaparib for 9 days (light green), or for 6 days and sequential addition of ABT-263 for the next 3 days (dark green), or treated with Olaparib for 3 days and then without for the next 6 days (orange), or treated with Olaparib for 3 days and sequential addition of ABT-263 for the next 6 days (red). g, h Heat map of Bliss scores (g) or Senolytic Indexes (h) for combination treatments between Olaparib IC50 concentrations and different concentrations of senolytics (see Supplementary Fig. 6D) for 3 days (0–3 days) or treated with Olaparib for 6 days with sequential addition of inhibitors after 3 days of Olaparib (3–6 days) of HGSOC cells expressing H2B-GFP. Data in (e) are representative curves of at least three independent experiments. For all the data, the mean ± SEM of three independent experiments is shown. Data were analyzed using the two-tail Student t test. * Denotes p < 0.05, **p < 0.01, and ***p < 0.001
Fig. 5 Bcl2/Bcl-XL inhibitors specifically target Olaparib-induced senescent cells. a–d Fold change in cell number (a, c) and percentage of dead cells (b, d) on day-6 of treatment regimens indicated in a, c (right panels). e, f Representative proliferation curves (e) or fold change in cell number (f) of HGSOC H2B-GFP cells treated with Olaparib for 9 days (light green), or for 6 days and sequential addition of ABT-263 for the next 3 days (dark green), or treated with Olaparib for 3 days and then without for the next 6 days (orange), or treated with Olaparib for 3 days and sequential addition of ABT-263 for the next 6 days (red). g, h Heat map of Bliss scores (g) or Senolytic Indexes (h) for combination treatments between Olaparib IC50 concentrations and different concentrations of senolytics (see Supplementary Fig. 6D) for 3 days (0–3 days) or treated with Olaparib for 6 days with sequential addition of inhibitors after 3 days of Olaparib (3–6 days) of HGSOC cells expressing H2B-GFP. Data in (e) are representative curves of at least three independent experiments. For all the data, the mean ± SEM of three independent experiments is shown. Data were analyzed using the two-tail Student t test. * Denotes p < 0.05, **p < 0.01, and ***p < 0.001CC BY · PubMed Central
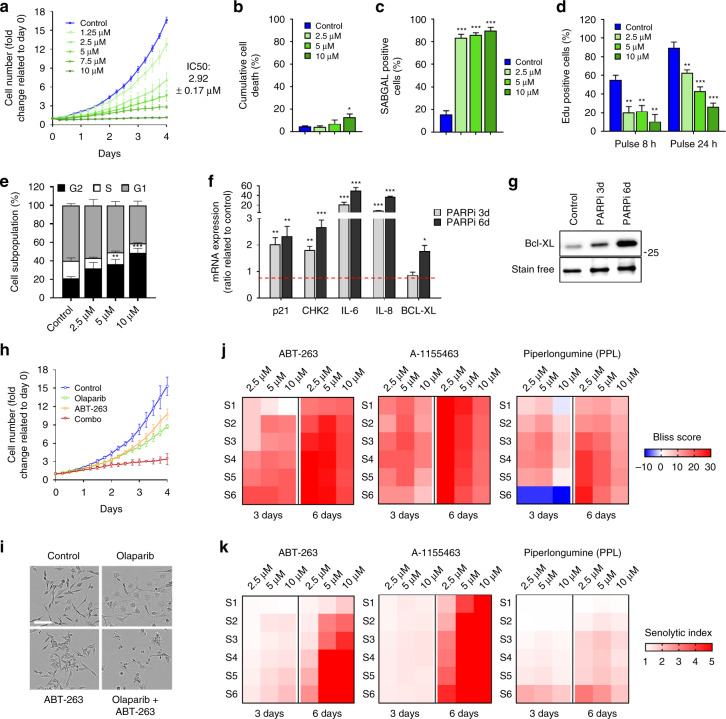
Fig. 6 Olaparib induces a targetable senescence-like phenotype in a TNBC cell line. a Proliferation response of MDA-MB-231 cells treated with different concentrations of Olaparib for 6 days with analysis of cell numbers every 6 h. Control = nontreated. b–e MDA-MB-231 cells were treated with 2.5, 5, and 10 µM Olaparib for 6 days. b Cumulative cell death was analyzed by flow cytometry. c SAβgal positive HGSOC cells were evaluated. d Analysis of 8 and 24-h EdU pulse. e Flow cytometry analysis of cell cycle populations. f Relative mRNA levels of p21, CHK2, IL-6, IL-8, or BCL-XL evaluated by real-time Q-PCR in MDA-MB-231 cells treated with 5 μM Olaparib for 3 and 6 days. The values represent the fold change expression compared to nontreated controls. g Western blot detection of Bcl-XL in MDA-MB-231 treated with 5 µM Olaparib for 3 or 6 days. Total protein stain was used as a loading control. h, i Cell proliferation curves (h) and representative images (i) of MDA-MB-231 H2B-GFP cells treated with Olaparib (2.5 µM), ABT-263 (0.25 µM), or Olaparib/ABT-263 (2.5/0.25 µM). Scale bar, 150 µm. j, k Heat map of Bliss scores (j) or Senolytic Indexes (k) for combination treatments between Olaparib at 2.5, 5, or 10 µM concentrations and different concentrations of senolytics (see Supplementary Fig. 12A) for 3 days (0–3 days), or 6 days in TNBC cells expressing H2B-GFP. Data in (a, g, h, i) are a representation of at least three independent experiments. For all the data, the mean ± SEM of three independent experiments is shown. Data were analyzed using the two-tail Student t test. * Denotes p < 0.05, **p < 0.01, and ***p < 0.001
Fig. 6 Olaparib induces a targetable senescence-like phenotype in a TNBC cell line. a Proliferation response of MDA-MB-231 cells treated with different concentrations of Olaparib for 6 days with analysis of cell numbers every 6 h. Control = nontreated. b–e MDA-MB-231 cells were treated with 2.5, 5, and 10 µM Olaparib for 6 days. b Cumulative cell death was analyzed by flow cytometry. c SAβgal positive HGSOC cells were evaluated. d Analysis of 8 and 24-h EdU pulse. e Flow cytometry analysis of cell cycle populations. f Relative mRNA levels of p21, CHK2, IL-6, IL-8, or BCL-XL evaluated by real-time Q-PCR in MDA-MB-231 cells treated with 5 μM Olaparib for 3 and 6 days. The values represent the fold change expression compared to nontreated controls. g Western blot detection of Bcl-XL in MDA-MB-231 treated with 5 µM Olaparib for 3 or 6 days. Total protein stain was used as a loading control. h, i Cell proliferation curves (h) and representative images (i) of MDA-MB-231 H2B-GFP cells treated with Olaparib (2.5 µM), ABT-263 (0.25 µM), or Olaparib/ABT-263 (2.5/0.25 µM). Scale bar, 150 µm. j, k Heat map of Bliss scores (j) or Senolytic Indexes (k) for combination treatments between Olaparib at 2.5, 5, or 10 µM concentrations and different concentrations of senolytics (see Supplementary Fig. 12A) for 3 days (0–3 days), or 6 days in TNBC cells expressing H2B-GFP. Data in (a, g, h, i) are a representation of at least three independent experiments. For all the data, the mean ± SEM of three independent experiments is shown. Data were analyzed using the two-tail Student t test. * Denotes p < 0.05, **p < 0.01, and ***p < 0.001CC BY · PubMed Central
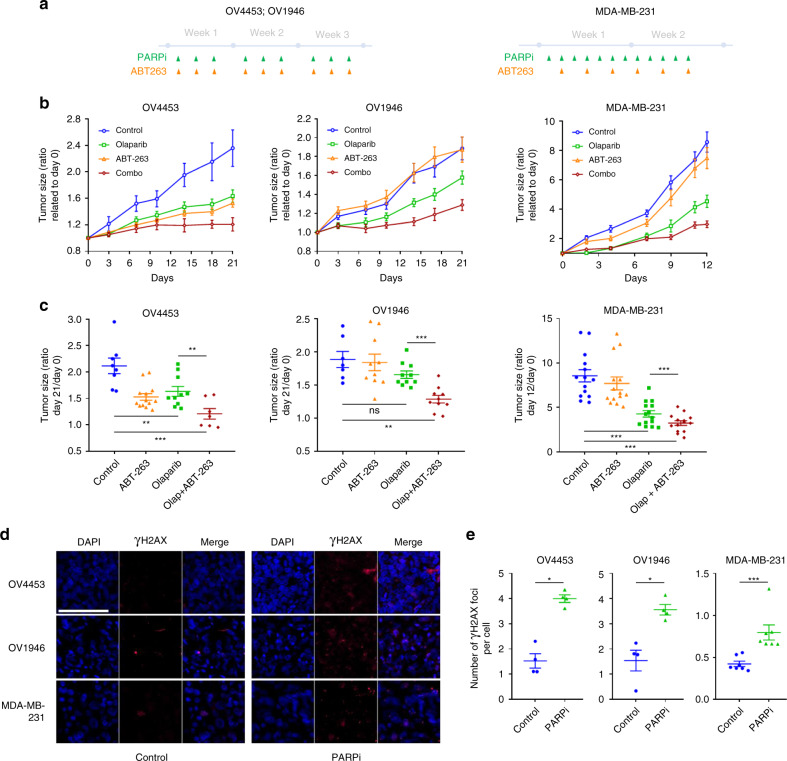
Fig. 7 In vivo synthetic lethal interactions between PARP inhibition and cancer cell senescence. a Treatments time line of OV4453, OV1946 and MDA-MB-231. b Changes of OV4453, OV1946, and MDA-MB-231 tumor size after Olaparib (green, n = 12 for OV4453 and OV1946; n = 16 for MDA-MB-231), ABT-263 (orange, n = 7 for OV4453 and OV1946; n = 16 for MDA-MB-231), combination Olaparib + ABT-263 (red, n = 10 for OV4453 and OV1946; n = 16 for MDA-MB-231) or DMSO (blue, n = 8 for OV4453 and OV1946; n = 16 for MDA-MB-231). c Tumor size ratio between the first and the last day of treatment for each xenograft. d, e Representative images (d) and quantification (e) of γ-H2AX foci per nucleus in OV4453, OV1946, and MDA-MB-231 xenografts harvested two weeks after the first day of treatment. Scale bar, 100 µm. Data in (c) were analyzed using the two way ANOVA test with Bonferroni post-test correction. Complete statistics are supplied in Supplementary Tables 1–3. Data in (e) were analyzed using the two-tail Student t test. *Denotes p < 0.05, **p < 0.01, and ***p < 0.001
Fig. 7 In vivo synthetic lethal interactions between PARP inhibition and cancer cell senescence. a Treatments time line of OV4453, OV1946 and MDA-MB-231. b Changes of OV4453, OV1946, and MDA-MB-231 tumor size after Olaparib (green, n = 12 for OV4453 and OV1946; n = 16 for MDA-MB-231), ABT-263 (orange, n = 7 for OV4453 and OV1946; n = 16 for MDA-MB-231), combination Olaparib + ABT-263 (red, n = 10 for OV4453 and OV1946; n = 16 for MDA-MB-231) or DMSO (blue, n = 8 for OV4453 and OV1946; n = 16 for MDA-MB-231). c Tumor size ratio between the first and the last day of treatment for each xenograft. d, e Representative images (d) and quantification (e) of γ-H2AX foci per nucleus in OV4453, OV1946, and MDA-MB-231 xenografts harvested two weeks after the first day of treatment. Scale bar, 100 µm. Data in (c) were analyzed using the two way ANOVA test with Bonferroni post-test correction. Complete statistics are supplied in Supplementary Tables 1–3. Data in (e) were analyzed using the two-tail Student t test. *Denotes p < 0.05, **p < 0.01, and ***p < 0.001CC BY · PubMed Central
Fig. 8 Model of targetable PARPi reversible senescence. The combination of PARPi and a senolytic was effective in preclinical models of ovarian cancer suggesting that coupling these synthetic lethalities provides a rational approach to their clinical use and may together be more effective in limiting resistance
Fig. 8 Model of targetable PARPi reversible senescence. The combination of PARPi and a senolytic was effective in preclinical models of ovarian cancer suggesting that coupling these synthetic lethalities provides a rational approach to their clinical use and may together be more effective in limiting resistanceCC BY · PubMed Central

Verification

Claims the paper makes

The claims and statistics of this paper haven’t been checked yet.

Free: it reads the open-access text and checks the first 5 claims that cite a source we can check. Create a free account to check every claim.

A few free checks a day · papers already verified open instantly · results are public

Claims other papers make about this one

Each is checked against this paper’s own text: does it say what the citing paper says it does?

Self-check

Percentages, sums and reported differences re-computed from the paper’s own numbers.

The self-check needs the paper’s full text.

Citations

Cites

Show all 57 references

Cited by

See all 246

Metadata

Authors
Fleury, H., Malaquin, N., Tu, V., Gilbert, S., Martinez, A., Olivier, M.-A., Sauriol, S. A., Communal, L., Leclerc-Desaulniers, K., Carmona, E., Provencher, D., Mes-Masson, A.-M., & Rodier, F.
Affiliations
Centre Hospitalier de l’Université de Montréal (CA)
Venue
Nature Communications
Published
2019-06-11
Volume
10
Issue
1
Pages
2556-2556
ISSN
2041-1723 (ISSN-L)
OpenAlex
W2951114010
Cited by
228
References
57
Citations by year
2026: 28 · 2025: 29 · 2024: 35 · 2023: 34 · 2022: 27 · 2021: 44 · 2020: 26 · 2019: 5
FWCI
10.64
Type
journal article
Language
en
Open access
Licence
Locations
  • Nature Communications (publishedVersion, cc-by)
  • Europe PMC (PubMed Central) (publishedVersion, cc-by)
  • PubMed Central (publishedVersion, cc-by)
  • PubMed (publishedVersion)
  • RePEc: Research Papers in Economics (submittedVersion)
  • DOAJ (DOAJ: Directory of Open Access Journals) (submittedVersion)
  • DOAJ (DOAJ: Directory of Open Access Journals) (submittedVersion, cc-by-sa)
Funders
  • Cancer Research Society (22713, 20087)
  • Terry Fox Research Institute
  • Institut Du Cancer de Montréal
  • Fonds de Recherche du Québec - Santé (33070, 22624)
  • Institute of Cancer Research
Topics
  • Health Sciences › Medicine › Oncology › PARP inhibition in cancer therapy
  • Life Sciences › Biochemistry, Genetics and Molecular Biology › Cell Biology › Telomeres, Telomerase, and Senescence
  • Life Sciences › Biochemistry, Genetics and Molecular Biology › Molecular Biology › Cell death mechanisms and regulation
Keywords
synthetic lethality, PARP inhibitors, senescence-associated secretory phenotype, senolytics, ovarian cancer, breast cancer, p53-independent senescence, Bcl-xL, apoptosis resistance, Chk2, p21, DNA repair, drug resistance
MeSH terms
Poly(ADP-ribose) Polymerase Inhibitors, Synthetic Lethal Mutations, Antineoplastic Agents, Breast Neoplasms, DNA Repair, Female, Humans, Ovarian Neoplasms, Cellular Senescence, Apoptosis, Drug Resistance, Neoplasm, Cell Line, Tumor, Cell Proliferation

About these checks

Registry, retraction, Cites and statistics results are computed, not judged, with one exception: a printed reference that no index lists is read once by a model before it counts as a citation error. Claims are extracted by a model and kept only when their quote appears verbatim in the text; each cited source is then checked, with a model’s help, for whether it says what the claim relies on. Those verdicts can be wrong — read the claim’s quote and the cited source before relying on one.

Statistics and arithmetic are recomputed, not judged.

Confidence bands are shown only for fields calibrated on our annotated test set. None is calibrated yet, so no band is shown.

What counts as a claim ›How we measure confidence ›How we check this ›

Are you an author, or do you see a problem with this page? Request a review

How to cite

Cite CoChat for the checks on this page, and the paper for its own findings.

This page
CoChat. (2026). Citation check: Exploiting interconnected synthetic lethal interactions between PARP inhibition and cancer cell reversible senescence. https://app.cochat.ai/papers/10.1038/s41467-019-10460-1
The paper
Fleury, H., Malaquin, N., Tu, V., Gilbert, S., Martinez, A., Olivier, M.-A., Sauriol, S. A., Communal, L., Leclerc-Desaulniers, K., Carmona, E., Provencher, D., Mes-Masson, A.-M., & Rodier, F. (2019). Exploiting interconnected synthetic lethal interactions between PARP inhibition and cancer cell reversible senescence. Nature Communications. https://doi.org/10.1038/s41467-019-10460-1

Data sources

Bibliographic data: Semantic Scholar, OpenAlex, Crossref.

Contains information from the Semantic Scholar Academic Graph Datasets, made available under the ODC Attribution License (ODC-BY 1.0).

Semantic Scholar’s data is described in: Kinney, R., et al. (2023). The Semantic Scholar Open Data Platform. arXiv:2301.10140.