

The DOI matches its Crossref record; 52 of the 53 references it cites were found in a registry or an index.
Analysis of polygenic risk score usage and performance in diverse human populations
Open accessPublished version of a preprint
Abstract
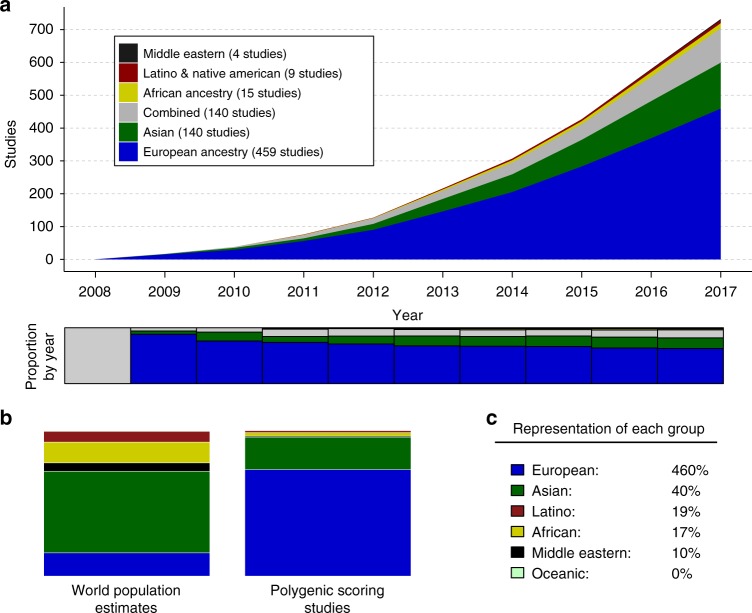
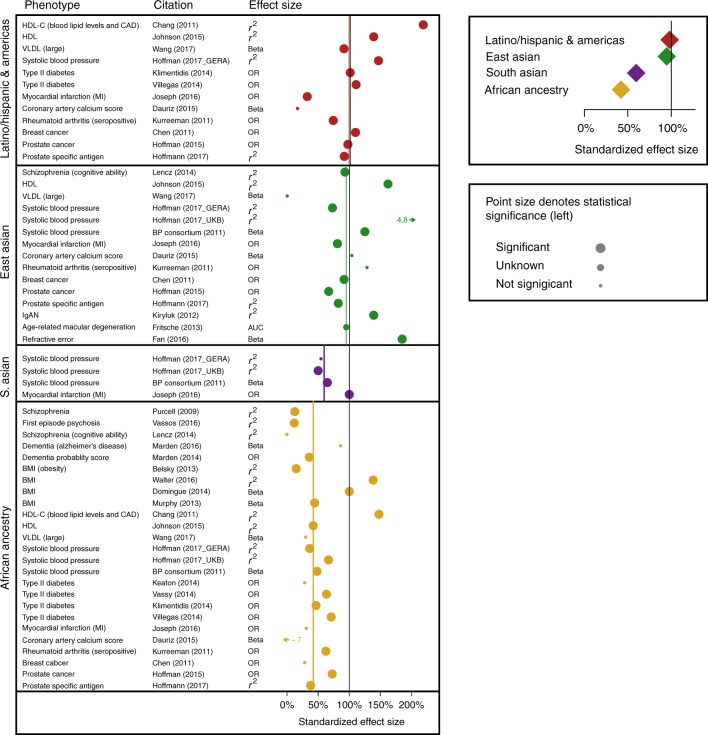
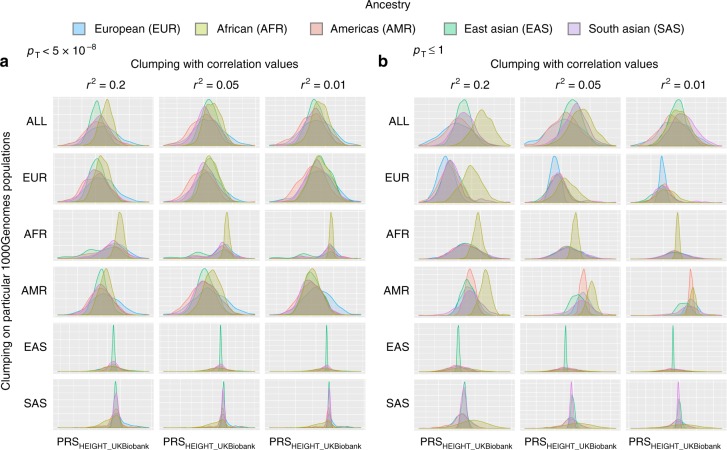
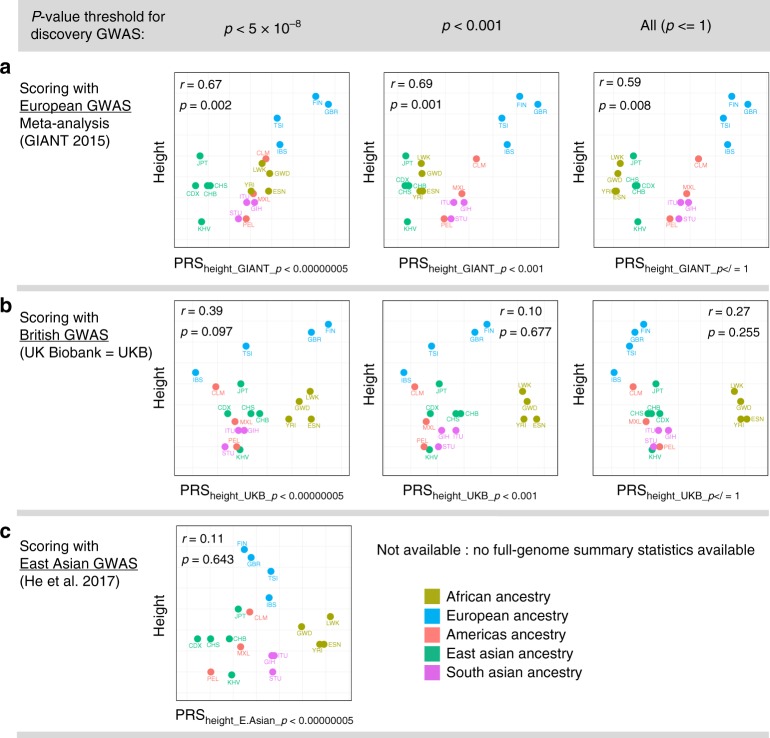
A historical tendency to use European ancestry samples hinders medical genetics research, including the use of polygenic scores, which are individual-level metrics of genetic risk. We analyze the first decade of polygenic scoring studies (2008–2017, inclusive), and find that 67% of studies included exclusively European ancestry participants and another 19% included only East Asian ancestry participants. Only 3.8% of studies were among cohorts of African, Hispanic, or Indigenous peoples. We find that predictive performance of European ancestry-derived polygenic scores is lower in non-European ancestry samples (e.g. African ancestry samples: t = −5.97, df = 24, p = 3.7 × 10 −6 ), and we demonstrate the effects of methodological choices in polygenic score distributions for worldwide populations. These findings highlight the need for improved treatment of linkage disequilibrium and variant frequencies when applying polygenic scoring to cohorts of non-European ancestry, and bolster the rationale for large-scale GWAS in diverse human populations.
Overview
The claims and statistics of this paper haven’t been checked yet.
Run the check — free, no account needed. It reads the open-access text and checks the sources it cites.
Integrity signals
Registry
Cites
Statistics
Figures
Verification
Claims the paper makes
The claims and statistics of this paper haven’t been checked yet.
Run the check — free, no account needed. It reads the open-access text and checks the sources it cites.
Claims other papers make about this one
Each is checked against this paper’s own text: does it say what the citing paper says it does?
The source backs part of the claim, not all of it — or backs it for a different population, condition or comparison.
In the citing paper
“PGIs like ours that are constructed from GWAS in samples of European genetic ancestries are generally found to have much lower predictive power in samples with other genetic ancestries; for example, on average across phenotypes, estimates of relative accuracy (ratio of R2) in African-genetic-ancestry to European-genetic-ancestry samples have been 22%23 and 36%24.”
From Polygenic prediction of educational attainment within and between families from genome-wide association analyses in 3 million individuals (2022) · cites this paper as [24]
Experimental — accuracy not yet measuredIn the citing paper
“Then, each original variable used in the models was put in linear regressions with the 20 first principal components of the SNP genotype data to correct for population stratification (associations of environmental effects with genetic structure due to geographic separation, population mixtures, and migrations that occurred throughout our evolutionary history)91,92, as well as with the age of the”
From The impact of digital media on children’s intelligence while controlling for genetic differences in cognition and socioeconomic background (2022) · cites this paper as [91]
Self-check
Percentages, sums and reported differences re-computed from the paper’s own numbers.
The self-check needs the paper’s full text.
Citations
Cites
PLINK: a tool set for whole-genome association and population-based linkage analyses.
Purcell, S., Neale, B., Todd-Brown, K., Thomas, L., Ferreira, M. A. R., Bender, D., Maller, J., Sklar, P., de Bakker, P. I. W., Daly, M. J., et al. (2007) · The American Journal of Human Genetics · doi:10.1086/519795 · Cited by 34,089
A global reference for human genetic variation
The 1000 Genomes Project Consortium, authors, C., Auton, A., Abecasis, G. R., Steering committee, Altshuler, D. M., Durbin, R. M., Abecasis, G. R., Bentley, D. R., Chakravarti, A., et al. (2015) · Nature · doi:10.1038/nature15393 · Cited by 18,247
Second-generation PLINK: rising to the challenge of larger and richer datasets
Chang, C. C., Chow, C. C., Tellier, L. C., Vattikuti, S., Purcell, S. M., & Lee, J. J. (2015) · Gigascience · doi:10.1186/s13742-015-0047-8 · Cited by 12,709
The UK Biobank resource with deep phenotyping and genomic data
Bycroft, C., Freeman, C., Petkova, D., Band, G., Elliott, L. T., Sharp, K., Motyer, A., Vukcevic, D., Delaneau, O., O’Connell, J., et al. (2018) · Nature · doi:10.1038/s41586-018-0579-z · Cited by 8,876
A map of human genome variation from population-scale sequencing.
The 1000 Genomes Project Consortium (2010) · Nature · doi:10.1038/nature09534 · Cited by 7,877
Biological insights from 108 schizophrenia-associated genetic loci
Schizophrenia Working Group of the Psychiatric Genomics Consortium (2014) · Nature · doi:10.1038/nature13595 · Cited by 7,577
Common polygenic variation contributes to risk of schizophrenia and bipolar disorder
The International Schizophrenia Consortium (2009) · Nature · doi:10.1038/nature08185 · Cited by 4,821 · cited 1×
“2 (see schizophrenia and Purcell 2009 in the citation information for this point).”
BackgroundeQTLGen, Wray, N. R., 23andMe, the Major Depressive Disorder Working Group of the Psychiatric Genomics Consortium, Ripke, S., Mattheisen, M., Trzaskowski, M., Byrne, E. M., Abdellaoui, A., Adams, M. J., et al. (2018) · Nature Genetics · doi:10.1038/s41588-018-0090-3 · Cited by 3,005
Clinical use of current polygenic risk scores may exacerbate health disparities
Martin, A. R., Kanai, M., Kamatani, Y., Okada, Y., Neale, B. M., & Daly, M. J. (2019) · Nature Genetics · doi:10.1038/s41588-019-0379-x · Cited by 2,821
Blundell, J. E., Baker, J. L., Boyland, E. J., Blaak, E. E., Charzewska, J., Henauw, S. D., Frühbeck, G., González‐Gross, M., Hebebrand, J., Holm, L., et al. (2017) · Obesity Facts · doi:10.1159/000455952 · Cited by 1,983
Cited by
Sorted by citations
Items 201–300 of 999
Exploring AI in metasurface structures with forward and inverse design
Yang, G., Xiao, Q., Zhang, Z., Yu, Z., Wang, X., & Lu, Q. (2025) · iScience · doi:10.1016/j.isci.2025.111995 · Cited by 43
The Role of Electronic Health Records in Advancing Genomic Medicine
Linder, J. E., Bastarache, L. A., Hughey, J., & Peterson, J. F. (2021) · Annual Review of Genomics and Human Genetics · doi:10.1146/annurev-genom-121120-125204 · Cited by 42
Lali, R., Chong, M., Omidi, A., Mohammadi‐Shemirani, P., Le, A., Cui, E., & Paré, G. (2021) · Nature Communications · doi:10.1038/s41467-021-26114-0 · Cited by 38
The Propagation of Racial Disparities in Cardiovascular Genomics Research
Clarke, S. L., Assimes, T. L., & Tcheandjieu, C. (2021) · Circulation Genomic and Precision Medicine · doi:10.1161/circgen.121.003178 · Cited by 35
Psychotic disorders as a framework for precision psychiatry
Coutts, F., Koutsouleris, N., & McGuire, P. K. (2023) · Nature Reviews Neurology · doi:10.1038/s41582-023-00779-1 · Cited by 40
Polygenic Risk Scores for Glaucoma Onset in the Ocular Hypertension Treatment Study
Singh, R. K., Zhao, Y., Elze, T., Fingert, J. H., Gordon, M. O., Kass, M. A., Luo, Y., Pasquale, L. R., Scheetz, T. E., Segrè, A. V., et al. (2024) · JAMA Ophthalmology · doi:10.1001/jamaophthalmol.2024.0151 · Cited by 41
Jin, J., Zhan, J., Zhang, J., Zhao, R., O’Connell, J., Jiang, Y., Aslibekyan, S. W., Auton, A., Babalola, E., Bell, R. K., et al. (2024) · Cell Genomics · doi:10.1016/j.xgen.2024.100539 · Cited by 37
African‐specific improvement of a polygenic hazard score for age at diagnosis of prostate cancer
Karunamuni, R. A., Huynh‐Le, M., Fan, C. C., Thompson, W., Eeles, R. A., Kote‐Jarai, Z., Muir, K. R., Collaborators, U., Lophatananon, A., Tangen, C. M., et al. (2020) · International Journal of Cancer · doi:10.1002/ijc.33282 · Cited by 32
Publicly Available hiPSC Lines with Extreme Polygenic Risk Scores for Modeling Schizophrenia
Dobrindt, K., Zhang, H., Das, D., Abdollahi, S., Prorok, T., Ghosh, S. D., Weintraub, S. J., Genovese, G., Powell, S. K., Lund, A. N., et al. (2020) · Complex Psychiatry · doi:10.1159/000512716 · Cited by 32
Akingbuwa, W. A., Hammerschlag, A. R., Bartels, M., & Middeldorp, C. M. (2021) · Journal of the American Academy of Child & Adolescent Psychiatry · doi:10.1016/j.jaac.2021.03.020 · Cited by 38
Performance of polygenic risk scores for cancer prediction in a racially diverse academic biobank
Wang, L. L., Desai, H., Verma, S. S., et al. (2021) · Genetics in Medicine · doi:10.1016/j.gim.2021.10.015 · Cited by 35
Natri, H. M., Hudjashov, G., Jacobs, G., Kusuma, P., Saag, L., Darusallam, C. C., Metspalu, M., Sudoyo, H., Cox, M. P., Gallego Romero, I., et al. (2022) · The American Journal of Human Genetics · doi:10.1016/j.ajhg.2021.11.017 · Cited by 33
“The Am Connecting regulatory variants to complex traits Differences in genetic architecture between populations, including differences in allele frequencies and patterns of LD, are known to limit the transferability of GWASs and polygenic risk scores across populations.(1,4) Thus, we sought to examine how the differen…”
BackgroundChapman, C. R. (2022) · Journal of Community Genetics · doi:10.1007/s12687-022-00625-9 · Cited by 36
Methodologies underpinning polygenic risk scores estimation: a comprehensive overview
Sima, C. A. A. N., Step, K., Swart, Y., Schurz, H., Uren, C., & Möller, M. (2024) · Human Genetics · doi:10.1007/s00439-024-02710-0 · Cited by 34
Genomic Risk Score impact on susceptibility to systemic sclerosis
Bossini‐Castillo, L., Villanueva-Martín, G., Kerick, M., Acosta‐Herrera, M., López‐Isac, E., Simeón‐Aznar, C. P., Ortego‐Centeno, N., Assassi, S., Hunzelmann, N., Gabrielli, A., et al. (2020) · Annals of the Rheumatic Diseases · doi:10.1136/annrheumdis-2020-218558 · Cited by 34
Gao, Y., Wei, Y., Zhou, X., Huang, S., Zhao, H., & Zeng, P. (2020) · Frontiers in Genetics · doi:10.3389/fgene.2020.583106 · Cited by 33
Biomarkers of neurodegeneration across the Global South
McGlinchey, E., Duran-Aniotz, C., Akinyemi, R., Arshad, F., Zimmer, E. R., Cho, H., Adewale, B. A., & Ibanez, A. (2024) · The Lancet Healthy Longevity · doi:10.1016/s2666-7568(24)00132-6 · Cited by 32
Faro, V. L., Bhattacharya, A., Zhou, W., Zhou, D., Wang, Y., Läll, K., Kanai, M., Lopera-Maya, E. A., Straub, P., Pawar, P. P., et al. (2024) · Cell Reports Medicine · doi:10.1016/j.xcrm.2024.101430 · Cited by 37
Importance of Genetic Studies of Cardiometabolic Disease in Diverse Populations
Fernández‐Rhodes, L., Young, K. L., Lilly, A. G., Raffield, L. M., Highland, H. M., Wojcik, G. L., Agler, C. S., Love, S.-A. M., Okello, S., Petty, L. E., et al. (2020) · Circulation Research · doi:10.1161/circresaha.120.315893 · Cited by 33
Toseeb, U., Oginni, O. A., & Dale, P. S. (2021) · Journal of Learning Disabilities · doi:10.1177/00222194211019961 · Cited by 31
Human genetic admixture through the lens of population genomics
Gopalan, S., Smith, S. P., Korunes, K. L., Hamid, I., Ramachandran, S., & Goldberg, A. (2022) · Philosophical Transactions of the Royal Society B Biological Sciences · doi:10.1098/rstb.2020.0410 · Cited by 37
Perez, B. C., Bink, M. C. A. M., Svenson, K. L., Churchill, G. A., & Calus, M. P. L. (2022) · G3 Genes Genomes Genetics · doi:10.1093/g3journal/jkac039 · Cited by 31
Concerns about the use of polygenic embryo screening for psychiatric and cognitive traits
Lencz, T., Sabatello, M., Docherty, A. R., Peterson, R. E., Soda, T., Austin, J., Bierut, L. J., Crepaz‐Keay, D., Curtis, D., Degenhardt, F., et al. (2022) · The Lancet Psychiatry · doi:10.1016/s2215-0366(22)00157-2 · Cited by 39
Self-citationImplicit bias of encoded variables: frameworks for addressing structured bias in EHR–GWAS data
Dueñas, H. R., Seah, C., Johnson, J. S., & Huckins, L. M. (2020) · Human Molecular Genetics · doi:10.1093/hmg/ddaa192 · Cited by 31
Lee, P. H., Doyle, A. E., Li, X., Silberstein, M., Jung, J.-Y., Gollub, R. L., Nierenberg, A. A., Liu, R. T., Kessler, R. C., Perlis, R. H., et al. (2022) · Biological Psychiatry · doi:10.1016/j.biopsych.2021.11.026 · Cited by 30
“Furthermore, GWAS data of 8 psychiatric disorders were based on European descendants, which may bias PRS analysis when applied to non-European individuals owing to differences in causal variants, effect estimates, and linkage disequilibrium structure between populations (42,44,45).”
Human height: a model common complex trait
Conery, M., & Grant, S. F. A. (2023) · Annals of Human Biology · doi:10.1080/03014460.2023.2215546 · Cited by 36
Genetic control of DNA methylation is largely shared across European and East Asian populations
Hatton, A. A., Cheng, F., Lin, T., Shen, R., Chen, J., Zheng, Z., Qu, J., Lyu, F., Harris, S. E., Cox, S. R., et al. (2024) · Nature Communications · doi:10.1038/s41467-024-47005-0 · Cited by 39
Predicting the Future of Genetic Risk Profiling of Glaucoma
Han, X., Hewitt, A. W., & MacGregor, S. (2020) · JAMA Ophthalmology · doi:10.1001/jamaophthalmol.2020.5404 · Cited by 31
Impact of autism genetic risk on brain connectivity: a mechanism for the female protective effect
Lawrence, K. E., Hernandez, L. M., Fuster, E., Padgaonkar, N. T., Patterson, G., Jung, J., Okada, N. J., Lowe, J. K., Hoekstra, J. N., Jack, A., et al. (2021) · Brain · doi:10.1093/brain/awab204 · Cited by 35
Genetics of Alzheimer’s Disease in the African American Population
Logue, M. W., Dasgupta, S., & Farrer, L. A. (2023) · Journal of Clinical Medicine · doi:10.3390/jcm12165189 · Cited by 29
Barr, P. B., Driver, M. N., Kuo, S. I., Stephenson, M. E., Alıev, F., Linnér, R. K., Marks, J. A., Anokhin, A. P., Bucholz, K. K., Chan, G., et al. (2022) · Molecular Psychiatry · doi:10.1038/s41380-022-01801-6 · Cited by 35
Pharmacogenomic scores in psychiatry: systematic review of current evidence
Sharew, N. T., Clark, S. R., Schubert, K. O., & Amare, A. T. (2024) · Translational Psychiatry · doi:10.1038/s41398-024-02998-6 · Cited by 36
Polygenic risk scoring of human embryos: a qualitative study of media coverage
Pagnaer, T., Siermann, M., Borry, P., & Tšuiko, O. (2021) · BMC Medical Ethics · doi:10.1186/s12910-021-00694-4 · Cited by 25
Canalization of the Polygenic Risk for Common Diseases and Traits in the UK Biobank Cohort
Nagpal, S., Tandon, R., & Gibson, G. C. (2022) · Molecular Biology and Evolution · doi:10.1093/molbev/msac053 · Cited by 29
Towards a global view of multiple sclerosis genetics
Jacobs, B. M., Peter, M., Giovannoni, G., Noyce, A. J., Morris, H. R., & Dobson, R. (2022) · Nature Reviews Neurology · doi:10.1038/s41582-022-00704-y · Cited by 31
McAdams, T. A., Cheesman, R., & Ahmadzadeh, Y. I. (2022) · Journal of Child Psychology and Psychiatry · doi:10.1111/jcpp.13720 · Cited by 38
Algorithm Fairness in AI for Medicine and HealthcarePreprint
Chen, R. J., Chen, T., Lipková, J., Wang, J. J., Williamson, D. F. K., Lu, M. Y., Sahai, S., & Mahmood, F. (2021) · arXiv (Cornell University) · doi:10.48550/arxiv.2110.00603 · Cited by 31
The “Golden Age” of Behavior Genetics?
Charney, E. (2022) · Perspectives on Psychological Science · doi:10.1177/17456916211041602 · Cited by 31
A Guide for Understanding and Designing Mendelian Randomization Studies in the Musculoskeletal Field
Hartley, A. E., Power, G. M., Sanderson, E. C. M., & Smith, G. D. (2022) · JBMR Plus · doi:10.1002/jbm4.10675 · Cited by 32
Integration of polygenic and gut metagenomic risk prediction for common diseases
Liu, Y., Ritchie, S. C., Teo, S. M., Ruuskanen, M. O., Kambur, O., Zhu, Q., Sanders, J. G., Vázquez‐Baeza, Y., Verspoor, K. M., Jousilahti, P., et al. (2024) · Nature Aging · doi:10.1038/s43587-024-00590-7 · Cited by 35
Domingue, B. W., & Fletcher, J. M. (2020) · Behavior Genetics · doi:10.1007/s10519-020-10000-4 · Cited by 28
Self-citationPopulation structure of indigenous inhabitants of Arabia
Mineta, K., Goto, K., Gojobori, T., & Alkuraya, F. S. (2021) · PLoS Genetics · doi:10.1371/journal.pgen.1009210 · Cited by 30
A Polygenic Risk Score to Predict Future Adult Short Stature Among Children
Lu, T., Forgetta, V., Wu, H., Perry, J. R. B., Ong, K. K., Greenwood, C. M. T., Timpson, N. J., Manousaki, D., & Richards, J. B. (2021) · The Journal of Clinical Endocrinology & Metabolism · doi:10.1210/clinem/dgab215 · Cited by 28
Polygenic scores for psychiatric disease: from research tool to clinical application
Andlauer, T. F. M., & Nöthen, M. M. (2020) · Medizinische Genetik · doi:10.1515/medgen-2020-2006 · Cited by 28
Herd, P., Mills, M. C., & Dowd, J. B. (2021) · Journal of Health and Social Behavior · doi:10.1177/00221465211018682 · Cited by 29
Polygenic risk scores: the future of cancer risk prediction, screening, and precision prevention
Wang, Y., Zhu, M., Ma, H., & Shen, H. (2021) · Medical Review · doi:10.1515/mr-2021-0025 · Cited by 32
Self-citationEthnic differences of genetic risk and smoking in lung cancer: two prospective cohort studies
Zhu, M., Lv, J., Huang, Y., Ma, H., Li, N., Wei, X., Ji, M., Ma, Z., Song, C., Wang, C., et al. (2023) · International Journal of Epidemiology · doi:10.1093/ije/dyad118 · Cited by 29
Self-citationThomas, M., Su, Y., Rosenthal, E. A., Sakoda, L. C., Schmit, S. L., Timofeeva, M. N., Chen, Z., Fernández–Rozadilla, C., Law, P., Murphy, N., et al. (2023) · Nature Communications · doi:10.1038/s41467-023-41819-0 · Cited by 33
Bowman‐Smart, H., Gyngell, C., Mand, C., Amor, D. J., Delatycki, M. B., & Savulescu, J. (2021) · The American Journal of Bioethics · doi:10.1080/15265161.2021.1996659 · Cited by 33
Race, science and (im)precision medicine
Adigbli, G. (2020) · Nature Medicine · doi:10.1038/s41591-020-1115-x · Cited by 28
Suzuki, K., Kakuta, Y., Naito, T., et al. (2021) · Inflammatory Bowel Diseases · doi:10.1093/ibd/izab004 · Cited by 28
Sewell, M. D. E., Sánchez, L. J., Shen, X., Edmondson-Stait, A. J., Green, C., Adams, M. J., Rifai, O. M., McIntosh, A. M., Lyall, D. M., Whalley, H. C., et al. (2021) · Brain Behavior and Immunity · doi:10.1016/j.bbi.2021.06.002 · Cited by 29
Pat, N., Riglin, L., Anney, R., Wang, Y., Barch, D. M., Thapar, A., & Stringaris, A. K. (2021) · Journal of the American Academy of Child & Adolescent Psychiatry · doi:10.1016/j.jaac.2021.08.019 · Cited by 28
Genetic and early environmental predictors of adulthood self-reports of trauma
Peel, A. J., Purves, K. L., Baldwin, J. R., Breen, G. D., Coleman, J. R. I., Pingault, J., Skelton, M., ter Kuile, A., Danese, A., & Eley, T. C. (2022) · The British Journal of Psychiatry · doi:10.1192/bjp.2021.207 · Cited by 29
Reddi, H. V., Wand, H., Funke, B., Zimmermann, M. T., Lebo, M. S., Qian, E., Shirts, B. H., Zou, Y. S., Zhang, B. M., Rose, N. C., et al. (2023) · Genetics in Medicine · doi:10.1016/j.gim.2023.100804 · Cited by 30
Vassy, J. L., Brunette, C. A., Lebo, M. S., MacIsaac, K., Yi, T., Danowski, M. E., Alexander, N. V. J., Cardellino, M. P., Christensen, K. D., Gala, M. K., et al. (2023) · The American Journal of Human Genetics · doi:10.1016/j.ajhg.2023.10.001 · Cited by 33
Genetic determinants of telomere length and cancer risk
Nelson, C. P., & Codd, V. (2020) · Current Opinion in Genetics & Development · doi:10.1016/j.gde.2020.02.007 · Cited by 29
Osterman, M. D., Kinzy, T. G., & Bailey, J. N. C. (2021) · Current Protocols · doi:10.1002/cpz1.126 · Cited by 27
Fang, S., Holmes, M. V., Gaunt, T. R., Smith, G. D., & Richardson, T. G. (2022) · eLife · doi:10.7554/elife.73951 · Cited by 27
Barlevy, D., Cenolli, I., Campbell, T., Furrer, R., Mukherjee, M., Kostick, K. M., Carmi, S., Lencz, T., Lázaro‐Muñoz, G., & Pereira, S. (2024) · Journal of Assisted Reproduction and Genetics · doi:10.1007/s10815-024-03074-0 · Cited by 26
Machine learning suggests polygenic risk for cognitive dysfunction in amyotrophic lateral sclerosis
Placek, K., Benatar, M. G., Wuu, J., Rampersaud, E., Hennessy, L., Deerlin, V. M. V., Grossman, M., Irwin, D. J., Elman, L. B., McCluskey, L. F., et al. (2020) · EMBO Molecular Medicine · doi:10.15252/emmm.202012595 · Cited by 27
Genetic Ancestry Inference and Its Application for the Genetic Mapping of Human Diseases
Suarez-Pajes, E., Usera, A. D.-D., Marcelino-Rodríguez, I., Guillén‐Guío, B., & Flores, C. (2021) · International Journal of Molecular Sciences · doi:10.3390/ijms22136962 · Cited by 29
Polygenic Prediction of Type 2 Diabetes in Africa
Chikowore, T., Ekoru, K., Vujkovi, M., Gill, D., Pirie, F. J., Young, E. H., Sandhu, M. S., McCarthy, M. I., Rotimi, C. N., Adeyemo, A., et al. (2022) · Diabetes Care · doi:10.2337/dc21-0365 · Cited by 26
Development of a polygenic risk score to improve detection of peripheral artery disease
Wang, F., Ghanzouri, I., Leeper, N. J., Tsao, P. S., & Ross, E. (2022) · Vascular Medicine · doi:10.1177/1358863x211067564 · Cited by 25
Genetic architecture of routinely acquired blood tests in a British South Asian cohort
Jacobs, B. M., Stow, D., Hodgson, S., Zöllner, J., Samuel, M., Kanoni, S., Bidi, S., Akhtar, S., Anwar, M., Arciero, E., et al. (2024) · Nature Communications · doi:10.1038/s41467-024-53091-x · Cited by 31
Update on the genetics of allergic diseases
Lawson, L. P., Parameswaran, S., Panganiban, R. A. M., Constantine, G. M., Weirauch, M. T., & Kottyan, L. C. (2025) · Journal of Allergy and Clinical Immunology · doi:10.1016/j.jaci.2025.03.012 · Cited by 33
Multi-ancestry genome-wide association analyses of polycystic ovary syndrome
Zhao, H., Xu, Y., Xue, B., Zhao, S., Zhang, M., Wu, X., Wang, T., Wen, Y., Li, S., Zhang, Q., et al. (2025) · Nature Genetics · doi:10.1038/s41588-025-02393-x · Cited by 28
Genes and environment in attachment
Picardi, A., Giuliani, E., & Gigantesco, A. (2020) · Neuroscience & Biobehavioral Reviews · doi:10.1016/j.neubiorev.2020.01.038 · Cited by 28
Matthews, L. J., Lebowitz, M. S., Ottman, R., & Appelbaum, P. S. (2021) · Social Psychology of Education · doi:10.1007/s11218-021-09632-z · Cited by 28
Has translational genomics come of age in Africa?
Kamp, M., Krause, A., & Ramsay, M. (2021) · Human Molecular Genetics · doi:10.1093/hmg/ddab180 · Cited by 26
Update on human genetic susceptibility to COVID-19: susceptibility to virus and response
Colona, V. L., Vasiliou, V., Watt, J. L., Novelli, G., & Reichardt, J. K. V. (2021) · Human Genomics · doi:10.1186/s40246-021-00356-x · Cited by 25
Kolin, D. A., Kulm, S., & Elemento, O. (2021) · Scientific Reports · doi:10.1038/s41598-021-00796-4 · Cited by 26
Searching for robust associations with a multi-environment knockoff filter
Li, S., Sesia, M., Romano, Y., Candès, E. J., & Sabatti, C. (2021) · Biometrika · doi:10.1093/biomet/asab055 · Cited by 30
Clarifying the causes of consistent and inconsistent findings in genetics
Dattani, S., Howard, D. M., Lewis, C. M., & Sham, P. C. (2022) · Genetic Epidemiology · doi:10.1002/gepi.22459 · Cited by 29
Evaluating indirect genetic effects of siblings using singletons
Howe, L. J., Evans, D. M., Hemani, G., Smith, G. D., & Davies, N. M. (2022) · PLoS Genetics · doi:10.1371/journal.pgen.1010247 · Cited by 25
COMMUTE: Communication-efficient transfer learning for multi-site risk prediction
Gu, T., Lee, P. H., & Duan, R. (2022) · Journal of Biomedical Informatics · doi:10.1016/j.jbi.2022.104243 · Cited by 29
Krebs, M. D., Appadurai, V., Hellberg, K.-L. G., Ohlsson, H., Steinbach, J., Pedersen, E. M., Werge, T. M., Sundquist, J., Sundquist, K., Border, R., et al. (2025) · The American Journal of Human Genetics · doi:10.1016/j.ajhg.2025.11.016 · Cited by 25
Quantitative Human Paleogenetics: What can Ancient DNA Tell us About Complex Trait Evolution?
Irving-Pease, E. K., Muktupavela, R., Dannemann, M., & Racimo, F. (2021) · Frontiers in Genetics · doi:10.3389/fgene.2021.703541 · Cited by 27
Iron and risk of dementia: Mendelian randomisation analysis in UK Biobank
Casanova, F., Tian, Q., Atkins, J. L., Wood, A. R., Williamson, D. S., Qian, Y., Zweibaum, D. A., Ding, J., Melzer, D. R., Ferrucci, L., et al. (2024) · Journal of Medical Genetics · doi:10.1136/jmg-2023-109295 · Cited by 21
Smit, A. K., Gokoolparsadh, A., McWhirter, R., Newett, L., Milch, V., Hermes, A., McInerney-Leo, A. M., & Newson, A. J. (2024) · Genetics in Medicine · doi:10.1016/j.gim.2024.101270 · Cited by 25
Ancestry effects on type 2 diabetes genetic risk inference in Hispanic/Latino populations
Chande, A. T., Rishishwar, L., Conley, A. B., Valderrama-Aguirre, A., Medina-Rivas, M. A., & Jordan, I. K. (2020) · BMC Medical Genetics · doi:10.1186/s12881-020-01068-0 · Cited by 29
Advances in integrative African genomics
Zhang, C., Hansen, M. E. B., & Tishkoff, S. A. (2021) · Trends in Genetics · doi:10.1016/j.tig.2021.09.013 · Cited by 24
Hu, X., Qiao, D., Kim, W., Moll, M. R., Balte, P., Lange, L. A., Bartz, T. M., Kumar, R., Li, X., Yu, B., et al. (2022) · The American Journal of Human Genetics · doi:10.1016/j.ajhg.2022.03.007 · Cited by 21
Tetikol, H. S., Narcı, K., Turgut, D., Budak, G., Kalay, Ö., Arslan, E., Demirkaya-Budak, S., Dolgoborodov, A., Jain, A., Kabakci-Zorlu, D., et al. (2022) · Nature Communications · doi:10.1038/s41467-022-31724-3 · Cited by 29
Polygenic risk score improves the accuracy of a clinical risk score for coronary artery disease
King, A., Wu, L., Deng, H., Shen, H., & Wu, C. (2022) · BMC Medicine · doi:10.1186/s12916-022-02583-y · Cited by 26
Self-citationMooney, M. A., Ryabinin, P., Morton, H. E., Selah, K., Gonoud, R., Kozlowski, M. B., Nousen, E. K., Tipsord, J. M., Antovich, D. M., Schwartz, J. D., et al. (2023) · JCPP Advances · doi:10.1002/jcv2.12152 · Cited by 24
Lüth, T., Gabbert, C., Koch, S., König, I. R., Caliebe, A., Laabs, B., Hentati, F., Sassi, S. B., Amouri, R., Spielmann, M., et al. (2023) · Movement Disorders · doi:10.1002/mds.29563 · Cited by 23
Polygenic Risk Scores Augment Stroke Subtyping
Li, J., Chaudhary, D. P., Khan, A., Griessenauer, C. J., Carey, D. J., Zand, R., & Abedi, V. (2021) · Neurology Genetics · doi:10.1212/nxg.0000000000000560 · Cited by 25
Bakulski, K. M., Vadari, H. S., Faul, J. D., Heeringa, S. G., Kardia, S. L. R., Langa, K. M., Smith, J. A., Manly, J. J., Mitchell, C. M., Benke, K. S., et al. (2021) · Neurology Genetics · doi:10.1212/nxg.0000000000000576 · Cited by 20
Kojima, K., Tadaka, S., Katsuoka, F., Tamiya, G., Yamamoto, M. P., & Kinoshita, K. (2020) · PLoS Computational Biology · doi:10.1371/journal.pcbi.1008207 · Cited by 24
El‐Boraie, A., Chenoweth, M. J., Pouget, J. G., Benowitz, N. L., Fukunaga, K., Mushiroda, T., Kubo, M., Nollen, N. L., Cox, L. S., Lerman, C. E., et al. (2020) · Clinical Pharmacology & Therapeutics · doi:10.1002/cpt.2135 · Cited by 21
Schaefer, J. D., Jang, S.-K., Clark, D. A., Deak, J. D., Hicks, B. M., Iacono, W. G., Liu, M., McGue, M. K., Vrieze, S. I., & Wilson, S. (2021) · Psychological Medicine · doi:10.1017/s0033291721004116 · Cited by 24
Cao, C., Zhang, S., Wang, J., Tian, M., Ji, X., Huang, D., Yang, S., & Gu, N. (2023) · Nucleic Acids Research · doi:10.1093/nar/gkad1029 · Cited by 24
Mbuya-Bienge, C., Pashayan, N., Kazemali, C. D., Lapointe, J., Simard, J., & Nabi, H. (2023) · Cancers · doi:10.3390/cancers15225380 · Cited by 24
A Systematic Framework for Assessing the Clinical Impact of Polygenic Risk ScoresPreprint
Kulm, S., Marderstein, A. R., Mezey, J. G., & Elemento, O. (2020) · SSRN Electronic Journal · doi:10.1101/2020.04.06.20055574 · Cited by 25
Population-specific polygenic risk scores for people of Han Chinese ancestry
Chen, H., Chen, C.-H., Hou, M., Fu, Y., Li, L., Chou, C.-Y., Yeh, E., Tsai, M.-F., Chen, C.-H., Yang, H., et al. (2025) · Nature · doi:10.1038/s41586-025-09350-y · Cited by 29
Rahman, M. S., Takahashi, N., Iwabuchi, T., Nishimura, T., Harada, T., Okumura, A., Takei, N., Nomura, Y., & Tsuchiya, K. J. (2021) · BMC Medicine · doi:10.1186/s12916-021-02093-3 · Cited by 23
A Web Portal for Communicating Polygenic Risk Score Results for Health Care Use—The P5 Study
Marjonen, H., Marttila, M. M., Paajanen, T. I., Vornanen, M., Brunfeldt, M., Joensuu, A., Halmesvaara, O., Aro, K., Alanne-Kinnunen, M., Jousilahti, P., et al. (2021) · Frontiers in Genetics · doi:10.3389/fgene.2021.763159 · Cited by 21
Mitochondrial and autophagy-lysosomal pathway polygenic risk scores predict Parkinson's disease
Dehestani, M., Liu, H., Sreelatha, A. A. K., Schulte, C., Bansal, V., & Gasser, T. (2022) · Molecular and Cellular Neuroscience · doi:10.1016/j.mcn.2022.103751 · Cited by 24
The immunogenetics of tuberculosis (TB) susceptibility
Sima, C. A. A. N., Smith, D., Petersen, D. C., Schurz, H., Uren, C., & Möller, M. (2022) · Immunogenetics · doi:10.1007/s00251-022-01290-5 · Cited by 22
Metadata
- Authors
- Duncan, L., Shen, H., Gelaye, B., Meijsen, J., Ressler, K., Feldman, M., Peterson, R., & Domingue, B.
- Affiliations
- Stanford University (US)
- Harvard University (US)
- Virginia Commonwealth University (US)
- Corresponding author
- Duncan, L.
- Venue
- Nature Communications
- Published
- 2019-07-25
- Volume
- 10
- Issue
- 1
- Pages
- 3328-3328
- ISSN
- 2041-1723 (ISSN-L)
- PMC
- PMC6658471
- OpenAlex
- W2963160524
- Semantic Scholar
- 712594d2beca4baa700cc51e92361b74500c6aa8
- Cited by
- 1,038
- References
- 53
- Citations by year
- 2026: 100 · 2025: 126 · 2024: 140 · 2023: 157 · 2022: 186 · 2021: 207 · 2020: 100 · 2019: 19
- FWCI
- 77.29
- Type
- journal article
- Language
- en
- Open access
- gold
- doi.org
- Locations
- Nature Communications (publishedVersion, cc-by)
- PubMed Central (publishedVersion, cc-by)
- PubMed (publishedVersion)
- RePEc: Research Papers in Economics (submittedVersion)
- DOAJ (DOAJ: Directory of Open Access Journals) (submittedVersion)
- DOAJ (DOAJ: Directory of Open Access Journals) (submittedVersion, cc-by-sa)
- SUNY Digital Repository Support (State University of New York System) (submittedVersion, cc-by-nc-nd)
- Funders
- none.
- Topics
- Life Sciences › Biochemistry, Genetics and Molecular Biology › Genetics › Genetic Associations and Epidemiology
- Social Sciences › Anthropology › Race, Genetics, and Society
- Life Sciences › Biochemistry, Genetics and Molecular Biology › Genetics › Forensic and Genetic Research
- Keywords
- polygenic risk score, ancestry bias, genetic ancestry, non-European ancestry populations, predictive performance, linkage disequilibrium, variant frequency, genome-wide association study, underrepresented groups
- MeSH terms
- Human Genetics, Female, Hispanic or Latino, Humans, Male, Linkage Disequilibrium, Multifactorial Inheritance, White People, Asian People, Genome-Wide Association Study
About these checks
Registry, retraction, Cites and statistics results are computed, not judged, with one exception: a printed reference that no index lists is read once by a model before it counts as a citation error. Claims are extracted by a model and kept only when their quote appears verbatim in the text; each cited source is then checked, with a model’s help, for whether it says what the claim relies on. Those verdicts can be wrong — read the claim’s quote and the cited source before relying on one.
Statistics and arithmetic are recomputed, not judged.
Confidence bands are shown only for fields calibrated on our annotated test set. None is calibrated yet, so no band is shown.
What counts as a claim ›How we measure confidence ›How we check this ›
Are you an author, or do you see a problem with this page? Request a review
