

The DOI matches its Crossref record; 45 of the 45 references it cites were found in a registry or an index.
Ageing affects DNA methylation drift and transcriptional cell-to-cell variability in mouse muscle stem cells
Open accessPublished version of a preprint
Abstract
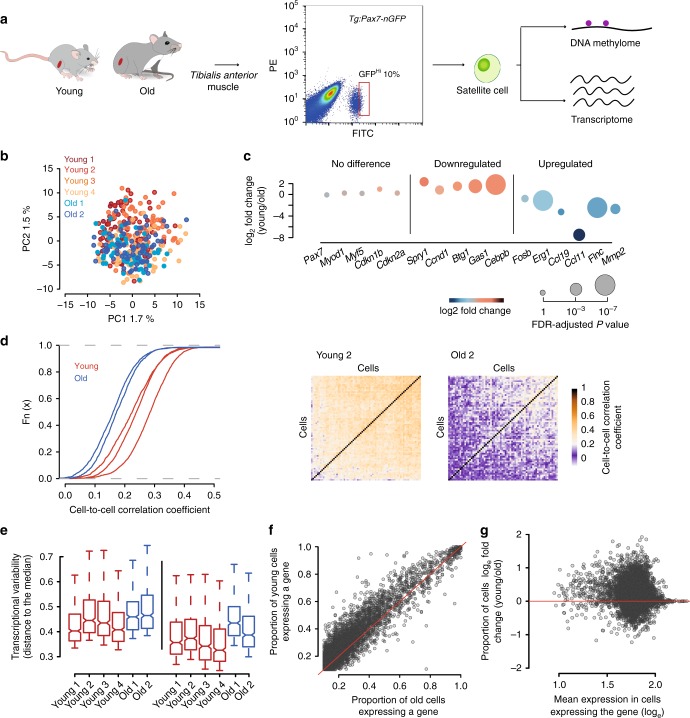
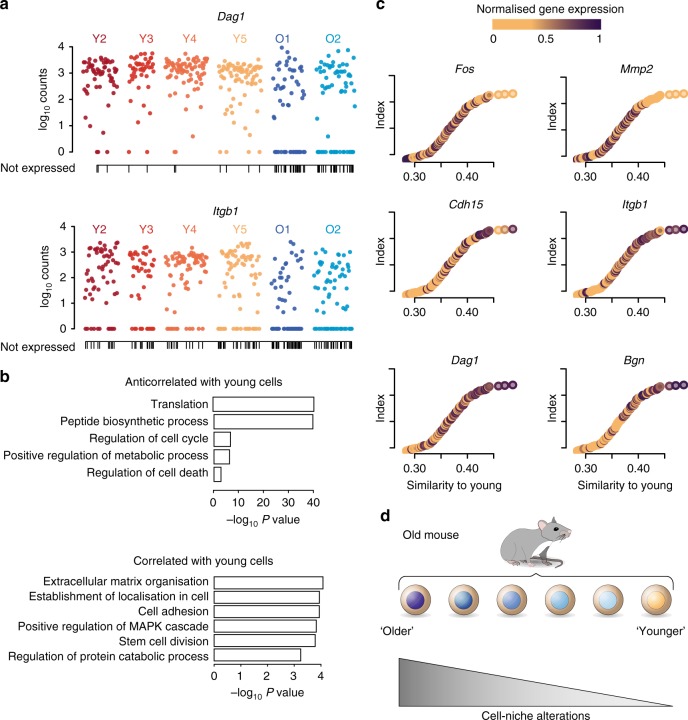
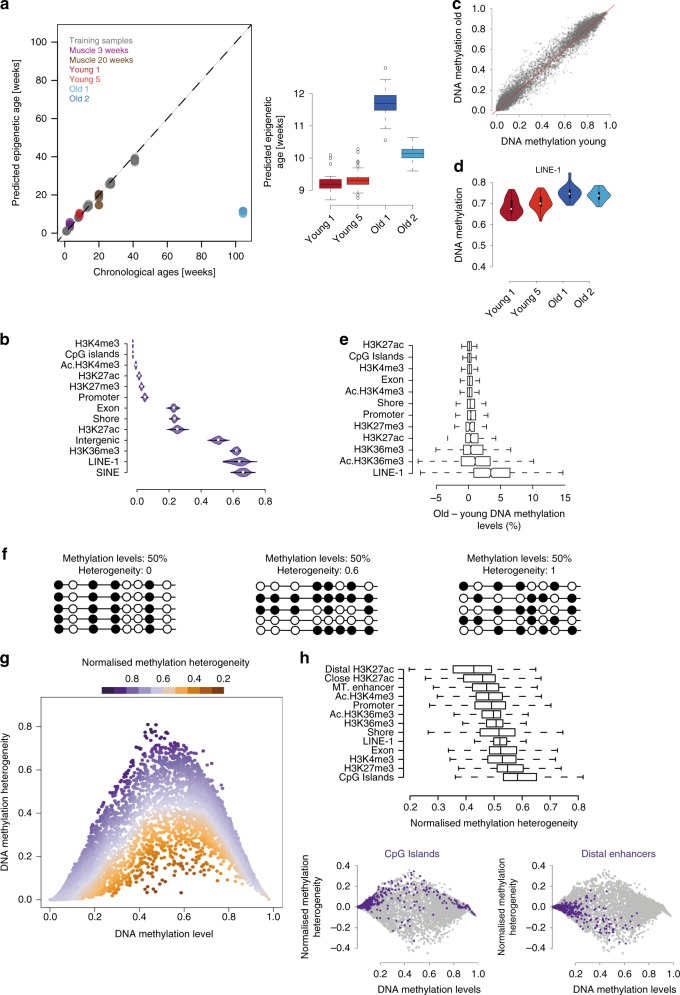
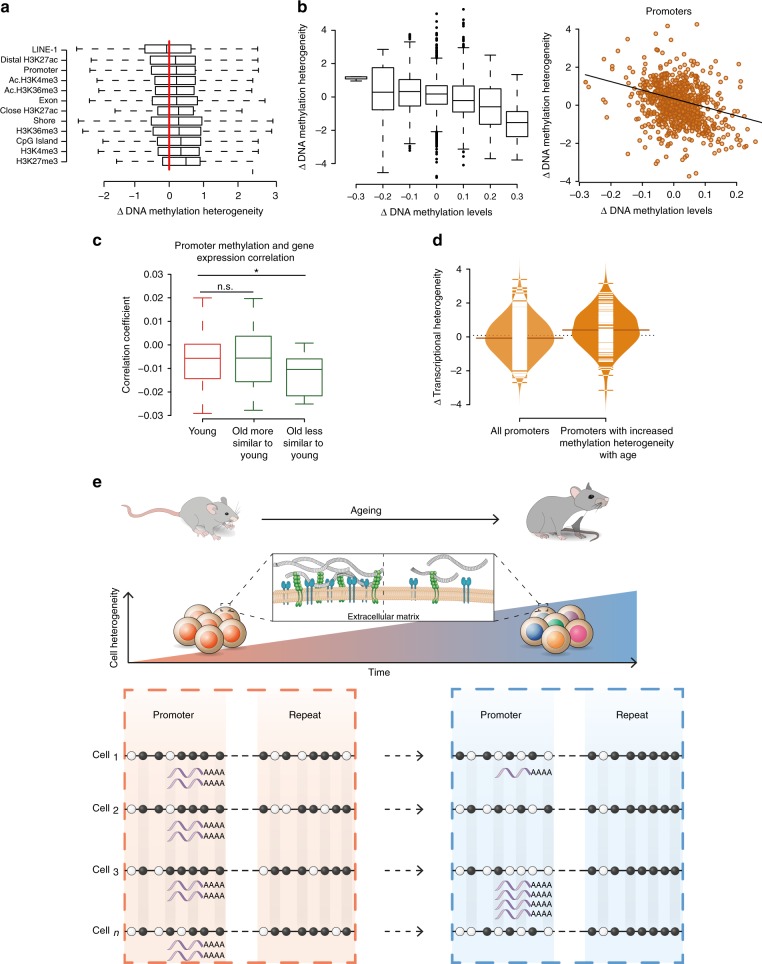
Age-related tissue alterations have been associated with a decline in stem cell number and function. Although increased cell-to-cell variability in transcription or epigenetic marks has been proposed to be a major hallmark of ageing, little is known about the molecular diversity of stem cells during ageing. Here we present a single cell multi-omics study of mouse muscle stem cells, combining single-cell transcriptome and DNA methylome profiling. Aged cells show a global increase of uncoordinated transcriptional heterogeneity biased towards genes regulating cell-niche interactions. We find context-dependent alterations of DNA methylation in aged stem cells. Importantly, promoters with increased methylation heterogeneity are associated with increased transcriptional heterogeneity of the genes they drive. These results indicate that epigenetic drift, by accumulation of stochastic DNA methylation changes in promoters, is associated with the degradation of coherent transcriptional networks during stem cell ageing. Furthermore, our observations also shed light on the mechanisms underlying the DNA methylation clock.
Overview
The claims and statistics of this paper haven’t been checked yet.
Run the check — free, no account needed. It reads the open-access text and checks the sources it cites.
Integrity signals
Registry
Cites
Statistics
Figures
Verification
Claims the paper makes
The claims and statistics of this paper haven’t been checked yet.
Run the check — free, no account needed. It reads the open-access text and checks the sources it cites.
Claims other papers make about this one
Each is checked against this paper’s own text: does it say what the citing paper says it does?
The source backs part of the claim, not all of it — or backs it for a different population, condition or comparison.
In the citing paper
“Aging causes an increase of the transcriptional noise and an aberrant production and maturation of many mRNAs 75,76 .”
From Hallmarks of aging: An expanding universe (2023) · cites this paper as [75]
Experimental — accuracy not yet measuredThe source backs part of the claim, not all of it — or backs it for a different population, condition or comparison.
In the citing paper
“Single-cell transcriptomic and plasma proteomics of multiple cell types and organs at several ages across the entire mouse lifespan have unveiled remarkable gene expression shifts during aging 75 .”
From Hallmarks of aging: An expanding universe (2023) · cites this paper as [75]
Experimental — accuracy not yet measuredIn the citing paper
“In muscle, single-cell multi-omic studies reveal that ageing is accompanied by transcriptional heterogeneity, especially in genes that impact stem cell–niche interactions67.”
From Ageing and rejuvenation of tissue stem cells and their niches (2023) · cites this paper as [67]
In the citing paper
“In muscle, DNA methylation changes with ageing in MuSCs, with increased heterogeneity (accompanied by transcriptional heterogeneity), suggesting an epigenetic drift with ageing33,67.”
From Ageing and rejuvenation of tissue stem cells and their niches (2023) · cites this paper as [67]
Self-check
Percentages, sums and reported differences re-computed from the paper’s own numbers.
The self-check needs the paper’s full text.
Citations
Cites
HISAT: a fast spliced aligner with low memory requirements
Kim, D., Langmead, B., & Salzberg, S. L. (2015) · Nature Methods · doi:10.1038/nmeth.3317 · Cited by 24,112
López-Otín, C., Blasco, M. A., Partridge, L., Serrano, M., & Kroemer, G. (2013) · Cell · doi:10.1016/j.cell.2013.05.039 · Cited by 14,982
DNA methylation age of human tissues and cell types
Horvath, S. (2013) · Genome Biology · doi:10.1186/gb-2013-14-10-r115 · Cited by 7,075
Bismark: a flexible aligner and methylation caller for Bisulfite-Seq applications
Krueger, F., & Andrews, S. (2011) · Bioinformatics · doi:10.1093/bioinformatics/btr167 · Cited by 5,324
Self-citationFull-length RNA-seq from single cells using Smart-seq2
Picelli, S., Faridani, O. R., Björklund, Å. K., Winberg, G., Sagasser, S., & Sandberg, R. (2014) · Nature Protocols · doi:10.1038/nprot.2014.006 · Cited by 4,137
GOrilla: a tool for discovery and visualization of enriched GO terms in ranked gene lists
Eden, E., Navon, R., Steinfeld, I., Lipson, D., & Yakhini, Z. (2009) · BMC Bioinformatics · doi:10.1186/1471-2105-10-48 · Cited by 3,356
DNA methylation-based biomarkers and the epigenetic clock theory of ageing
Horvath, S., & Raj, K. (2018) · Nature Reviews Genetics · doi:10.1038/s41576-018-0004-3 · Cited by 3,095
Snippert, H. J., van der Flier, L. G., Sato, T., van Es, J. H., van den Born, M., Kroon-Veenboer, C., Barker, N., Klein, A. M., van Rheenen, J., Simons, B. D., et al. (2010) · Cell · doi:10.1016/j.cell.2010.09.016 · Cited by 1,951
Bayesian approach to single-cell differential expression analysis
Kharchenko, P. V., Silberstein, L., & Scadden, D. T. (2014) · Nature Methods · doi:10.1038/nmeth.2967 · Cited by 1,348
Single-cell sequencing reveals dissociation-induced gene expression in tissue subpopulations
van den Brink, S. C., Sage, F., Vértesy, Á., Spanjaard, B., Peterson-Maduro, J., Baron, C. S., Robin, C., & van Oudenaarden, A. (2017) · Nature Methods · doi:10.1038/nmeth.4437 · Cited by 1,072
Cited by
Sorted by citations
Items 201–245 of 245
Omics approaches in aging research
Patnaik, P. K., Barlit, H., Shoushtari, S. I., & Labunskyy, V. M. (2023) · Elsevier eBooks · doi:10.1016/b978-0-12-823679-6.00016-3
Current Research On Epigenetic Age and Cellular Senescence: A Bibliometric and Visual AnalysisPreprint
kahaer, M. M. M., Hao, B. M. W., Sun, M. M. Z.-G., Xu, M. M. K., & Aikeremu, M. M. D. (2024) · bioRxiv (Cold Spring Harbor Laboratory) · doi:10.1101/2024.02.13.580124 · Cited by 1
Grant, O. A., Wang, Y., Meena Kumari, B., Zabet, N. R., & Schalkwyk, L. C. (2022) · Figshare · doi:10.6084/m9.figshare.19767748
Grant, O. A., Wang, Y., Meena Kumari, B., Zabet, N. R., & Schalkwyk, L. C. (2022) · Figshare · doi:10.6084/m9.figshare.19767745
Grant, O. A., Wang, Y., Meena Kumari, B., Zabet, N. R., & Schalkwyk, L. C. (2022) · Figshare · doi:10.6084/m9.figshare.19767742
Grant, O. A., Wang, Y., Meena Kumari, B., Zabet, N. R., & Schalkwyk, L. C. (2022) · Figshare · doi:10.6084/m9.figshare.19767751
Grant, O. A., Wang, Y., Meena Kumari, B., Zabet, N. R., & Schalkwyk, L. C. (2022) · Figshare · doi:10.6084/m9.figshare.19767739
Bennett, R., Morselli, M., Peshkin, L., & Pellegrini, M. A. (2024) · bioRxiv (Cold Spring Harbor Laboratory) · doi:10.1101/2024.12.21.629929
Spatial joint profiling of DNA methylome and transcriptome in mammalian tissuesPreprint
Lee, C. N., Fu, H., Cardilla, A., Zhou, W., & Deng, Y. (2025) · bioRxiv (Cold Spring Harbor Laboratory) · doi:10.1101/2025.07.01.662607
Kim, Y. L., Jo, Y.-W., Yoo, T., Yoo, K., Kim, J.-H., Park, M., Song, I.-W., Kim, H., Kim, Y.-E., Hann, S., et al. (2025) · bioRxiv (Cold Spring Harbor Laboratory) · doi:10.1101/2025.08.29.673011
Kim, Y. L., Jo, Y., Yoo, T., Yoo, K., Kim, J.-H., Park, M., Song, I.-W., Kim, H. J., Kim, Y.-E., Hann, S., et al. (2025) · eLife · doi:10.7554/elife.108680
Kim, Y. L., Jo, Y., Yoo, T., Yoo, K., Kim, J.-H., Park, M., Song, I.-W., Kim, H., Kim, Y.-E., Hann, S., et al. (2025) · eLife · doi:10.7554/elife.108680.1
Spatiotemporal Patterns of Active Epigenetic Turnover
Olmeda, F., Gupta, M., Bektaş, O., & Rulands, S. (2025) · PRX Life · doi:10.1103/89bj-79g5
Grant, O. A., Wang, Y., Kumari, M., Zabet, N. R., & Schalkwyk, L. C. (2022) · Figshare · doi:10.6084/m9.figshare.19767754
Grant, O. A., Wang, Y., Meena Kumari, B., Zabet, N. R., & Schalkwyk, L. C. (2022) · Figshare · doi:10.6084/m9.figshare.19767736
Rimoldi, M., Wang, N., Zhang, J., Villar, D., Odom, D. T., Taipale, J., Flicek, P., & Roller, M. (2024) · Figshare · doi:10.6084/m9.figshare.26730412
Grant, O. A., Wang, Y., Kumari, M., Zabet, N. R., & Schalkwyk, L. C. (2022) · Figshare · doi:10.6084/m9.figshare.19767763
Grant, O. A., Wang, Y., Meena Kumari, B., Zabet, N. R., & Schalkwyk, L. C. (2022) · Figshare · doi:10.6084/m9.figshare.19767760
Rimoldi, M., Wang, N., Zhang, J., Villar, D., Odom, D. T., Taipale, J., Flicek, P., & Roller, M. (2024) · Figshare · doi:10.6084/m9.figshare.26730424
Rimoldi, M., Wang, N., Zhang, J., Villar, D., Odom, D. T., Taipale, J., Flicek, P., & Roller, M. (2024) · Figshare · doi:10.6084/m9.figshare.25989323
Rimoldi, M., Wang, N., Zhang, J., Villar, D., Odom, D. T., Taipale, J., Flicek, P., & Roller, M. (2024) · Figshare · doi:10.6084/m9.figshare.26730427
Grant, O. A., Wang, Y., Meena Kumari, B., Zabet, N. R., & Schalkwyk, L. C. (2022) · Figshare · doi:10.6084/m9.figshare.19767757
Rimoldi, M., Wang, N., Zhang, J., Villar, D., Odom, D. T., Taipale, J., Flicek, P., & Roller, M. (2024) · Figshare · doi:10.6084/m9.figshare.25989180
Rimoldi, M., Wang, N., Zhang, J., Villar, D., Odom, D. T., Taipale, J., Flicek, P., & Roller, M. (2024) · Figshare · doi:10.6084/m9.figshare.26730421
Rimoldi, M., Wang, N., Zhang, J., Villar, D., Odom, D. T., Taipale, J., Flicek, P., & Roller, M. (2024) · Figshare · doi:10.6084/m9.figshare.26730418
Kim, Y. L., Jo, Y. K., Yoo, T., Yoo, K., Kim, J., Park, M., Song, I.-W., Kim, H., Kim, Y.-E., Hann, S., et al. (2026) · eLife · doi:10.7554/elife.108680.2
Investigation of the molecular diversity defining muscle stem cell heterogeneity
Benavente-Diaz, M. (2020) · theses.fr (ABES) · doi:10.70675/a5426795z7433z497fz9698z63a9efd33839
Identifying quiescent satellite cells: a scoping review of transcriptomic markers and limitations
Syroid, A. L., Steele, A. P., Murach, K. A., & Hawke, T. J. (2026) · American Journal of Physiology-Cell Physiology · doi:10.1152/ajpcell.00101.2026
Immunotherapy for senescent cell clearance: Hallmarks, strategies and translational challenges
Zhang, W., Chen, S., & Zhuang, X. (2026) · Ageing Research Reviews · doi:10.1016/j.arr.2026.103174
Wang, X., Kim, C.-Y., Je, J.-G., Roh, Y.-J., Yang, F., Yang, H.-W., & Jeon, Y. (2026) · Food & Function · doi:10.1039/d5fo05213k
Genome integrity, somatic mutation, and the N-of-1 imperative in aging research
Govindaraju, D. R., Atzmon, G., Innan, H., & Veitia, R. A. (2026) · Biogerontology · doi:10.1007/s10522-026-10451-y
Silveira, K. R. D., Haach, V., & Bastos, A. P. (2026) · Foods · doi:10.3390/foods15122218
Peraki, I., Zhang, L., Botskaris, D., Stagaki, M., Deligiannis, I. K., Kontaki, H., Deligianni, E., Giannoulakis, I., Hazapis, O. G., Lavigne, M. D., et al. (2026) · iScience · doi:10.1016/j.isci.2026.116731
Hernández‐Camacho, J. D., & Saclier, M. (2026) · Journal of Cellular Physiology · doi:10.1002/jcp.70212
Perin, L., Sacco, S. D., Liu, Y., Brent, G. A., & Milanesi, A. (2026) · Frontiers in Immunology · doi:10.3389/fimmu.2026.1906969
Embracing non-linearity in human ageing
Grolaux, R., Teschendorff, A. E., & Eynon, N. (2026) · Nature Reviews Genetics · doi:10.1038/s41576-026-00993-9
Godlewski, A., Wróblewski, M., Kuk, J., Moritz, M., Dobrak, F., Kołodziejska, R., & Woźniak, A. (2026) · Genes · doi:10.3390/genes17080964
Li, Z., Li, J., Zhu, X., Qin, G., Zheng, Y., Chen, L., Duan, R., & Shi, H. (2026) · Ageing Research Reviews · doi:10.1016/j.arr.2026.103316
Replicative history as a major determinant of epigenetic noise across human tissuesPreprint
Peñarroya, A., Alba‐Linares, J. J., Pérez, R. F., Fernández, A. F., Fraga, M. F., & Tejedor, J. R. (2026) · bioRxiv (Cold Spring Harbor Laboratory) · doi:10.64898/2026.08.19.745715
Targeting senescence-associated biomarkers: Emerging strategies for anti-ageing therapy
Qin, Z., Zhang, L., Song, J., Chen, Y., Zhou, Y., Wu, J., Li, X., Chen, L., & Zhou, Z. (2026) · Ageing Research Reviews · doi:10.1016/j.arr.2026.103344
Kang, D., Bok, E., Hong, C., Plassais, J., Choe, Y., Lee, S., & Kim, J. (2026) · GeroScience · doi:10.1007/s11357-026-02533-z
Aging of Skeletal Muscle: From Molecular Mechanisms to Therapeutic Interventions
Liu, T., & Hu, Y. (2026) · MedComm · doi:10.1002/mco2.70995
SMORE: joint dimension reduction and cell population discovery on single-cell methylome dataPreprint
Deng, J., Wang, Z., Tang, W., Hu, G., & Feng, H. (2026) · bioRxiv (Cold Spring Harbor Laboratory) · doi:10.64898/2026.09.14.751514
Tissue coordination in ageing and disease
Cleal, K. (2026) · Ageing Research Reviews · doi:10.1016/j.arr.2026.103422
Metadata
- Authors
- Hernando-Herraez, I., Evano, B., Stubbs, T., Commere, P.-H., Jan Bonder, M., Clark, S., Andrews, S., Tajbakhsh, S., & Reik, W.
- Affiliations
- Babraham Institute (GB)
- Centre National de la Recherche Scientifique (FR)
- Corresponding author
- Hernando-Herraez, Irene
- Tajbakhsh, Shahragim
- Reik, Wolf
- ORCID
- Venue
- Nature Communications
- Published
- 2019-09-25
- Volume
- 10
- Issue
- 1
- Pages
- 4361-4361
- ISSN
- 2041-1723 (ISSN-L)
- PMC
- PMC6761124
- OpenAlex
- W2976009347
- Cited by
- 236
- References
- 45
- Citations by year
- 2026: 31 · 2025: 25 · 2024: 35 · 2023: 40 · 2022: 37 · 2021: 29 · 2020: 33 · 2019: 5
- FWCI
- 8.97
- Type
- journal article
- Language
- en
- Open access
- gold
- doi.org
- Locations
- Nature Communications (publishedVersion, cc-by)
- bioRxiv (Cold Spring Harbor Laboratory) (acceptedVersion, cc-by-nc-nd)
- PubMed Central (publishedVersion, cc-by)
- PubMed (publishedVersion)
- University of Groningen research database (University of Groningen / Centre for Information Technology) (publishedVersion, cc-by)
- HAL (submittedVersion, cc-by)
- RePEc: Research Papers in Economics (submittedVersion)
- DOAJ (DOAJ: Directory of Open Access Journals) (submittedVersion, cc-by-sa)
- DOAJ (DOAJ: Directory of Open Access Journals) (submittedVersion)
- Apollo (University of Cambridge) (submittedVersion, cc-by)
- Apollo (cc-by)
- Funders
- Agence Nationale de la Recherche (ANR-10-LABX-73)
- Association Française contre les Myopathies (332893)
- RCUK | Biotechnology and Biological Sciences Research Council (CBBS/E/B/000C0425)
- Topics
- Life Sciences › Biochemistry, Genetics and Molecular Biology › Molecular Biology › Epigenetics and DNA Methylation
- Life Sciences › Biochemistry, Genetics and Molecular Biology › Molecular Biology › Single-cell and spatial transcriptomics
- Life Sciences › Biochemistry, Genetics and Molecular Biology › Molecular Biology › Genomics and Chromatin Dynamics
- Keywords
- aging, muscle stem cells, epigenetic drift, transcriptional heterogeneity, cell-to-cell variability, single-cell multi-omics, promoter methylation, DNA methylation clocks, transcriptional regulatory networks, stem cell heterogeneity
- MeSH terms
- Aging, Animals, Cells, Cultured, Humans, Mice, Inbred C57BL, Mice, Inbred DBA, Mice, Transgenic, Muscles, Promoter Regions, Genetic, Stem Cells, Cellular Senescence, DNA Methylation, Gene Expression Profiling, Epigenesis, Genetic, Epigenomics, Single-Cell Analysis, Transcriptome, Gene Ontology
About these checks
Registry, retraction, Cites and statistics results are computed, not judged, with one exception: a printed reference that no index lists is read once by a model before it counts as a citation error. Claims are extracted by a model and kept only when their quote appears verbatim in the text; each cited source is then checked, with a model’s help, for whether it says what the claim relies on. Those verdicts can be wrong — read the claim’s quote and the cited source before relying on one.
Statistics and arithmetic are recomputed, not judged.
Confidence bands are shown only for fields calibrated on our annotated test set. None is calibrated yet, so no band is shown.
What counts as a claim ›How we measure confidence ›How we check this ›
Are you an author, or do you see a problem with this page? Request a review
