

The DOI matches its Crossref record; 35 of the 35 references it cites were found in a registry or an index.
A tool for functional brain imaging with lifespan compliance
Open accessAbstract
The human brain undergoes significant functional and structural changes in the first decades of life, as the foundations for human cognition are laid down. However, non-invasive imaging techniques to investigate brain function throughout neurodevelopment are limited due to growth in head-size with age and substantial head movement in young participants. Experimental designs to probe brain function are also limited by the unnatural environment typical brain imaging systems impose. However, developments in quantum technology allowed fabrication of a new generation of wearable magnetoencephalography (MEG) technology with the potential to revolutionise electrophysiological measures of brain activity. Here we demonstrate a lifespan-compliant MEG system, showing recordings of high fidelity data in toddlers, young children, teenagers and adults. We show how this system can support new types of experimental paradigm involving naturalistic learning. This work reveals a new approach to functional imaging, providing a robust platform for investigation of neurodevelopment in health and disease.
Overview
The claims and statistics of this paper haven’t been checked yet.
Run the check — free, no account needed. It reads the open-access text and checks the sources it cites.
Integrity signals
Registry
Cites
Statistics
Figures
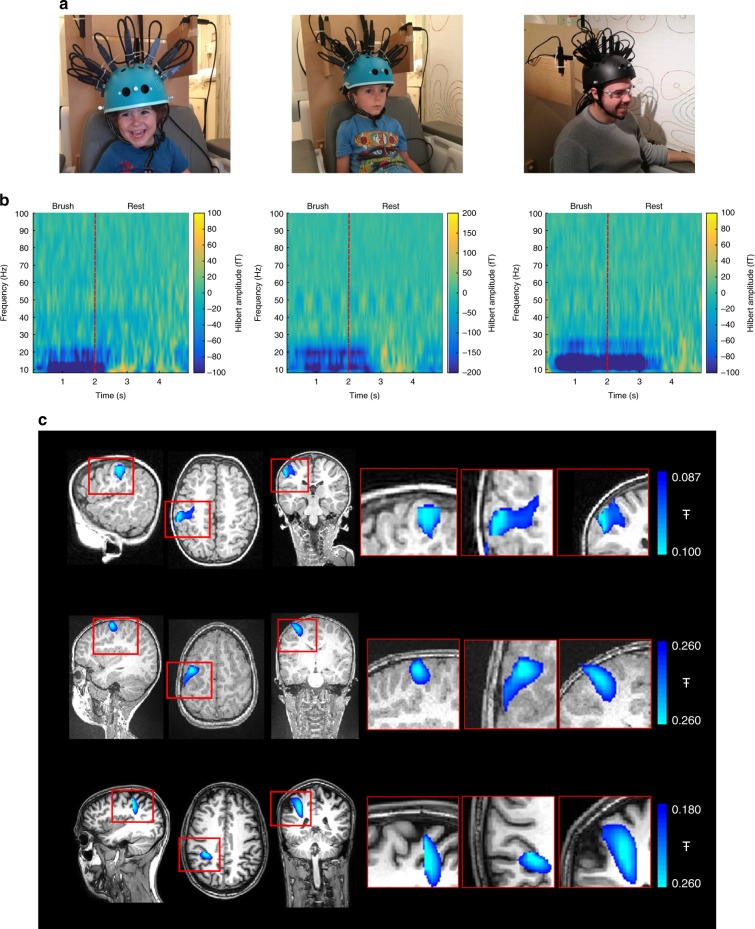
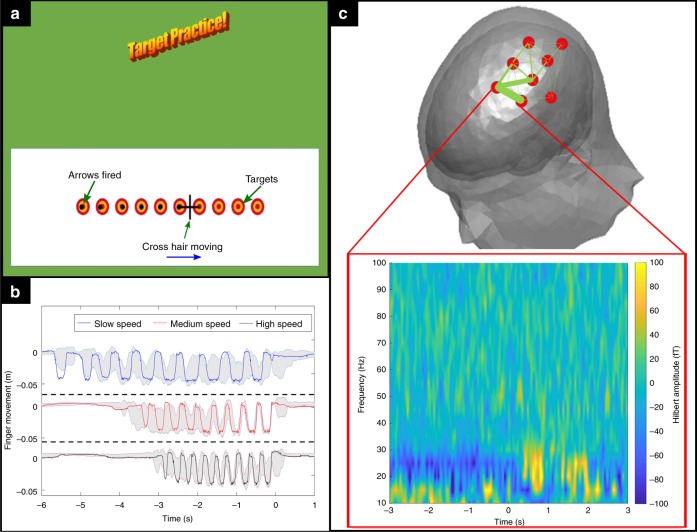
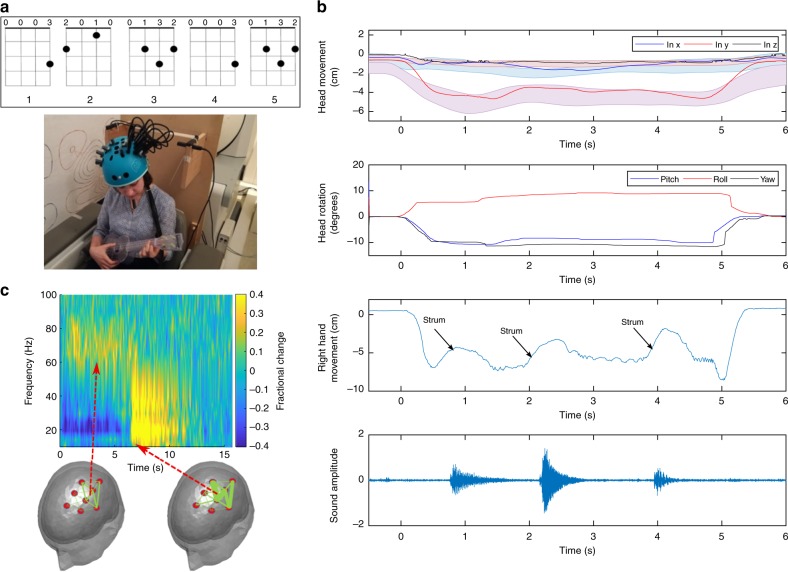
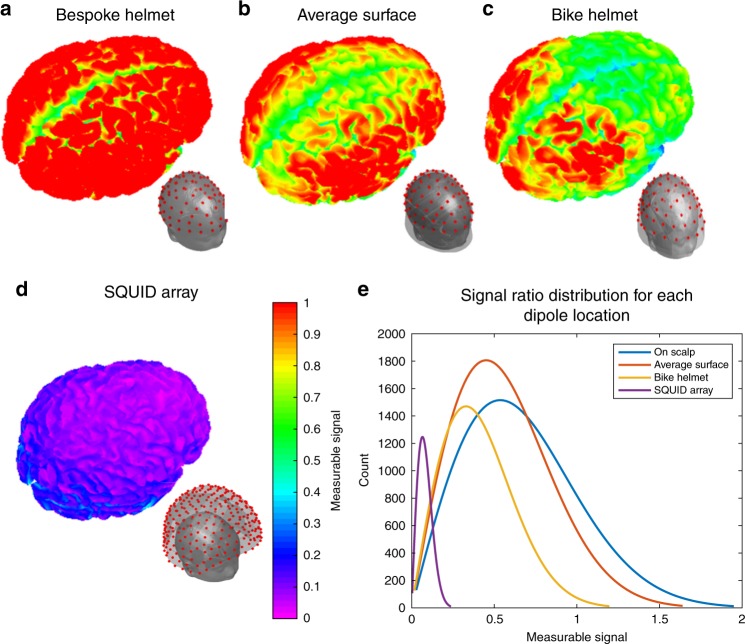
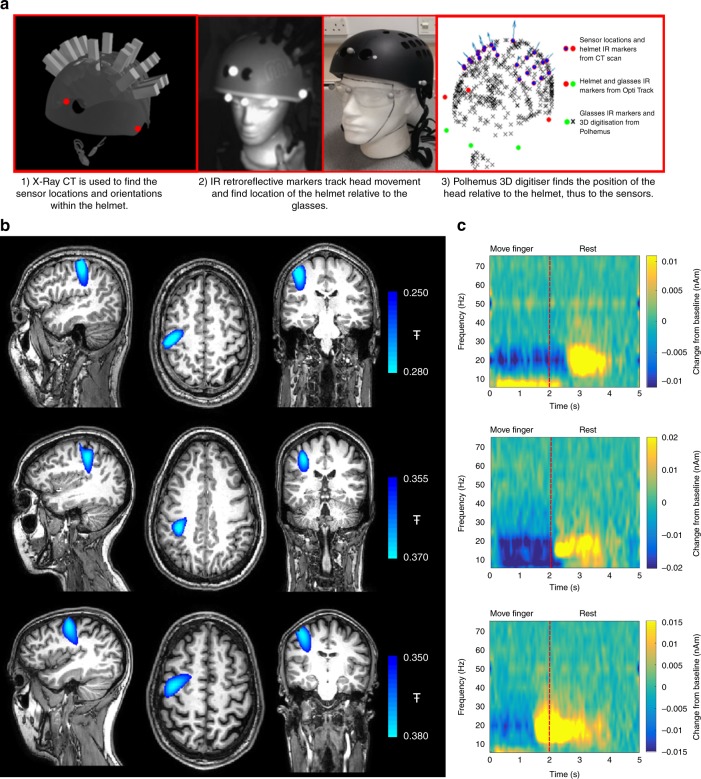
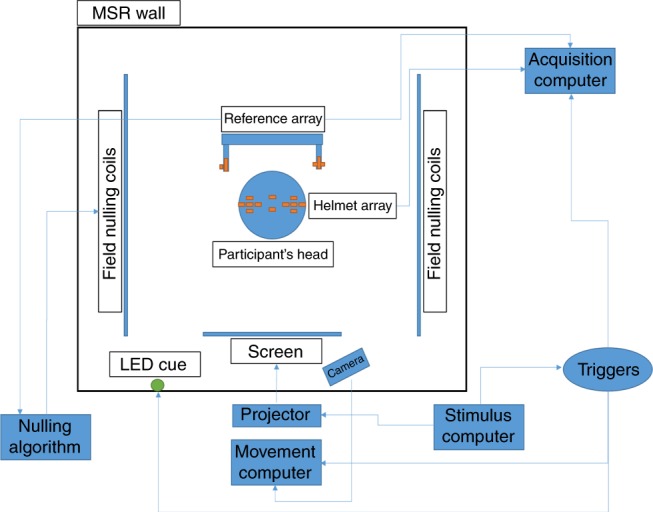
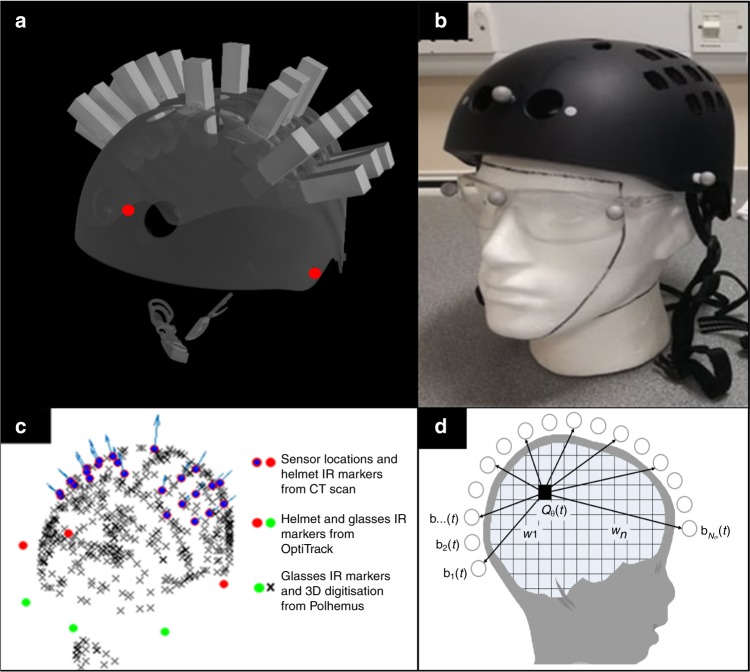
Verification
Claims the paper makes
The claims and statistics of this paper haven’t been checked yet.
Run the check — free, no account needed. It reads the open-access text and checks the sources it cites.
Claims other papers make about this one
Each is checked against this paper’s own text: does it say what the citing paper says it does?
The cited source says what the claim attributes to it.
In the citing paper
“and enable scanning across the lifespan [31,32].”
From Naturalistic Hyperscanning with Wearable Magnetoencephalography (2023) · cites this paper as [31]
Self-check
Percentages, sums and reported differences re-computed from the paper’s own numbers.
The self-check needs the paper’s full text.
Citations
Cites
Event-related EEG/MEG synchronization and desynchronization: basic principles
Pfurtscheller, G., & Lopes da Silva, F. H. (1999) · Clinical Neurophysiology · doi:10.1016/s1388-2457(99)00141-8 · Cited by 7,328
Hämäläinen, M., Hari, R., Ilmoniemi, R. J., Knuutila, J., & Lounasmaa, O. V. (1993) · Reviews of Modern Physics · doi:10.1103/revmodphys.65.413 · Cited by 4,684
Van Veen, B. D., Van Drongelen, W., Yuchtman, M., & Suzuki, A. (1997) · IEEE Transactions on Biomedical Engineering · doi:10.1109/10.623056 · Cited by 2,561
Basic mathematical and electromagnetic concepts of the biomagnetic inverse problem.
Sarvas, J. (1987) · Physics in Medicine and Biology · doi:10.1088/0031-9155/32/1/004 · Cited by 1,945
A subfemtotesla multichannel atomic magnetometer
Kominis, I. K., Kornack, T. W., Allred, J. C., & Romalis, M. V. (2003) · Nature · doi:10.1038/nature01484 · Cited by 1,631
Moving magnetoencephalography towards real-world applications with a wearable system
Boto, E., Holmes, N., Leggett, J., Roberts, G., Shah, V., Meyer, S. S., Muñoz, L. D., Mullinger, K. J., Tierney, T. M., Bestmann, S., et al. (2018) · Nature · doi:10.1038/nature26147 · Cited by 1,377 · cited 5×
“Having derived this inner surface, it was fitted, visually, to the MRI of the same 2-year-old used in (1).”
BackgroundMethodInfluentialSelf-citationHigh-Sensitivity Atomic Magnetometer Unaffected by Spin-Exchange Relaxation
Allred, J. C., Lyman, R. N., Kornack, T. W., & Romalis, M. V. (2002) · Physical Review Letters · doi:10.1103/physrevlett.89.130801 · Cited by 1,049
Magnetoencephalography for Brain Electrophysiology and Imaging
Baillet, S. (2017) · Nature Neuroscience · doi:10.1038/nn.4504 · Cited by 992
Ultrahigh sensitivity magnetic field and magnetization measurements with an atomic magnetometer
Dang, H. B., Maloof, A. C., & Romalis, M. V. (2010) · Applied Physics Letters · doi:10.1063/1.3491215 · Cited by 891
Cohen, D. (1972) · Science · doi:10.1126/science.175.4022.664 · Cited by 785
Cited by
Sorted by citations
Items 101–180 of 180
Liang, A., Wu, H., Ma, Y., Liang, X., Jia, Y., Gao, Y., Ning, X., & Fang, J. (2021) · IEEE Access · doi:10.1109/access.2021.3063054 · Cited by 11
Characterization of 87Rb MEMS vapor cells for miniature atomic magnetometers
Jiang, M., Zhai, H., Jiang, C., Wang, J., Chen, C., Zhang, Q., Wu, D., Zhang, B., Zeng, Z., Lin, J., et al. (2023) · Applied Physics Letters · doi:10.1063/5.0149388 · Cited by 10
Zhao, R., Wang, R., Gao, Y., & Ning, X. (2024) · Biomedical Signal Processing and Control · doi:10.1016/j.bspc.2024.106236 · Cited by 10
Feys, O., Wens, V., Corvilain, P., Ferez, M., Holmes, N., Brookes, M. J., & Tiège, X. D. (2023) · Epilepsia · doi:10.1111/epi.17806 · Cited by 10
Self-citationOptically Pumped Magnetometers for Practical MEG-Based Brain-Computer Interfacing
Wittevrongel, B., Holmes, N., Boto, E., Hill, R., Rea, M., Libert, A., Khachatryan, E., Bowtell, R., Brookes, M. J., & Van Hulle, M. M. (2021) · SpringerBriefs in Electrical and Computer Engineering · doi:10.1007/978-3-030-79287-9_4 · Cited by 9
Self-citationMEG current source reconstruction using a meta-analysis fMRI prior
Suzuki, K., & Yamashita, O. (2021) · NeuroImage · doi:10.1016/j.neuroimage.2021.118034 · Cited by 8
New avenues for functional neuroimaging: ultra-high field MRI and OPM-MEG
Qin, L., & Gao, J. (2021) · Psychoradiology · doi:10.1093/psyrad/kkab014 · Cited by 9
Niu, Y., & Ye, C. (2023) · IEEE Sensors Journal · doi:10.1109/jsen.2023.3299690 · Cited by 9
An, N., Gao, Z., Li, W., Cao, F., Wang, W., Xu, W., Wang, C., Xiang, M., Gao, Y., Wang, D., et al. (2024) · Computer Methods and Programs in Biomedicine · doi:10.1016/j.cmpb.2024.108292 · Cited by 9
MEG-Based Detection of Voluntary Eye Fixations Used to Control a Computer
Ovchinnikova, A. O., Vasilyev, A. N., Zubarev, I., Kozyrskiy, B. L., & Shishkin, S. L. (2021) · Frontiers in Neuroscience · doi:10.3389/fnins.2021.619591 · Cited by 9
Real-Time Localization of OPMs in a Flexible Array During MEG Recordings
Gu, W., He, K., Ma, X., Li, D., Pang, W., Sheng, J., & Gao, J. (2023) · IEEE Transactions on Instrumentation and Measurement · doi:10.1109/tim.2023.3346516 · Cited by 8
Co-Registration Error Analysis and Array Calibration for OPM-MEG System
Pang, M., Huang, Z., Ding, Z., & Han, B. (2022) · IEEE Transactions on Instrumentation and Measurement · doi:10.1109/tim.2022.3216411 · Cited by 8
Analysis and Suppression of the Cross-Axis Coupling Effect for Dual-Beam SERF Atomic Magnetometer
Lu, F., Wang, S., Xu, N., Li, B., Lu, J., & Han, B. (2022) · Photonics · doi:10.3390/photonics9110792 · Cited by 7
OPM-MEG reveals dynamics of beta bursts underlying attentional processes in sensory cortex
Rivero, G., Tanner, Z., Rier, L., Hill, R. M., Shah, V., Rea, M., Doyle, C., Osborne, J., Bobela, D., Morris, P. G., et al. (2025) · Scientific Reports · doi:10.1038/s41598-025-08037-8 · Cited by 8
Self-citationThermal Analysis of Wearable OPM-MEG Array System for Auditory Evoked Experiments
Pang, M., Huang, Z., Wu, H., Ding, Z., & Han, B. (2022) · IEEE Sensors Journal · doi:10.1109/jsen.2022.3143209 · Cited by 7
First experiences of whole-head OP-MEG recordings from a patient with EpilepsyPreprint
Mellor, S., Vivekananda, U., O’Neill, G. C., Tierney, T. M., Doig, D., Seymour, R. A., Alexander, N., Walker, M. C., & Barnes, G. R. (2021) · medRxiv · doi:10.1101/2021.09.28.21264047 · Cited by 7
Self-citationPei, Y., Wang, C., Qin, J., Tong, Y., Wei, R., Weng, Y., Liu, F., Quan, W., Chai, Z., & Zhang, Y. (2025) · ACS Photonics · doi:10.1021/acsphotonics.4c02361 · Cited by 6
Towards a 384-channel magnetoencephalography system based on optically pumped magnetometers
Schofield, H., Hill, R. M., Rier, L., Kennett, E., Rivero, G. R., Gibson, J. M., Tyler, A. J., Tanner, Z., Worcester, F., Hayward, T., et al. (2025) · Imaging Neuroscience · doi:10.1162/imag.a.1042 · Cited by 11
Self-citationSmart Devices and Multimodal Systems for Mental Health Monitoring: From Theory to Application
Caragata, A. V., Hnatiuc, M. E., Geman, O., Halunga, S. V., Tulbure, A. A., & Iov, C. J. (2026) · Bioengineering · doi:10.3390/bioengineering13020165 · Cited by 10
SERF-like magnetometry in room-temperature environment
Bao, G., Chen, J., Wang, R., Chen, L. Q., & Zhang, W. (2023) · Optics Express · doi:10.1364/oe.500875 · Cited by 6
Fetal magnetoencephalography based on optically pumped magnetometersPreprint
Corvilain, P., Capparini, C., Wens, V., Fourdin, L., Ferez, M., Feys, O., Delbaere, A., Lejeune, R., Goldman, D., Coninck, C. D., et al. (2025) · bioRxiv (Cold Spring Harbor Laboratory) · doi:10.1101/2025.04.23.650121 · Cited by 8
Ranjbaran, M., sedeyan, R., Zamani, A., Tehranchi, M. M., Khalkhali, S. M. H., & Hamidi, S. M. (2024) · Journal of Magnetism and Magnetic Materials · doi:10.1016/j.jmmm.2024.172335 · Cited by 5
Niesen, M., Bourguignon, M., Bertels, J., Ghinst, M. V., Wens, V., Goldman, S., & Tiège, X. D. (2022) · NeuroImage · doi:10.1016/j.neuroimage.2022.119770 · Cited by 5
Using OPMs to measure neural activity in standing, mobile participantsPreprint
Seymour, R. A., Alexander, N., Mellor, S., O’Neill, G. C., Tierney, T. M., Barnes, G. R., & Maguire, E. A. (2021) · bioRxiv (Cold Spring Harbor Laboratory) · doi:10.1101/2021.05.26.445793 · Cited by 5
Self-citationHilman, L., Ondičová, M., Caffrey, A., Clements, M., Conway, C., Ward, M., Pentieva, K. D., Irwin, R. E., McNulty, H., & Walsh, C. P. (2024) · BMC Medicine · doi:10.1186/s12916-024-03804-2 · Cited by 5
Sun, J., Gan, Z., Shi, Y., Zhou, W., Wang, K., & CHENG, J. (2025) · IEEE Transactions on Industrial Electronics · doi:10.1109/tie.2025.3585053 · Cited by 5
Guggisberg, A. G., Siebner, H. R., Lundell, H., Madsen, M. A. J., Madsen, K. H., Wiggermann, V., Mégevand, P., Proix, T., Dalal, S. S., Grouiller, F., et al. (2025) · Clinical Neurophysiology · doi:10.1016/j.clinph.2025.2110942 · Cited by 5
Tanner, Z., Rier, L., Fildes, J., Rivero, G., Schofield, H., Marani, C., Holmes, N., Hill, R. M., Shah, V., Doyle, C., et al. (2025) · Imaging Neuroscience · doi:10.1162/imag.a.10 · Cited by 7
Self-citationAdvances in laser heating of alkali vapor cells in magnetometers: a review
Wang, K., Zhou, B., Tang, J., Zhang, S., & Wang, Y. (2020) · Applied Optics and Photonics China (AOPC) · doi:10.1117/12.2574588 · Cited by 4
A miniaturized spin-exchange relaxation-free atomic magnetometer based on uniform light field
Li, J., Fang, X., Li, R., Chen, B., Zhai, Y., & Liu, Y. (2022) · Chinese Physics B · doi:10.1088/1674-1056/aca7f2 · Cited by 4
Mapping neural signatures of face processing in young children: an OPM-MEG study
Safar, K., Vandewouw, M. M., Rhodes, N., Sato, J., & Taylor, M. J. (2025) · Social Cognitive and Affective Neuroscience · doi:10.1093/scan/nsaf076 · Cited by 4
Small Animal Biomagnetism Applications
Jensen, K., Bentzen, B. H., & Polzik, E. S. (2022) · Springer eBooks · doi:10.1007/978-3-031-05363-4_3 · Cited by 3
Hillebrand, A., Holmes, N., Sijsma, N., O’Neill, G. C., Tierney, T. M., Liberton, N. P. T. J., Stam, A. H., van Klink, N. E. C., Stam, C. J., Bowtell, R. W., et al. (2022) · medRxiv · doi:10.1101/2022.11.03.22281836 · Cited by 3
Self-citationNeural and behavioural rhythmic tracking during language acquisition: The story so farPreprint
Mandke, K. N., & Rocha, S. (2023) · doi:10.31234/osf.io/6d3cq · Cited by 3
The neurodevelopmental trajectory of beta band oscillations: an OPM-MEG studyPreprint
Rier, L., Rhodes, N., Pakenham, D., Boto, E., Holmes, N., Hill, R. M., Rivero, G. R., Shah, V., Doyle, C., Osborne, J., et al. (2024) · eLife · doi:10.7554/elife.94561.1 · Cited by 4
Self-citationWang, C., Cao, F., Li, W., Wang, W., Li, Y., An, N., Xiang, M., & Ning, X. (2025) · Journal of Neural Engineering · doi:10.1088/1741-2552/adec1d · Cited by 2
Free induction decay gradiometer based on 87Rb MEMS vapor cell in the geomagnetic field range
Zhang, Q., Wang, J., Jiang, C., Chen, C., Wang, J., Feng, W., Zhang, B., Zeng, Z., Wu, D., & Wang, Y. (2025) · Applied Physics Letters · doi:10.1063/5.0282029 · Cited by 2
Dual-resonance single-beam triaxial spin-exchange relaxation-free magnetometer
Zhang, G., Yu, W., Gao, Y., Wang, F., Zhang, Q., & Lin, Q. (2025) · Optics Express · doi:10.1364/oe.568707 · Cited by 3
Optimization and Analysis of Tangential Component Orientations in OPM-MEG Sensor Array
Wang, W., Cao, F., An, N., Li, W., Wang, C., Gao, Z., Xiang, M., & Ning, X. (2025) · Bioengineering · doi:10.3390/bioengineering12090903 · Cited by 2
Dai, X., Pan, D., Chen, Y., Jin, C., & Li, L. (2025) · IEEE Transactions on Instrumentation and Measurement · doi:10.1109/tim.2025.3612637 · Cited by 2
Xu, W., Wang, W., Cao, F., An, N., Li, W., Xiang, M., Ning, X., Liu, Y., & Wang, B. (2025) · Bioengineering · doi:10.3390/bioengineering12111198 · Cited by 2
Modeling multivariate age‐related imaging variables with dependencies
Lee, H., Chen, C., Kochunov, P. V., Hong, L. E., & Chen, S. (2022) · Statistics in Medicine · doi:10.1002/sim.9522 · Cited by 2
Rier, L., Rhodes, N., Pakenham, D. O., Boto, E., Holmes, N., Hill, R. M., Rivero, G. R., Shah, V., Doyle, C., Osborne, J., et al. (2024) · eLife · doi:10.7554/elife.94561.3 · Cited by 2
Self-citationQi, S., Song, X., Jia, L., Cui, H., Suo, Y., Long, T., Wu, Z., & Ning, X. (2025) · NeuroImage · doi:10.1016/j.neuroimage.2025.121056 · Cited by 2
Relying on PRIME young adults limits cognitive science
Lockwood, P. L., & van den Bos, W. (2025) · Trends in Cognitive Sciences · doi:10.1016/j.tics.2025.06.010 · Cited by 2
Safar, K., Vandewouw, M. M., Sato, J., Devasagayam, J., Hill, R. M., Rea, M., Brookes, M. J., & Taylor, M. J. (2023) · Research Square · doi:10.21203/rs.3.rs-3263385/v1 · Cited by 2
Self-citationThe neurodevelopmental trajectory of beta band oscillations: an OPM-MEG studyPreprint
Rier, L., Rhodes, N., Pakenham, D., Boto, E., Holmes, N., Hill, R. M., Rivero, G., Shah, V., Doyle, C., Osborne, J., et al. (2024) · bioRxiv (Cold Spring Harbor Laboratory) · doi:10.1101/2024.01.04.573933 · Cited by 2
Self-citationLi, Y., Zhou, X., & Wang, W. (2025) · IEEE Sensors Journal · doi:10.1109/jsen.2025.3559930 · Cited by 1
Li, H., liu, K., Tian, P., Zheng, S., Zhang, H., & Zhao, X. (2025) · Measurement Science and Technology · doi:10.1088/1361-6501/ae2535 · Cited by 1
Active magnetic compensation control systems: a review
Xu, X., Zhang, X., Liu, Y., & Han, C. (2025) · Measurement · doi:10.1016/j.measurement.2025.120012 · Cited by 2
NEUROIMAGING METHODS FOR ASSESSMENT OF CORTICAL AUDITORY PROCESSING: A REVIEW
Cieśla, K., Kochański, B., Paluch, P., & Wolak, T. P. (2020) · Journal of Hearing Science · doi:10.17430/jhs.2020.10.3.3 · Cited by 1
Neural Activity and Oscillations as Biological Markers in Traumatic Brain Injury
Dunkley, B. T. (2022) · Biomarkers in disease · doi:10.1007/978-3-030-87302-8_46-1 · Cited by 1
Supine OPM-MEG in Multilayer Cylindrical Shield
Sheng, J., Li, D., Wan, S., Qin, J., & Gao, J. (2022) · Springer eBooks · doi:10.1007/978-3-031-05363-4_4 · Cited by 1
Turning OPM-MEG into a Wearable Technology
Rhodes, N., Holmes, N., Hill, R. M., Barnes, G. R., Bowtell, R. W., Brookes, M. J., & Boto, E. (2022) · Springer eBooks · doi:10.1007/978-3-031-05363-4_11 · Cited by 1
Self-citationNassan, M. M. (2024) · Harvard Review of Psychiatry · doi:10.1097/hrp.0000000000000399 · Cited by 1
The ingroup preference in prosocial behavior: From the perspective of social motives
Zhu, J., & Zhou, Y. (2024) · Chinese Science Bulletin (Chinese Version) · doi:10.1360/tb-2024-0443 · Cited by 1
Signal space beamforming for gain- and geometry-independent interference suppression in wearable MEGPreprint
Ferez, M., Corvilain, P., Feys, O., Capparini, C., Fourdin, L., Bertels, J., Tiège, X. D., & Wens, V. (2026) · bioRxiv (Cold Spring Harbor Laboratory) · doi:10.64898/2026.01.22.700798 · Cited by 1
Progress and Challenges of Neuroscience and Brain-inspired Artificial Intelligence
Wang, L., & Alexander, C. A. (2020) · Neuroscience International · doi:10.3844/amjnsp.2020.1.9
Magnetic Field Compensation Coil Design for MagnetoencephalographyPreprint
Sonntag, H., Doeller, C. F., Haueisen, J., & Maeß, B. (2021) · Research Square · doi:10.21203/rs.3.rs-586259/v1
Quantum-limit-breaking Magnetic Gradiometer with Entangled LightPreprint
Wu, S., Bao, G., Guo, J., Chen, J., Du, W., Yang, P., Chen, L., & Zhang, W. (2022) · Research Square · doi:10.21203/rs.3.rs-1249344/v1
Neural Activity and Oscillations as Biological Markers in Traumatic Brain Injury
Dunkley, B. T. (2023) · Biomarkers in disease · doi:10.1007/978-3-031-07395-3_46
Brain imaging and the difficulties of understanding cognitive development
Hasan, H. A., Adile, M., Hussian, A., Kadeem, S. R. A., Alubady, R., & Matti, I. (2023) · International Conference on Emerging Research in Computational Science (ICERCS) · doi:10.1109/icercs57948.2023.10434098
The neurodevelopmental trajectory of beta band oscillations: an OPM-MEG studyPreprint
Rier, L., Rhodes, N., Pakenham, D., Boto, E., Holmes, N., Hill, R. M., Rivero, G., Shah, V., Doyle, C., Osborne, J., et al. (2024) · eLife · doi:10.7554/elife.94561.2
Self-citationAtomic Gradiometers for Accuracy Enhancement of Heart Magnetic Fields Measurement
Ranjbaran, M., sedeyan, R., Zamani, A., Tehranchi, M. M., Khalkhali, S. M. H., & Hamidi, S. M. (2023) · Dunyā. · doi:10.61186/ijop.17.2.155
Luo, M. (2024) · Springer eBooks · doi:10.1007/978-981-97-6226-2_2
Zhang, Y., Tang, J., Zhai, Y., Xu, X., & Wang, Z. (2024) · Advanced Sensor Systems and Applications · doi:10.1117/12.3035860
How quantum biosensing is transforming healthcare
Fiego, A. L., Donaldson, F., Vivekananda, U., Atatüre, M., Morton, J. J. L., & Stevens, M. M. (2025) · Nature Reviews Physics · doi:10.1038/s42254-025-00890-w
Caffrey, A., McNulty, H., Rollins, M., Prasad, G., Gaur, P., Talcott, J. B., Witton, C., Cassidy, T., Marshall, B., Dornan, J. C., et al. (2021) · Figshare · doi:10.6084/m9.figshare.14190194
Optical Magnetometry with an Ensemble of Ultracold Atoms
Shibata, K., & Hirano, T. (2024) · The Review of Laser Engineering · doi:10.2184/lsj.52.3_137
Liu, Y., Xu, X., & Han, C. (2026) · IEEE Transactions on Instrumentation and Measurement · doi:10.1109/tim.2025.3650290
Lee, Y. S., & Woo, S. H. (2025) · Medical Lasers · doi:10.25289/ml.25.034
A corrected image method for uniform coil design with size adaptability in magnetic shielding rooms
Sun, J., Shi, Y., Gan, Z., Zhou, W., Feng, S., & Han, B. (2026) · Measurement · doi:10.1016/j.measurement.2026.121314
Mandke, K. N., & Rocha, S. (2026) · Cambridge University Press eBooks · doi:10.1017/9781009295888.043 · Cited by 3
Rhythm in Language Acquisition
Meyer, L., & Strauß, A. (2026) · Cambridge University Press eBooks · doi:10.1017/9781009295888.041
A Pose Calibration Method for Sensors in OPM-MEG Systems With Experimental Validation
Dai, X., Pan, D., Li, K., Jin, C., Chen, Y., & Li, L. (2026) · IEEE Transactions on Instrumentation and Measurement · doi:10.1109/tim.2026.3709494
Sun, J., Shi, Y., Ji, A., Feng, S., & Zhou, W. (2026) · Youth Academic Annual Conference of Chinese Association of Automation (YAC) · doi:10.1109/yac71005.2026.11616013
Sun, J., Shi, Y., Gan, Z., Zhou, W., & Han, B. (2026) · IEEE Transactions on Instrumentation and Measurement · doi:10.1109/tim.2026.3726226
From seeing to showing: towards a neuroscience of emotion production
Lee, S., Hwang, S., & Kim, M. J. (2026) · Philosophical Transactions of the Royal Society B Biological Sciences · doi:10.1098/rstb.2025.0136 · Cited by 1
Li, Y., Liu, X., Chen, W., Chen, X., & Zheng, S. (2026) · Sensors and Actuators A Physical · doi:10.1016/j.sna.2026.118598
Embury, C. M., Seedat, Z. A., Pier, K. S., Scott, C., Tierney, T. M., Vivekananda, U., Moeller, F., Das, K., Barnes, G. R., Tewarie, P. K. B., et al. (2026) · Clinical Neurophysiology · doi:10.1016/j.clinph.2026.2112443
Self-citation
Metadata
- Authors
- Hill, R. M., Boto, E., Holmes, N., Hartley, C., Seedat, Z. A., Leggett, J., Roberts, G., Shah, V., Tierney, T. M., Woolrich, M. W., Stagg, C. J., Barnes, G. R., Bowtell, R., Slater, R., & Brookes, M. J.
- Affiliations
- University of Nottingham (GB)
- John Radcliffe Hospital (GB)
- QuSpin (United States) (US)
- Wellcome Centre for Human Neuroimaging (GB)
- Warneford Hospital (GB)
- Corresponding author
- Brookes, Matthew J.
- ORCID
- Venue
- Nature Communications
- Published
- 2019-11-05
- Volume
- 10
- Issue
- 1
- Pages
- 4785-4785
- ISSN
- 2041-1723 (ISSN-L)
- PMC
- PMC6831615
- OpenAlex
- W2969234156
- Cited by
- 180
- References
- 35
- Citations by year
- 2026: 12 · 2025: 35 · 2024: 31 · 2023: 31 · 2022: 31 · 2021: 25 · 2020: 15
- FWCI
- 7.80
- Type
- journal article
- Language
- en
- Update notices
- correction (2019-12-04)
- Open access
- gold
- doi.org
- Locations
- Nature Communications (publishedVersion, cc-by)
- PubMed Central (publishedVersion, cc-by)
- PubMed (publishedVersion)
- Repository@Nottingham (University of Nottingham) (publishedVersion, other-oa)
- Repository@Nottingham (University of Nottingham) (submittedVersion, cc-by)
- RePEc: Research Papers in Economics (submittedVersion)
- DOAJ (DOAJ: Directory of Open Access Journals) (submittedVersion, cc-by-sa)
- DOAJ (DOAJ: Directory of Open Access Journals) (submittedVersion)
- UCL Discovery (University College London) (submittedVersion)
- Funders
- Wellcome Trust (203257/Z/16/Z, 203257/B/16/Z)
- Topics
- Physical Sciences › Physics and Astronomy › Atomic and Molecular Physics, and Optics › Atomic and Subatomic Physics Research
- Health Sciences › Medicine › Radiology, Nuclear Medicine and Imaging › Advanced MRI Techniques and Applications
- Life Sciences › Neuroscience › Cognitive Neuroscience › EEG and Brain-Computer Interfaces
- Keywords
- quantum technologies, functional neuroimaging, toddlers, children, adolescents, head movement, head growth, naturalistic learning, non-invasive brain imaging
- MeSH terms
- Adolescent, Adult, Brain, Brain Mapping, Child, Child, Preschool, Cognition, Electrophysiology, Female, Humans, Infant, Male, Magnetoencephalography, Young Adult
About these checks
Registry, retraction, Cites and statistics results are computed, not judged, with one exception: a printed reference that no index lists is read once by a model before it counts as a citation error. Claims are extracted by a model and kept only when their quote appears verbatim in the text; each cited source is then checked, with a model’s help, for whether it says what the claim relies on. Those verdicts can be wrong — read the claim’s quote and the cited source before relying on one.
Statistics and arithmetic are recomputed, not judged.
Confidence bands are shown only for fields calibrated on our annotated test set. None is calibrated yet, so no band is shown.
What counts as a claim ›How we measure confidence ›How we check this ›
Are you an author, or do you see a problem with this page? Request a review
