Cited by 138Genomics and Chromatin DynamicsChromatin Remodeling and CancerEpigenetics and DNA Methylation

The DOI matches its Crossref record; 56 of the 56 references it cites were found in a registry or an index.

Mechanisms governing the pioneering and redistribution capabilities of the non-classical pioneer PU.1

Open access

Abstract

Establishing gene regulatory networks during differentiation or reprogramming requires master or pioneer transcription factors (TFs) such as PU.1, a prototype master TF of hematopoietic lineage differentiation. To systematically determine molecular features that control its activity, here we analyze DNA-binding in vitro and genome-wide in vivo across different cell types with native or ectopic PU.1 expression. Although PU.1, in contrast to classical pioneer factors, is unable to access nucleosomal target sites in vitro, ectopic induction of PU.1 leads to the extensive remodeling of chromatin and redistribution of partner TFs. De novo chromatin access, stable binding, and redistribution of partner TFs both require PU.1's N-terminal acidic activation domain and its ability to recruit SWI/SNF remodeling complexes, suggesting that the latter may collect and distribute co-associated TFs in conjunction with the non-classical pioneer TF PU.1.

Overview

The claims and statistics of this paper haven’t been checked yet.

Run the check — free, no account needed. It reads the open-access text and checks the sources it cites.

A few free checks a day · papers already verified open instantly · results are public

Integrity signals

Registry

Crossref · 10.1038/s41467-019-13960-2

Cites

56 of 56 references verified0 citation errors · 0 not checkable

Statistics

Figures

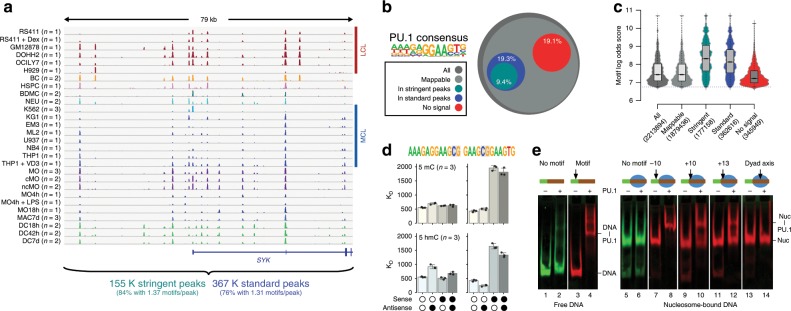
Fig. 1 PU.1 occupancy in vivo and binding constraints in vitro. a Comparison of PU.1 ChIP-seq data across various human lymphoid and myeloid cell lines (LCL and MCL, respectively) and primary cells (BC B cells, BDMC breast skin-derived mast cells, cMO classical MO, DC dendritic cells, HSPC hematopoietic stem and progenitor cells, MAC, macrophages, MO monocytes, ncMO non-classical MO, NEU neutrophils) at an exemplary locus. For replicated data sets (as indicated), averaged coverage tracks are shown. Total motif occurrences in standard and stringent peaks are summarized below the tracks. b Fraction of PU.1 motifs residing in either standard or stringent PU.1 peaks (3.61 × 10⁵ and 1.77 × 10⁵, respectively) compared with all motif occurrences (2.21 × 10⁶) across the genome, motifs filtered for mappability (1.88 × 10⁶), as well as motifs that showed no evidence of binding (<3 per 107 reads within 200 bp motif-centered window) across all samples (no signal, 3.48 × 10⁵). c Distribution of motif scores across total occurrences, mappability-filtered motifs, motifs in peaks, and no-signal motifs. d Microscale thermophoresis-derived dissociation constants (KD values, bars represent the mean of n = 3 experiments ± SD, individual data points are shown as black dots) for the interaction between recombinant full-length PU.1 and the indicated double-stranded oligonucleotides representing PU.1 motifs with a high motif log odds score (left panels, 9.4; right panel 8.8). Open circles indicate unmethylated cytosines. Black circles represent methylated or hydroxymethylated cytosines (top panels, 5mC or bottom panels, 5hmC, respectively). e Gelshift assays demonstrating position-dependent binding of PU.1 to nucleosome-associated DNA. The relative position of the PU.1-binding site (arrow) to the nucleosome boundary is indicated. Nucleosomes are positioned by the 601 nucleosome-positioning sequence marked in red. The positions of free DNA (DNA) and nucleosomes (nuc), as well as of DNA-PU.1 and nuc-PU.1 complexes are indicated. a–d Source data are provided as a Source Data file.
Fig. 1 PU.1 occupancy in vivo and binding constraints in vitro. a Comparison of PU.1 ChIP-seq data across various human lymphoid and myeloid cell lines (LCL and MCL, respectively) and primary cells (BC B cells, BDMC breast skin-derived mast cells, cMO classical MO, DC dendritic cells, HSPC hematopoietic stem and progenitor cells, MAC, macrophages, MO monocytes, ncMO non-classical MO, NEU neutrophils) at an exemplary locus. For replicated data sets (as indicated), averaged coverage tracks are shown. Total motif occurrences in standard and stringent peaks are summarized below the tracks. b Fraction of PU.1 motifs residing in either standard or stringent PU.1 peaks (3.61 × 10⁵ and 1.77 × 10⁵, respectively) compared with all motif occurrences (2.21 × 10⁶) across the genome, motifs filtered for mappability (1.88 × 10⁶), as well as motifs that showed no evidence of binding (<3 per 107 reads within 200 bp motif-centered window) across all samples (no signal, 3.48 × 10⁵). c Distribution of motif scores across total occurrences, mappability-filtered motifs, motifs in peaks, and no-signal motifs. d Microscale thermophoresis-derived dissociation constants (KD values, bars represent the mean of n = 3 experiments ± SD, individual data points are shown as black dots) for the interaction between recombinant full-length PU.1 and the indicated double-stranded oligonucleotides representing PU.1 motifs with a high motif log odds score (left panels, 9.4; right panel 8.8). Open circles indicate unmethylated cytosines. Black circles represent methylated or hydroxymethylated cytosines (top panels, 5mC or bottom panels, 5hmC, respectively). e Gelshift assays demonstrating position-dependent binding of PU.1 to nucleosome-associated DNA. The relative position of the PU.1-binding site (arrow) to the nucleosome boundary is indicated. Nucleosomes are positioned by the 601 nucleosome-positioning sequence marked in red. The positions of free DNA (DNA) and nucleosomes (nuc), as well as of DNA-PU.1 and nuc-PU.1 complexes are indicated. a–d Source data are provided as a Source Data file.CC BY · PubMed Central
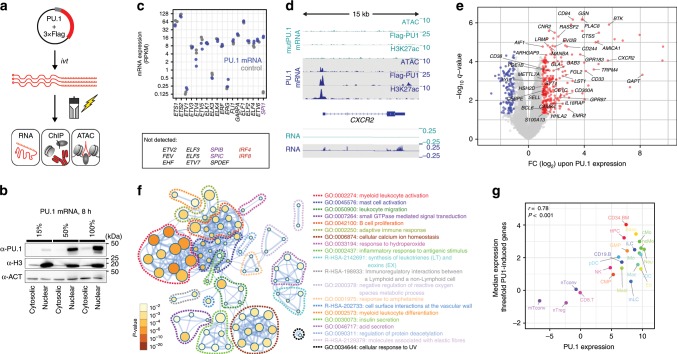
Fig. 2 Transient PU.1 expression induces a myeloid expression program. a Schematic of the experimental setup. b Immunoblotting confirming the translation and nuclear location of full-length PU.1 in transfected cells using increasing amounts of IVT mRNA. c Relative mRNA expression levels of ETS family members in PU.1-expressing or control cells measured by RNA-seq (n = 2 each). d Example tracks for a PU.1-activated gene. Coverage represents the mean of n = 3 or n = 2 experiments for ATAC/ChIP-seq or RNA-seq data, respectively. e Volcano plot of significantly PU.1 up- or downregulated genes (red or blue, respectively). Genes with known function in myeloid or B-cell biology are labeled. f Metascape-derived network of Gene Ontology (GO) terms associated with PU.1-induced genes in CTV-1 cells. The significance of enrichment of a particular term is depicted with the log10 of the p-value and indicated by node coloring. g Comparison of median expression levels of PU.1-induced genes (threefold) with PU.1 expression levels across various human blood cell types data based on CAGE (Cap Analysis of Gene Expression) expression data from the FANTOM Consortium35. Related cell types in the hematopoietic tree share similar colors. The Pearson’s correlation as well as the corresponding p-value are indicated. b, c, e–g Source data are provided as a Source Data file.
Fig. 2 Transient PU.1 expression induces a myeloid expression program. a Schematic of the experimental setup. b Immunoblotting confirming the translation and nuclear location of full-length PU.1 in transfected cells using increasing amounts of IVT mRNA. c Relative mRNA expression levels of ETS family members in PU.1-expressing or control cells measured by RNA-seq (n = 2 each). d Example tracks for a PU.1-activated gene. Coverage represents the mean of n = 3 or n = 2 experiments for ATAC/ChIP-seq or RNA-seq data, respectively. e Volcano plot of significantly PU.1 up- or downregulated genes (red or blue, respectively). Genes with known function in myeloid or B-cell biology are labeled. f Metascape-derived network of Gene Ontology (GO) terms associated with PU.1-induced genes in CTV-1 cells. The significance of enrichment of a particular term is depicted with the log10 of the p-value and indicated by node coloring. g Comparison of median expression levels of PU.1-induced genes (threefold) with PU.1 expression levels across various human blood cell types data based on CAGE (Cap Analysis of Gene Expression) expression data from the FANTOM Consortium35. Related cell types in the hematopoietic tree share similar colors. The Pearson’s correlation as well as the corresponding p-value are indicated. b, c, e–g Source data are provided as a Source Data file.CC BY · PubMed Central
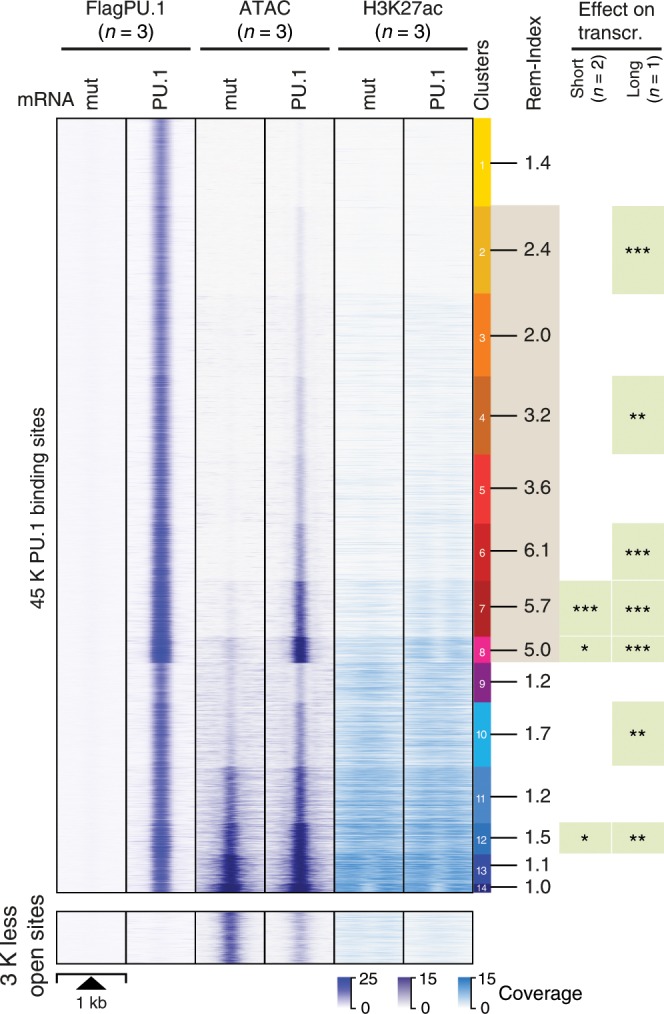
Fig. 3 PU.1-induced changes in chromatin accessibility. The distribution of average PU.1 ChIP-seq, ATAC-seq, and H3K27ac ChIP-seq signals of PU.1 vs. PU.1mut mRNA-transfected cells 8 h after electroporation are plotted across 1 kb windows and 45 K PU.1-binding sites (top panel) or 3 K regions that lost accessibility after PU.1 induction (bottom panel) in CTV-1 cells. PU.1 peaks are ordered according to K-means clustering of peak-centered ATAC-seq signals. PU.1 peak clusters are indicated by the color bar on the right, along with the average remodeling index (Rem-Index) of each cluster. The asterisks on the right indicates the significant induction of mRNA expression across genes associated with PU.1 peaks in the indicated peak cluster (***P < 0.001; **P < 0.01; *P < 0.05; paired Wilcoxon’s test) in PU.1-expressing CTV-1 cells. The coloring of PU.1 peak clusters is kept consistent in all following analyses based on the clustering. Source data are provided as a Source Data file.
Fig. 3 PU.1-induced changes in chromatin accessibility. The distribution of average PU.1 ChIP-seq, ATAC-seq, and H3K27ac ChIP-seq signals of PU.1 vs. PU.1mut mRNA-transfected cells 8 h after electroporation are plotted across 1 kb windows and 45 K PU.1-binding sites (top panel) or 3 K regions that lost accessibility after PU.1 induction (bottom panel) in CTV-1 cells. PU.1 peaks are ordered according to K-means clustering of peak-centered ATAC-seq signals. PU.1 peak clusters are indicated by the color bar on the right, along with the average remodeling index (Rem-Index) of each cluster. The asterisks on the right indicates the significant induction of mRNA expression across genes associated with PU.1 peaks in the indicated peak cluster (***P < 0.001; **P < 0.01; *P < 0.05; paired Wilcoxon’s test) in PU.1-expressing CTV-1 cells. The coloring of PU.1 peak clusters is kept consistent in all following analyses based on the clustering. Source data are provided as a Source Data file.CC BY · PubMed Central
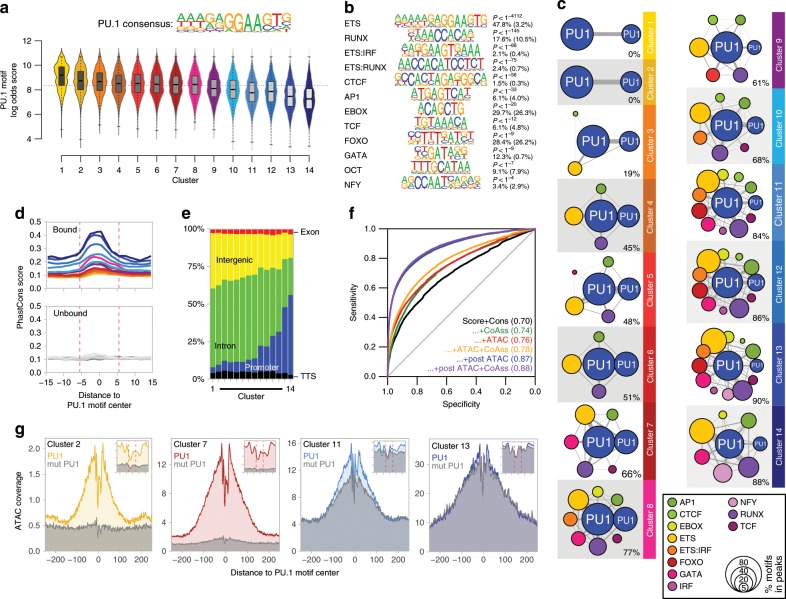
Fig. 4 Genomic features of PU.1-induced accessible sites. a The PU.1 motif log odds score distribution of the consensus MAC PU.1 motif, generated earlier, is shown for each cluster. The median of the specific distribution across all clusters is depicted inside the bean with a conventional boxplot. b De novo-derived co-associated motifs enriched across ATAC-seq-derived PU.1 peak clusters. The best motifs corresponding to known factor families derived from individual clusters are shown. Significance of motif enrichment (hypergeometric test) and the fraction of motifs in peaks (background values are given in parenthesis) correspond to their distribution across all PU.1 peak regions. c Motif co-enrichment networks for individual clusters are shown. The size of each node represents the motif enrichment (fraction of peaks) and co-associated TF motifs (PU.1 masked) are indicated by coloring. The second PU.1 node corresponds to the fraction of peaks containing at least two PU.1 motifs. Edge thickness indicates the frequency of motif co-association within the PU.1 peak. The fraction of PU.1 peaks overlapping with co-associated (PU.1 masked) TF motifs is given below each network. d Evolutionary conservation of the PU.1 motif across the K-means clusters, color coded as in Fig. 3 as illustrated by the PhastCons score. Corresponding sequence-matched random control sets of non-bound motifs are shown in the bottom histogram (in dark gray to light gray). e Genome ontology analysis across the K-means clusters is shown in a stacked bar chart. The association with the individual regions is given as the fraction of peaks in each cluster. f Predictability of PU.1 binding from motif score, conservation score, nearby presence of co-associated motifs, and chromatin accessibility before and after PU.1 induction. Shown are ROC curves of logistic models with different sets of predictors (AUC in parentheses), trained and evaluated on separate subsets of the data. g Representative ATAC-seq footprints across motif-centered, cluster-associated peaks (as indicated by coloring). Corresponding footprints of control cells (mutPU.1) are shown in gray. Smaller histograms in the upper right corner zoom into the central part of the main graph. The position of the PU.1 motif is indicated by two vertical dashed lines. a–g Source data are provided as a Source Data file.
Fig. 4 Genomic features of PU.1-induced accessible sites. a The PU.1 motif log odds score distribution of the consensus MAC PU.1 motif, generated earlier, is shown for each cluster. The median of the specific distribution across all clusters is depicted inside the bean with a conventional boxplot. b De novo-derived co-associated motifs enriched across ATAC-seq-derived PU.1 peak clusters. The best motifs corresponding to known factor families derived from individual clusters are shown. Significance of motif enrichment (hypergeometric test) and the fraction of motifs in peaks (background values are given in parenthesis) correspond to their distribution across all PU.1 peak regions. c Motif co-enrichment networks for individual clusters are shown. The size of each node represents the motif enrichment (fraction of peaks) and co-associated TF motifs (PU.1 masked) are indicated by coloring. The second PU.1 node corresponds to the fraction of peaks containing at least two PU.1 motifs. Edge thickness indicates the frequency of motif co-association within the PU.1 peak. The fraction of PU.1 peaks overlapping with co-associated (PU.1 masked) TF motifs is given below each network. d Evolutionary conservation of the PU.1 motif across the K-means clusters, color coded as in Fig. 3 as illustrated by the PhastCons score. Corresponding sequence-matched random control sets of non-bound motifs are shown in the bottom histogram (in dark gray to light gray). e Genome ontology analysis across the K-means clusters is shown in a stacked bar chart. The association with the individual regions is given as the fraction of peaks in each cluster. f Predictability of PU.1 binding from motif score, conservation score, nearby presence of co-associated motifs, and chromatin accessibility before and after PU.1 induction. Shown are ROC curves of logistic models with different sets of predictors (AUC in parentheses), trained and evaluated on separate subsets of the data. g Representative ATAC-seq footprints across motif-centered, cluster-associated peaks (as indicated by coloring). Corresponding footprints of control cells (mutPU.1) are shown in gray. Smaller histograms in the upper right corner zoom into the central part of the main graph. The position of the PU.1 motif is indicated by two vertical dashed lines. a–g Source data are provided as a Source Data file.CC BY · PubMed Central
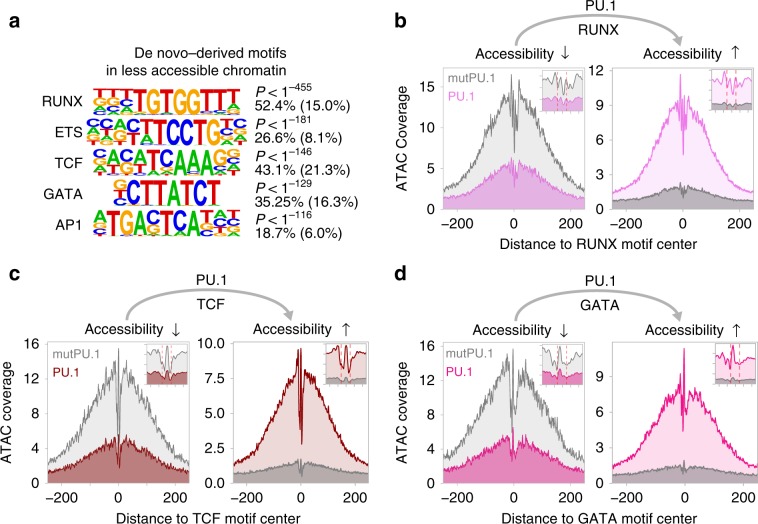
Fig. 5 Motif signatures at sites loosing accessibility. a De novo-derived motifs enriched across regions that lost accessibility upon PU.1 induction in CTV-1 cells. The best motifs corresponding to known factor families derived from individual clusters are shown. The significance of motif enrichment (hypergeometric test) and the fraction of motifs in peaks (background values are in parenthesis) are given for the top five motifs corresponding to known motif families. b–d Representative ATAC-seq footprints across enriched motif-centered peaks that either lost or gained accessibility upon PU.1 induction in CTV-1 cells. Footprints of control cells (mutPU.1) are in grey, footprints of PU.1 mRNA-transfected cells are colored. Smaller histograms in the upper right corner zoom into the central part of the main graph. The position of the PU.1 motif is indicated by two vertical dashed lines. a–d Source data are provided as a Source Data file.
Fig. 5 Motif signatures at sites loosing accessibility. a De novo-derived motifs enriched across regions that lost accessibility upon PU.1 induction in CTV-1 cells. The best motifs corresponding to known factor families derived from individual clusters are shown. The significance of motif enrichment (hypergeometric test) and the fraction of motifs in peaks (background values are in parenthesis) are given for the top five motifs corresponding to known motif families. b–d Representative ATAC-seq footprints across enriched motif-centered peaks that either lost or gained accessibility upon PU.1 induction in CTV-1 cells. Footprints of control cells (mutPU.1) are in grey, footprints of PU.1 mRNA-transfected cells are colored. Smaller histograms in the upper right corner zoom into the central part of the main graph. The position of the PU.1 motif is indicated by two vertical dashed lines. a–d Source data are provided as a Source Data file.CC BY · PubMed Central
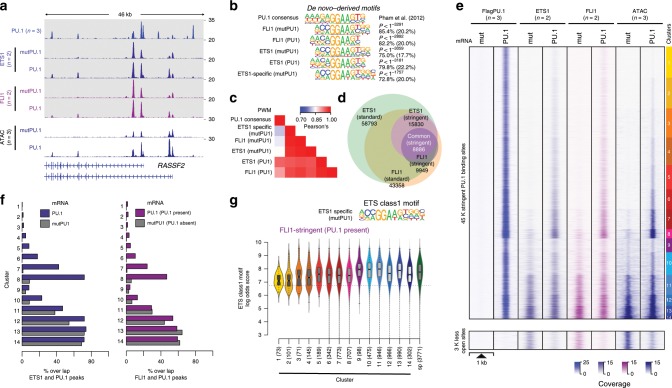
Fig. 6 Overlap between ETS1/FLI1 and PU.1-binding sites. a IGV genome browser tracks of the RASSF2 locus showing average PU.1 (blue), ETS1 (purple), and FLI1 (pink) ChIP-seq coverage in control (mutPU.1) and PU.1-expressing cells. ATAC-seq coverage of PU.1-transfected and control cells are depicted in blue below the ChIP-seq tracks. b De novo-derived motif enrichment across the indicated ChIP-seq peaks. c Correlation matrix heatmap for position weight matrices (PWM) of the motifs shown in b. d Venn–Euler diagram showing the overlap of ETS1 and FLI1 ChIP-seq peaks (using stringent and standard peak calling). e Distribution of PU.1, ETS1, and FLI1 ChIP-seq, as well as ATAC-seq signals before and after PU.1 expression plotted across the ATAC-seq-derived PU.1 peak clusters (top panel), as well as regions that lost accessibility after PU.1 induction (bottom panel) in CTV-1 cells, as introduced in Fig. 3. f Bar plots displaying the overlap of stringent ETS1 (left panel) and FLI1 (right panel) peaks in PU.1-transfected (blue/purple bars) and control CTV-1 cells not expressing PU.1 (gray bars) with PU.1 peaks across the PU.1 peak clusters introduced in Fig. 3. g Motif log odds score distribution of the consensus ETS class 1 motif is shown for FLI1-overlapping peaks across ATAC-seq-derived PU.1 peak clusters along with FLI1 specific (sp) peaks. The median of each distribution is depicted inside the bean with a conventional boxplot. b–g Source data are provided as a Source Data file.
Fig. 6 Overlap between ETS1/FLI1 and PU.1-binding sites. a IGV genome browser tracks of the RASSF2 locus showing average PU.1 (blue), ETS1 (purple), and FLI1 (pink) ChIP-seq coverage in control (mutPU.1) and PU.1-expressing cells. ATAC-seq coverage of PU.1-transfected and control cells are depicted in blue below the ChIP-seq tracks. b De novo-derived motif enrichment across the indicated ChIP-seq peaks. c Correlation matrix heatmap for position weight matrices (PWM) of the motifs shown in b. d Venn–Euler diagram showing the overlap of ETS1 and FLI1 ChIP-seq peaks (using stringent and standard peak calling). e Distribution of PU.1, ETS1, and FLI1 ChIP-seq, as well as ATAC-seq signals before and after PU.1 expression plotted across the ATAC-seq-derived PU.1 peak clusters (top panel), as well as regions that lost accessibility after PU.1 induction (bottom panel) in CTV-1 cells, as introduced in Fig. 3. f Bar plots displaying the overlap of stringent ETS1 (left panel) and FLI1 (right panel) peaks in PU.1-transfected (blue/purple bars) and control CTV-1 cells not expressing PU.1 (gray bars) with PU.1 peaks across the PU.1 peak clusters introduced in Fig. 3. g Motif log odds score distribution of the consensus ETS class 1 motif is shown for FLI1-overlapping peaks across ATAC-seq-derived PU.1 peak clusters along with FLI1 specific (sp) peaks. The median of each distribution is depicted inside the bean with a conventional boxplot. b–g Source data are provided as a Source Data file.CC BY · PubMed Central
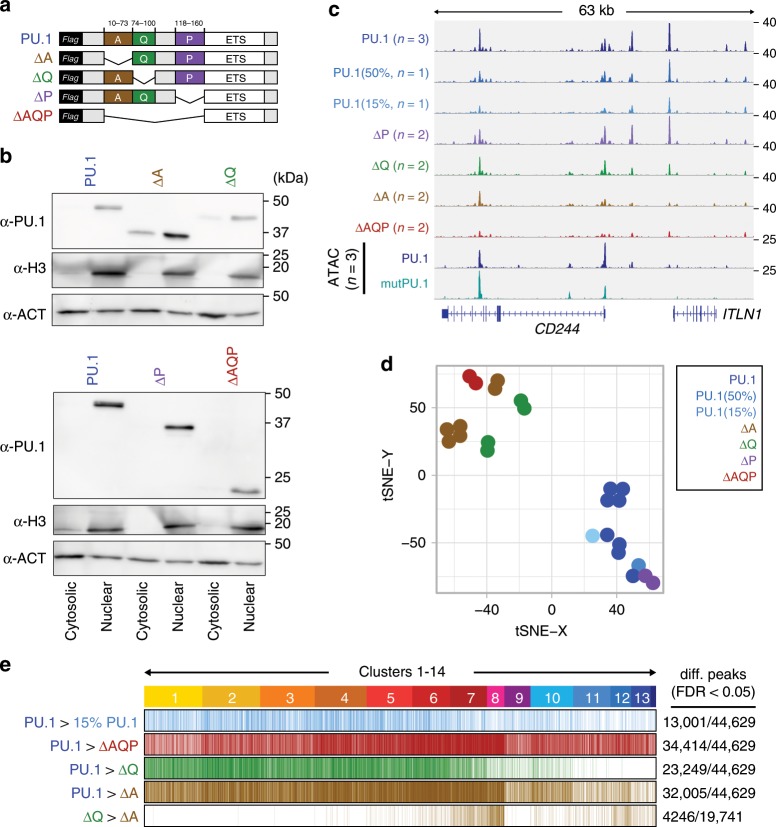
Fig. 7 Effect of PU.1 protein domains on chromatin access. a Design of PU.1-deletion mutants. The DNA-binding domain (ETS domain) was kept in all constructs and a 3 × -FLAG-tag was added N-terminal for detection. b Immunoblot confirming the nuclear expression of PU.1-deletion mutants compared with full-length PU.1 in transfected cells using IVT mRNA. c IGV genome browser tracks of the CD84 locus showing PU.1 ChIP-seq coverage of CTV-1 cells transfected with varying amounts of PU.1 IVT mRNA as well as PU.1 mutant mRNA. ATAC-seq coverage of CTV-1 cells transfected with PU.1 (blue) and mutPU.1 (turquoise) IVT mRNA is depicted in the two bottom rows. d Two-dimensional visualization of the distribution of the indicated samples across annotated PU.1 peaks using tSNE embedding. Replicates of the same mRNA transfections are indicated by coloring. e Differential ChIP-seq peaks of WT vs. less PU.1 (15%, light blue), WT vs. ΔAQP (red), WT vs. ΔQ (green), and WT vs. ΔA (brown), as well as differential peaks between ΔQ vs. ΔA (brown) are shown across ATAC-seq-derived PU.1 peak clusters (introduced in Fig. 3). b–e Source data are provided as a Source Data file.
Fig. 7 Effect of PU.1 protein domains on chromatin access. a Design of PU.1-deletion mutants. The DNA-binding domain (ETS domain) was kept in all constructs and a 3 × -FLAG-tag was added N-terminal for detection. b Immunoblot confirming the nuclear expression of PU.1-deletion mutants compared with full-length PU.1 in transfected cells using IVT mRNA. c IGV genome browser tracks of the CD84 locus showing PU.1 ChIP-seq coverage of CTV-1 cells transfected with varying amounts of PU.1 IVT mRNA as well as PU.1 mutant mRNA. ATAC-seq coverage of CTV-1 cells transfected with PU.1 (blue) and mutPU.1 (turquoise) IVT mRNA is depicted in the two bottom rows. d Two-dimensional visualization of the distribution of the indicated samples across annotated PU.1 peaks using tSNE embedding. Replicates of the same mRNA transfections are indicated by coloring. e Differential ChIP-seq peaks of WT vs. less PU.1 (15%, light blue), WT vs. ΔAQP (red), WT vs. ΔQ (green), and WT vs. ΔA (brown), as well as differential peaks between ΔQ vs. ΔA (brown) are shown across ATAC-seq-derived PU.1 peak clusters (introduced in Fig. 3). b–e Source data are provided as a Source Data file.CC BY · PubMed Central
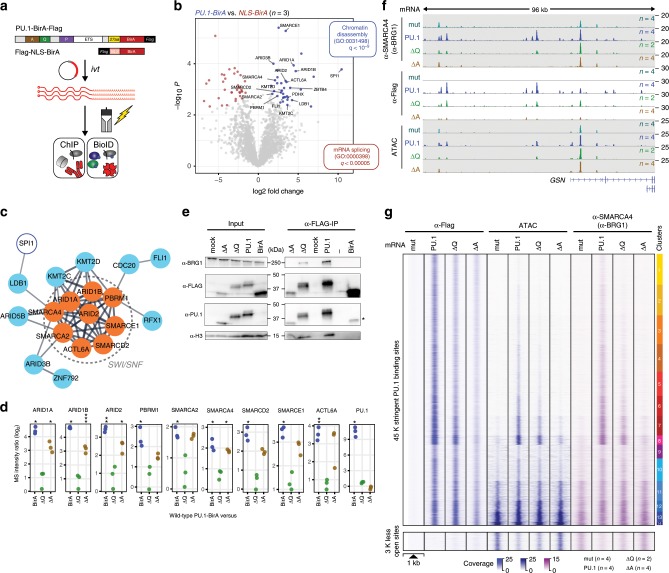
Fig. 8 Identification of PU.1 proximal proteins using BioID. a Schematic of the experimental setup. b Volcano plot illustrating proteins significantly enriched in PU.1-BirA-mRNA-transfected CTV-1 cells compared with NLS-BirA-mRNA-transfected control cells. Blue dots represent proteins with FDR < 0.05 and log fold change (logFC) > 2. Only PU.1-specific proteins of GO terms for chromatin organization and interesting transcriptional regulators are highlighted. c STRING analysis illustrating the functional protein association network. The network view summarizes predicted associations for proteins significantly enriched in the PU.1-BioID. The network nodes represent the proteins, the edges represent predicted functional associations. Only connected nodes are shown. d Dot plots showing the enrichment of peptides (ratios of log2-transformed normalized iBAQ values) representing the indicated SWI/SNF components (PU.1/SPI1 is shown as a control) in BioIDs from PU.1-BirA vs. NLS-BirA (control), ΔQ-BirA, or ΔA-BirA-mRNA-transfected CTV-1 cells (***P < 0.001; **P < 0.01; *P < 0.05; paired t-test, permutation-based correction). e Immunoblotting of αFLAG mAb immunoprecipitations (5 h after electroporation, IP 5 h), along with corresponding input lysates of control (mock), PU.1, ΔQ, ΔA, and BirA-mRNA-transfected cells using the indicated antibodies. f IGV genome browser tracks for the GSN locus showing SMARCA4 (BRG1) and PU.1 ChIP-seq, as well as ATAC-seq coverage in control (mutPU.1, gray–green)-, PU.1 (blue)-, ΔQ mutant (green)-, and ΔA mutant (lightbrown)-expressing cells. g Distribution of the PU.1 ChIP-seq, ATAC-seq signal, and SMARCA4 (BRG1) ChIP-seq signals in control (mutPU.1), PU.1, ΔQ, and ΔA mRNA-transfected cells across the 45 K clustered PU.1-binding sites, as well as the disappearing ~3 K sites that were accessible prior to PU.1 induction. b–e, g Source data are provided as a Source Data file.
Fig. 8 Identification of PU.1 proximal proteins using BioID. a Schematic of the experimental setup. b Volcano plot illustrating proteins significantly enriched in PU.1-BirA-mRNA-transfected CTV-1 cells compared with NLS-BirA-mRNA-transfected control cells. Blue dots represent proteins with FDR < 0.05 and log fold change (logFC) > 2. Only PU.1-specific proteins of GO terms for chromatin organization and interesting transcriptional regulators are highlighted. c STRING analysis illustrating the functional protein association network. The network view summarizes predicted associations for proteins significantly enriched in the PU.1-BioID. The network nodes represent the proteins, the edges represent predicted functional associations. Only connected nodes are shown. d Dot plots showing the enrichment of peptides (ratios of log2-transformed normalized iBAQ values) representing the indicated SWI/SNF components (PU.1/SPI1 is shown as a control) in BioIDs from PU.1-BirA vs. NLS-BirA (control), ΔQ-BirA, or ΔA-BirA-mRNA-transfected CTV-1 cells (***P < 0.001; **P < 0.01; *P < 0.05; paired t-test, permutation-based correction). e Immunoblotting of αFLAG mAb immunoprecipitations (5 h after electroporation, IP 5 h), along with corresponding input lysates of control (mock), PU.1, ΔQ, ΔA, and BirA-mRNA-transfected cells using the indicated antibodies. f IGV genome browser tracks for the GSN locus showing SMARCA4 (BRG1) and PU.1 ChIP-seq, as well as ATAC-seq coverage in control (mutPU.1, gray–green)-, PU.1 (blue)-, ΔQ mutant (green)-, and ΔA mutant (lightbrown)-expressing cells. g Distribution of the PU.1 ChIP-seq, ATAC-seq signal, and SMARCA4 (BRG1) ChIP-seq signals in control (mutPU.1), PU.1, ΔQ, and ΔA mRNA-transfected cells across the 45 K clustered PU.1-binding sites, as well as the disappearing ~3 K sites that were accessible prior to PU.1 induction. b–e, g Source data are provided as a Source Data file.CC BY · PubMed Central

Verification

Claims the paper makes

The claims and statistics of this paper haven’t been checked yet.

Run the check — free, no account needed. It reads the open-access text and checks the sources it cites.

A few free checks a day · papers already verified open instantly · results are public

Claims other papers make about this one

Each is checked against this paper’s own text: does it say what the citing paper says it does?

Self-check

Percentages, sums and reported differences re-computed from the paper’s own numbers.

The self-check needs the paper’s full text.

Citations

Cites

Show all 56 references

Cited by

Sorted by citations

See all 138

Metadata

Authors
Minderjahn, J., Schmidt, A., Fuchs, A., Schill, R., Raithel, J., Babina, M., Schmidl, C., Gebhard, C., Schmidhofer, S., Mendes, K., Ratermann, A., Glatz, D., Nützel, M., Edinger, M., Hoffmann, P., Spang, R., Längst, G., Imhof, A., & Rehli, M.
Affiliations
  • University Hospital Regensburg (DE)
  • Ludwig-Maximilians-Universität München (DE)
  • University of Regensburg (DE)
  • Charité – Universitätsmedizin Berlin (DE)
  • Hôpital Maisonneuve-Rosemont (CA)
Corresponding author
Rehli, Michael
Venue
Nature Communications
Published
2020-01-21
Volume
11
Issue
1
Pages
402-402
ISSN
2041-1723 (ISSN-L)
OpenAlex
W3000851240
Cited by
136
References
56
Citations by year
2026: 19 · 2025: 16 · 2024: 36 · 2023: 18 · 2022: 16 · 2021: 18 · 2020: 13
FWCI
5.27
Type
journal article
Language
en
Open access
Locations
  • Nature Communications (publishedVersion, cc-by)
  • PubMed Central (publishedVersion, cc-by)
  • PubMed (publishedVersion)
  • University of Regensburg Publication Server (University of Regensburg) (acceptedVersion)
  • RePEc: Research Papers in Economics (submittedVersion)
  • DOAJ (DOAJ: Directory of Open Access Journals) (submittedVersion)
  • DOAJ (DOAJ: Directory of Open Access Journals) (submittedVersion, cc-by-sa)
  • Open access LMU (Ludwid Maxmilian's Universitat Munchen) (submittedVersion, cc-by)
  • University of Regensburg Publication Server (University of Regensburg)
Funders
Deutsche Forschungsgemeinschaft (RE 1310/17)
Topics
  • Life Sciences › Biochemistry, Genetics and Molecular Biology › Molecular Biology › Genomics and Chromatin Dynamics
  • Life Sciences › Biochemistry, Genetics and Molecular Biology › Molecular Biology › Chromatin Remodeling and Cancer
  • Life Sciences › Biochemistry, Genetics and Molecular Biology › Molecular Biology › Epigenetics and DNA Methylation
Keywords
PU.1, pioneer transcription factors, hematopoietic differentiation, chromatin remodeling, SWI/SNF complex, nucleosome accessibility, transcription factor-DNA binding, gene regulatory networks, transcriptional reprogramming
MeSH terms
Protein Domains, RNA-Seq, Proto-Oncogene Protein Spi-1, Binding Sites, Cell Differentiation, Chromosomal Proteins, Non-Histone, DNA, Hematopoiesis, Hematopoietic Stem Cells, Humans, Leukapheresis, Nucleosomes, Proto-Oncogene Proteins, Trans-Activators, Chromatin Assembly and Disassembly, Cell Line, Tumor, Gene Regulatory Networks, Healthy Volunteers

About these checks

Registry, retraction, Cites and statistics results are computed, not judged, with one exception: a printed reference that no index lists is read once by a model before it counts as a citation error. Claims are extracted by a model and kept only when their quote appears verbatim in the text; each cited source is then checked, with a model’s help, for whether it says what the claim relies on. Those verdicts can be wrong — read the claim’s quote and the cited source before relying on one.

Statistics and arithmetic are recomputed, not judged.

Confidence bands are shown only for fields calibrated on our annotated test set. None is calibrated yet, so no band is shown.

What counts as a claim ›How we measure confidence ›How we check this ›

Are you an author, or do you see a problem with this page? Request a review