

The DOI matches its Crossref record; 59 of the 60 references it cites were found in a registry or an index.
Immuno-genomic landscape of osteosarcoma
Open accessAbstract
Limited clinical activity has been seen in osteosarcoma (OS) patients treated with immune checkpoint inhibitors (ICI). To gain insights into the immunogenic potential of these tumors, we conducted whole genome, RNA, and T-cell receptor sequencing, immunohistochemistry and reverse phase protein array profiling (RPPA) on OS specimens from 48 pediatric and adult patients with primary, relapsed, and metastatic OS. Median immune infiltrate level was lower than in other tumor types where ICI are effective, with concomitant low T-cell receptor clonalities. Neoantigen expression in OS was lacking and significantly associated with high levels of nonsense-mediated decay (NMD). Samples with low immune infiltrate had higher number of deleted genes while those with high immune infiltrate expressed higher levels of adaptive resistance pathways. PARP2 expression levels were significantly negatively associated with the immune infiltrate. Together, these data reveal multiple immunosuppressive features of OS and suggest immunotherapeutic opportunities in OS patients.
Overview
The claims and statistics of this paper haven’t been checked yet.
Run the check — free, no account needed. It reads the open-access text and checks the sources it cites.
Integrity signals
Registry
Cites
Statistics
Figures
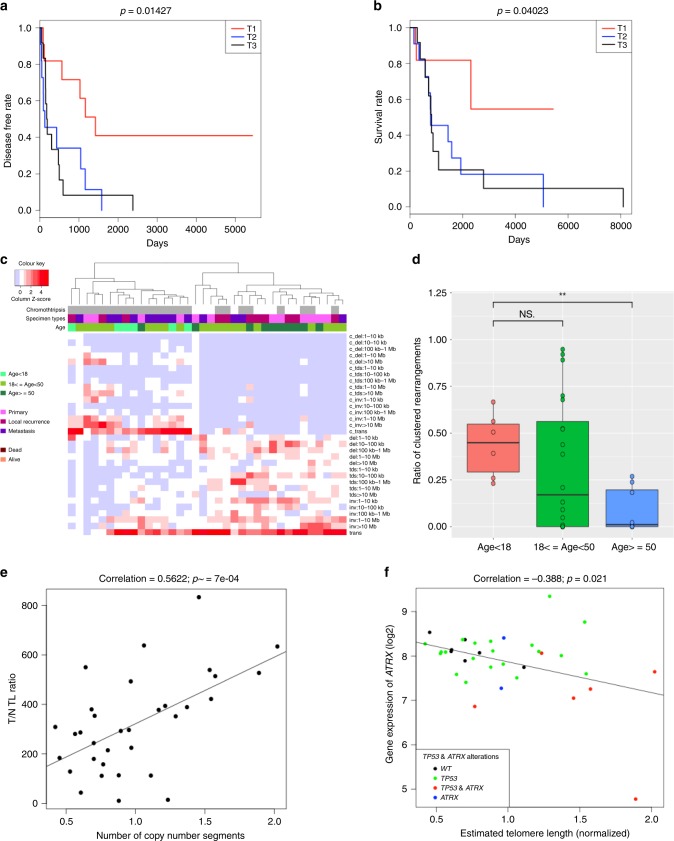
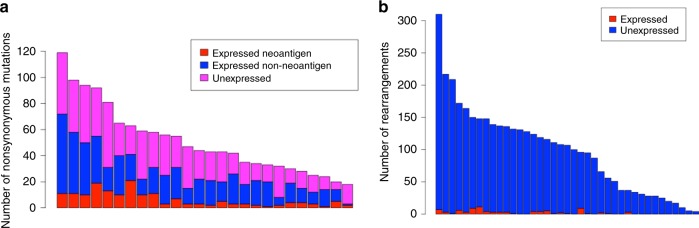
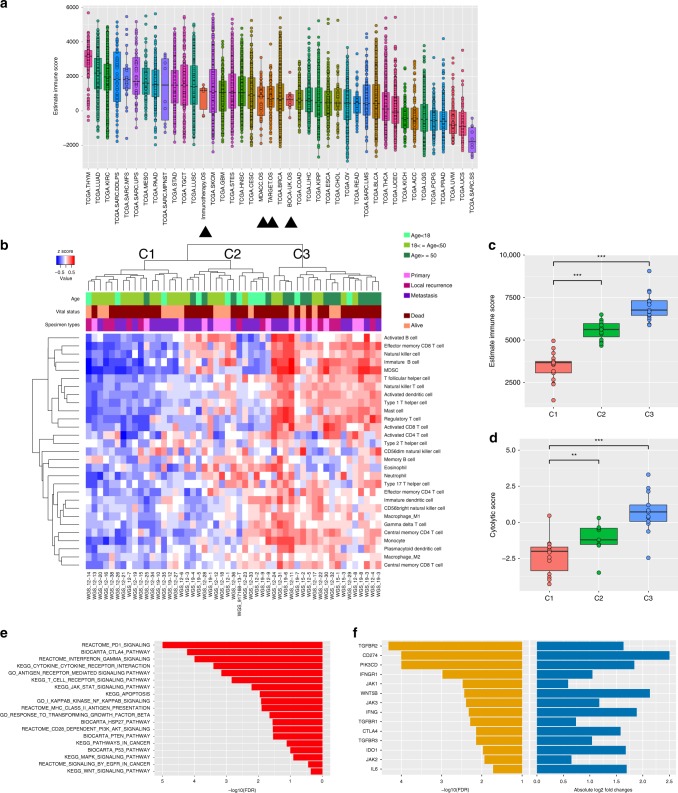
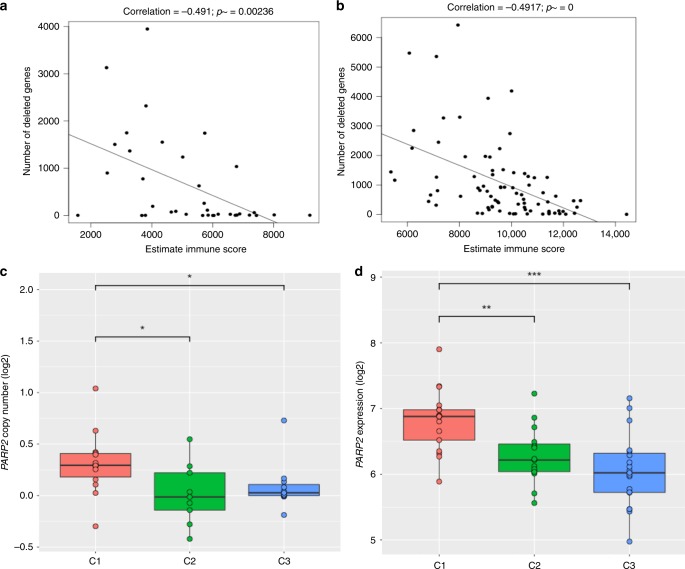
Verification
Claims the paper makes
The claims and statistics of this paper haven’t been checked yet.
Run the check — free, no account needed. It reads the open-access text and checks the sources it cites.
Claims other papers make about this one
Each is checked against this paper’s own text: does it say what the citing paper says it does?
The source backs part of the claim, not all of it — or backs it for a different population, condition or comparison.
In the citing paper
“The single most frequently altered gene is the tumour suppressor TP53, which is lost in >90% of osteosarcoma tumours, with the majority lost through intron 1 rearrangements or deletions rather than through point mutations 33,36,38 .”
From Osteosarcoma (2022) · cites this paper as [36]
Experimental — accuracy not yet measuredThe source backs part of the claim, not all of it — or backs it for a different population, condition or comparison.
In the citing paper
“A recent and comprehensive characterization of the immuno-genomic landscape of osteosarcoma suggests that the majority of osteosarcomas are “cold” tumors, with low levels of immune cell infiltration, low-to-moderate tumor mutation burden and lack of neoantigen expression [24].”
From Pembrolizumab in advanced osteosarcoma: results of a single-arm, open-label, phase 2 trial (2021) · cites this paper as [24]
Experimental — accuracy not yet measuredThe cited source says what the claim attributes to it.
In the citing paper
“However, due to the high heterogeneity of somatic mutations in osteosarcoma,14,15 the use of a tumor-agnostic MRD panel would compromise sensitivity, leading to reduced sequencing depth and overlooking unique somatic variants.”
From Tumor-informed deep sequencing of ctDNA detects minimal residual disease and predicts relapse in osteosarcoma (2024) · cites this paper as [15]
The cited source says what the claim attributes to it.
In the citing paper
“Besides, there are likely multiple immune-suppressive mechanisms in play in osteosarcoma [75].”
From Advances on immunotherapy for osteosarcoma (2024) · cites this paper as [75]
In the citing paper
“Osteosarcoma tumours often show signs of whole-genome duplication, which probably occurs in response to stresses imposed by pervasive copy number losses 36 .”
From Osteosarcoma (2022) · cites this paper as [36]
In the citing paper
“deletion of ATRX, which seems to activate alternative lengthening of telomeres and is associated with decreased survival 36,43 .”
From Osteosarcoma (2022) · cites this paper as [36]
In the citing paper
“large-scale sequencing has identified only moderate levels of point mutations with few recurrently mutated genes 33,34,36,38 .”
From Osteosarcoma (2022) · cites this paper as [36]
In the citing paper
“Even in the context of osteosarcoma, older patients have a profile that is more associated with response to ICIs 36 .”
From Osteosarcoma (2022) · cites this paper as [36]
In the citing paper
“Despite being known as one of the most genomically complex paediatric malignancies, many of the alterations that occur in osteosarcoma are translocation events that silence genes rather than create neoantigens 36 .”
From Osteosarcoma (2022) · cites this paper as [36]
Self-check
Percentages, sums and reported differences re-computed from the paper’s own numbers.
The self-check needs the paper’s full text.
Citations
Cites
STAR: ultrafast universal RNA-seq aligner
Dobin, A., Davis, C. A., Schlesinger, F., Drenkow, J., Zaleski, C., Jha, S., Batut, P., Chaisson, M., & Gingeras, T. R. (2013) · Bioinformatics · doi:10.1093/bioinformatics/bts635 · Cited by 51,709
HTSeq—a Python framework to work with high-throughput sequencing data
Anders, S., Pyl, P. T., & Huber, W. (2015) · Bioinformatics · doi:10.1093/bioinformatics/btu638 · Cited by 21,464
Tree View: An application to display phylogenetic trees on personal computers
Page, R. (1996) · Computer applications in the biosciences · doi:10.1093/bioinformatics/12.4.357 · Cited by 10,223
Mootha, V. K., Lindgren, C. M., Eriksson, K.-F., Subramanian, A., Sihag, S., Lehar, J., Puigserver, P., Carlsson, E., Ridderstråle, M., Laurila, E., et al. (2003) · Nature Genetics · doi:10.1038/ng1180 · Cited by 10,197
Inferring tumour purity and stromal and immune cell admixture from expression data
Yoshihara, K., Shahmoradgoli, M., Martínez, E., Vegesna, R., Kim, H., Torres-Garcia, W., Treviño, V., Shen, H., Laird, P. W., Levine, D. A., et al. (2013) · Nature Communications · doi:10.1038/ncomms3612 · Cited by 9,778
Self-citationSignatures of mutational processes in human cancer
Initiative, A. P. C. G., Alexandrov, L. B., ICGC Breast Cancer Consortium, ICGC MMML-Seq Consortium, PedBrain, I., Nik-Zainal, S., Wedge, D. C., Aparicio, S. A. J. R., Behjati, S., Biankin, A. V., et al. (2013) · Nature · doi:10.1038/nature12477 · Cited by 9,660
Mutational landscape determines sensitivity to PD-1 blockade in non–small cell lung cancer
Rizvi, N. A., Hellmann, M. D., Snyder, A., Kvistborg, P., Makarov, V., Havel, J. J., Lee, W., Yuan, J., Wong, P., Ho, T. S., et al. (2015) · Science · doi:10.1126/science.aaa1348 · Cited by 7,802
TIMER: A Web Server for Comprehensive Analysis of Tumor-Infiltrating Immune Cells
Li, T., Fan, J., Wang, B., Traugh, N. C., Chen, Q., Liu, J. S., Li, B., & Liu, X. S. (2017) · Cancer Research · doi:10.1158/0008-5472.can-17-0307 · Cited by 5,914
limma: Linear Models for Microarray Data
Smyth, G. K. (2005) · Statistics for Biology and Health · doi:10.1007/0-387-29362-0_23 · Cited by 5,796
Charoentong, P., Finotello, F., Angelova, M., Mayer, C., Efremova, M., Rieder, D., Hackl, H., & Trajanoski, Z. (2017) · Cell Reports · doi:10.1016/j.celrep.2016.12.019 · Cited by 5,041
Sensitive detection of somatic point mutations in impure and heterogeneous cancer samples
Cibulskis, K., Lawrence, M. S., Carter, S. L., Sivachenko, A., Jaffe, D. B., Sougnez, C. L., Gabriel, S., Meyerson, M. M., Lander, E. S., & Getz, G. A. (2013) · Nature Biotechnology · doi:10.1038/nbt.2514 · Cited by 4,965
Molecular and genetic properties of tumors associated with local immune cytolytic activity
Rooney, M. S., Shukla, S. A., Wu, C. J., Getz, G., & Hacohen, N. (2015) · Cell · doi:10.1016/j.cell.2014.12.033 · Cited by 3,825
Self-citationMermel, C. H., Schumacher, S. E., Hill, B., Meyerson, M. M., Beroukhim, R., & Getz, G. A. (2011) · Genome biology · doi:10.1186/gb-2011-12-4-r41 · Cited by 3,520
Open source clustering software
de Hoon, M., Imoto, S., Nolan, J., & Miyano, S. (2004) · Bioinformatics · doi:10.1093/bioinformatics/bth078 · Cited by 3,047
Bielack, S. S., Kempf-Bielack, B., Delling, G., Exner, G. U., Flege, S., Helmke, K., Kotz, R., Salzer-Kuntschik, M., Werner, M., Winkelmann, W., et al. (2002) · Journal of Clinical Oncology · doi:10.1200/jco.2002.20.3.776 · Cited by 2,393 · cited 3×
“(2) Calculate total number of aberrations (relative to diploid) for each sample (Ns) Ns 1⁄4 P44 i1⁄41 P2 j1⁄41 CNVi;j 1 where CNVi,j is absolute copy number in arm i and j”
BackgroundBielack, S., Kempf-Bielack, B., Delling, G., Exner, G. U., Flege, S., Helmke, K., Kotz, R., Salzer-Kuntschik, M., Werner, M., Winkelmann, W., et al. (2002) · Journal of Clinical Oncology · doi:10.1200/jco.20.3.776 · Cited by 2,391
Landscape of somatic mutations in 560 breast cancer whole-genome sequences
Nik-Zainal, S., Davies, H., Staaf, J., Ramakrishna, M., Glodzik, D., Zou, X., Martincorena, I., Alexandrov, L. B., Martin, S., Wedge, D. C., et al. (2016) · Nature · doi:10.1038/nature17676 · Cited by 2,218
Self-citationMirabello, L., Troisi, R. J., & Savage, S. A. (2009) · Cancer · doi:10.1002/cncr.24121 · Cited by 2,199
Absolute quantification of somatic DNA alterations in human cancer
Carter, S. L., Cibulskis, K., Helman, E., McKenna, A., Shen, H., Zack, T. I., Laird, P. W., Onofrio, R. C., Winckler, W., Weir, B. A., et al. (2012) · Nature Biotechnology · doi:10.1038/nbt.2203 · Cited by 2,031
Ye, K., Schulz, M. H., Long, Q., Apweiler, R., & Ning, Z. (2009) · Bioinformatics · doi:10.1093/bioinformatics/btp394 · Cited by 2,029
Tawbi, H. A., Burgess, M., Bolejack, V., Van Tine, B. A., Schuetze, S. M., Hu, J., D'Angelo, S., Attia, S., Riedel, R. F., Priebat, D. A., et al. (2017) · The Lancet Oncology · doi:10.1016/s1470-2045(17)30624-1 · Cited by 1,452 · cited 1×
“Characteristic n (%) Median age at diagnosis in years (range) 27 (5-81) Gender Male 29 (60) Female 19 (40) Race White 30 (63) Hispanic 10 (21) Black 5 (10) Asian 3 (6) Disease stage at presentation Localized 37 (77) Metastatic 11 (23) Histologic subtype Osteoblastic 14 (29) Fibroblastic 9 (19) Chondroblastic 6 (13) Ex…”
BackgroundSelf-citationDavoli, T., Uno, H., Wooten, E. C., & Elledge, S. J. (2017) · Science · doi:10.1126/science.aaf8399 · Cited by 1,347
MapSplice: Accurate mapping of RNA-seq reads for splice junction discovery
Wang, K., Singh, D., Zeng, Z., Coleman, S. J., Huang, Y., Savich, G. L., He, X., Mieczkowski, P., Grimm, S. A., Perou, C. M., et al. (2010) · Nucleic Acids Research · doi:10.1093/nar/gkq622 · Cited by 1,193
The evolutionary history of 2,658 cancers
Gerstung, M., Jolly, C., Leshchiner, I., Dentro, S. C., Gonzalez, S., Rosebrock, D., Mitchell, T. J., Rubanova, Y., Anur, P., Yu, K., et al. (2020) · Nature · doi:10.1038/s41586-019-1907-7 · Cited by 1,057
Self-citationKager, L., Zoubek, A., Pötschger, U., Kastner, U., Flege, S., Kempf-Bielack, B., Branscheid, D., Kotz, R., Salzer-Kuntschik, M., Winkelmann, W., et al. (2003) · Journal of Clinical Oncology · doi:10.1200/jco.2003.08.132 · Cited by 934
Pan-cancer genome and transcriptome analyses of 1,699 paediatric leukaemias and solid tumours
Ma, X., Liu, Y., Liu, Y., Alexandrov, L. B., Edmonson, M. N., Gawad, C., Zhou, X., Li, Y., Rusch, M. C., Easton, J., et al. (2018) · Nature · doi:10.1038/nature25795 · Cited by 901
Roh, W., Chen, P.-L., Reuben, A., Spencer, C. N., Prieto, P. A., Miller, J. P., Gopalakrishnan, V., Wang, F., Cooper, Z. A., Reddy, S. M., et al. (2017) · Science Translational Medicine · doi:10.1126/scitranslmed.aah3560 · Cited by 859
Self-citationSequenza: allele-specific copy number and mutation profiles from tumor sequencing data
Favero, F., Joshi, T., Marquard, A. M., Birkbak, N. J., Krzystanek, M., Li, Q., Szállási, Z., & Eklund, A. C. (2014) · Annals of Oncology · doi:10.1093/annonc/mdu479 · Cited by 819
Lundegaard, C., Lamberth, K., Harndahl, M. N., Buus, S., Lund, O., & Nielsen, M. (2008) · Nucleic Acids Research · doi:10.1093/nar/gkn202 · Cited by 808
D'Angelo, S. P., Mahoney, M. R., Van Tine, B. A., Atkins, J., Milhem, M. M., Jahagirdar, B. N., Antonescu, C. R., Horvath, E., Tap, W. D., Schwartz, G. K., et al. (2018) · The Lancet Oncology · doi:10.1016/s1470-2045(18)30006-8 · Cited by 759
Recurrent Somatic Structural Variations Contribute to Tumorigenesis in Pediatric Osteosarcoma
Chen, X., Bahrami, A., Pappo, A., Easton, J., Dalton, J., Hedlund, E., Ellison, D., Shurtleff, S., Wu, G., Wei, L., et al. (2014) · Cell Reports · doi:10.1016/j.celrep.2014.03.003 · Cited by 752
Self-citationTelomeres in cancer: tumour suppression and genome instability
Maciejowski, J., & de Lange, T. (2017) · Nature Reviews Molecular Cell Biology · doi:10.1038/nrm.2016.171 · Cited by 745
Charoentong, P., Finotello, F., Angelova, M., et al. (2016) · bioRxiv (Cold Spring Harbor Laboratory) · doi:10.1101/056101 · Cited by 547
Alternative lengthening of telomeres renders cancer cells hypersensitive to ATR inhibitors
Flynn, R. L., Cox, K. E., Jeitany, M., Wakimoto, H., Bryll, A. R., Ganem, N. J., Bersani, F., Pineda, J. R., Suvà, M. L., Benes, C. H., et al. (2015) · Science · doi:10.1126/science.1257216 · Cited by 515
Perry, J. A., Kiezun, A., Tonzi, P., Van Allen, E. M., Carter, S. L., Baca, S. C., Cowley, G. S., Bhatt, A. S., Rheinbay, E., Pedamallu, C. S., et al. (2014) · Proceedings of the National Academy of Sciences · doi:10.1073/pnas.1419260111 · Cited by 481
Dewhurst, S. M., McGranahan, N., Burrell, R. A., Rowan, A., Gronroos, E. C., Endesfelder, D., Joshi, T., Mouradov, D., Gibbs, P., Ward, R. L., et al. (2014) · Cancer Discovery · doi:10.1158/2159-8290.cd-13-0285 · Cited by 455
Aneuploidy Drives Genomic Instability in Yeast
Sheltzer, J. M., Blank, H. M., Pfau, S. J., Tange, Y., George, B. M., Humpton, T. J., Brito, I., Hiraoka, Y., Niwa, O., & Amon, A. (2011) · Science · doi:10.1126/science.1206412 · Cited by 401
Osteogenic sarcoma with clinically detectable metastasis at initial presentation.
Meyers, P. A., Heller, G., Healey, J. H., Huvos, A. G., Applewhite, A., Sun, M., & LaQuaglia, M. P. (1993) · Journal of Clinical Oncology · doi:10.1200/jco.1993.11.3.449 · Cited by 389
Immune cells as mediators of solid tumor metastasis
DeNardo, D. G., Johansson, M., & Coussens, L. M. (2007) · Cancer and Metastasis Reviews · doi:10.1007/s10555-007-9100-0 · Cited by 375
Grignani, G., Palmerini, E., Ferraresi, V., D’Ambrosio, L., Bertulli, R., Asaftei, S. D., Tamburini, A., Pignochino, Y., Sangiolo, D., Marchesi, E., et al. (2014) · The Lancet Oncology · doi:10.1016/s1470-2045(14)71136-2 · Cited by 343
Fan, Y., Liu, X., Hughes, D., Zhang, J. J., Zhang, J., Futreal, P. A., Wheeler, D. A., & Wang, W. (2016) · Genome biology · doi:10.1186/s13059-016-1029-6 · Cited by 284
Self-citationBehjati, S., Tarpey, P. S., Haase, K., Ye, H., Young, M. D., Alexandrov, L. B., Farndon, S. J., Collord, G., Wedge, D. C., Martincorena, I., et al. (2017) · Nature Communications · doi:10.1038/ncomms15936 · Cited by 261
Self-citationEstimating telomere length from whole genome sequence data
Ding, Z., Mangino, M., Aviv, A., Spector, T. D., & Durbin, R. M. (2014) · Nucleic Acids Research · doi:10.1093/nar/gku181 · Cited by 224
Fungtammasan, A., Walsh, E. M., Chiaromonte, F., Eckert, K. A., & Makova, K. D. (2012) · Genome Research · doi:10.1101/gr.134395.111 · Cited by 151
Nabetani, A., & Ishikawa, F. (2010) · The Journal of Biochemistry · doi:10.1093/jb/mvq119 · Cited by 118
Application of equality constraints on variables during alternating least squares procedures
Benthem, M. H. V., Keenan, M. R., & Haaland, D. M. (2002) · Journal of Chemometrics · doi:10.1002/cem.761 · Cited by 99
Association of MutantTP53with Alternative Lengthening of Telomeres and Favorable Prognosis in Glioma
Chen, Y.-J., Hakin-Smith, V., Teo, M., Xinarianos, G., Jellinek, D. A., Carroll, T., McDowell, D., MacFarlane, M. R., Boet, R., Baguley, B. C., et al. (2006) · Cancer Research · doi:10.1158/0008-5472.can-06-0910 · Cited by 80
Detection and benchmarking of somatic mutations in cancer genomes using RNA-seq data
Coudray, A., Battenhouse, A. M., Bücher, P., & Iyer, V. R. (2018) · PeerJ · doi:10.7717/peerj.5362 · Cited by 67
The genetic basis for inactivation of Wnt pathway in human osteosarcoma
Du, X., Yang, J., Yang, D., Tian, W., & Zhu, Z. (2014) · BMC Cancer · doi:10.1186/1471-2407-14-450 · Cited by 62
PHLAT: Inference of High-Resolution HLA Types from RNA and Whole Exome Sequencing
Bai, Y., Wang, D., & Fury, W. (2018) · Methods in molecular biology · doi:10.1007/978-1-4939-8546-3_13 · Cited by 61
Martín‐Broto, J., Redondo, A., Valverde, C. M., Vaz, M. A., Mora, J., del Muro, X. G., Gutierrez, A. M., Tous, C., Carnero, A., Marcilla, D., et al. (2017) · Annals of Oncology · doi:10.1093/annonc/mdx536 · Cited by 59
Chu, N. D., Bi, H. S., Emerson, R., Sherwood, A., Birnbaum, M. E., Robins, H. S., & Alm, E. J. (2019) · BMC Immunology · doi:10.1186/s12865-019-0300-5 · Cited by 57
Different Facets of Copy Number Changes: Permanent, Transient, and Adaptive
Mishra, S., & Whetstine, J. R. (2016) · Molecular and Cellular Biology · doi:10.1128/mcb.00652-15 · Cited by 53
Harden, J. L., Hamm, D. E., Gulati, N., Lowes, M. A., & Krueger, J. G. (2015) · F1000Research · doi:10.12688/f1000research.6756.1 · Cited by 48
CTLPScanner: a web server for chromothripsis-like pattern detection
Yang, J., Liu, J., Ouyang, L., Chen, Y., Liu, B., & Cai, H. (2016) · Nucleic Acids Research · doi:10.1093/nar/gkw434 · Cited by 47
O’Brien, T. D., Jia, P., Xia, J., Saxena, U., Jin, H., Vuong, H., Kim, P., Wang, Q., Aryee, M. J., Mino-Kenudson, M. A., et al. (2015) · Methods · doi:10.1016/j.ymeth.2015.04.016 · Cited by 43
Burgess, M. A., Bolejack, V., Tine, B. A. V., Schuetze, S. M., Hu, J. S., D’Angelo, S. P., Attia, S., Priebat, D. A., Okuno, S. H., Riedel, R. F., et al. (2017) · Journal of Clinical Oncology · doi:10.1200/jco.2017.35.15_suppl.11008 · Cited by 40
Self-citationClusteredMutations: Location and Visualization of Clustered Somatic Mutations
Lora, D. (2016) · doi:10.32614/cran.package.clusteredmutations · Cited by 9
Abstract 3000: Pervasive intra-tumour heterogeneity and subclonal selection across cancer types
Dentro, S. C., Leshchiner, I., Haase, K., Wintersinger, J. A., Deshwar, A. G., Tarabichi, M., Rubanova, Y., Yu, K., García, I., Macintyre, G., et al. (2018) · Cancer Research · doi:10.1158/1538-7445.am2018-3000 · Cited by 9
Self-citation
Research works printed but not linked: 1
- Dentro, S. C. et al. Portraits of genetic intra-tumour heterogeneity and subclonal selection across cancer types. Preprint at: https://www.biorxiv.org/content/10.1101/312041v4 (2018). · DOI
Cited by
Sorted by citations
Advancing therapy for osteosarcoma
Gill, J., & Gorlick, R. (2021) · Nature Reviews Clinical Oncology · doi:10.1038/s41571-021-00519-8 · Cited by 876
Self-citationZhou, Y., Yang, D., Yang, Q., Lv, X., Huang, W., Zhou, Z., Wang, Y., Zhang, Z., Yuan, T., Ding, X., et al. (2020) · Nature Communications · doi:10.1038/s41467-020-20059-6 · Cited by 672
Beird, H. C., Bielack, S. S., Flanagan, A. M., Gill, J., Heymann, D., Janeway, K. A., Livingston, J. A., Roberts, R. D., Strauss, S. J., & Gorlick, R. (2022) · Nature Reviews Disease Primers · doi:10.1038/s41572-022-00409-y · Cited by 660
Self-citationLilienthal, I., & Herold, N. (2020) · International Journal of Molecular Sciences · doi:10.3390/ijms21186885 · Cited by 300
Advances on immunotherapy for osteosarcoma
Yu, S., & Yao, X. (2024) · Molecular Cancer · doi:10.1186/s12943-024-02105-9 · Cited by 270
“Besides, there are likely multiple immune-suppressive mechanisms in play in osteosarcoma [75].”
Background
Metadata
- Authors
- Wu, C.-C., Beird, H. C., Andrew Livingston, J., Advani, S., Mitra, A., Cao, S., Reuben, A., Ingram, D., Wang, W.-L., Ju, Z., Hong Leung, C., Lin, H., Zheng, Y., Roszik, J., Wang, W., Patel, S., Benjamin, R. S., Somaiah, N., Conley, A. P., Mills, G. B., Hwu, P., Gorlick, R., Lazar, A., Daw, N. C., Lewis, V., & Futreal, P. A.
- Affiliations
- The University of Texas MD Anderson Cancer Center (US)
- Corresponding author
- Futreal, P. Andrew
- ORCID
- Wu, Chia-Chin
- Beird, Hannah C.
- Andrew Livingston, J.
- Advani, Shailesh
- Mitra, Akash
- Cao, Shaolong
- Reuben, Alexandre
- Ingram, Davis
- Wang, Wei-Lien
- Ju, Zhenlin
- Lin, Heather
- Zheng, Youyun
- Roszik, Jason
- Wang, Wenyi
- Patel, Shreyaskumar
- Benjamin, Robert S.
- Somaiah, Neeta
- Conley, Anthony P.
- Mills, Gordon B.
- Hwu, Patrick
- Gorlick, Richard
- Lazar, Alexander
- Daw, Najat C.
- Lewis, Valerae
- Futreal, P. Andrew
- Venue
- Nature Communications
- Published
- 2020-02-21
- Volume
- 11
- Issue
- 1
- Pages
- 1008-1008
- ISSN
- 2041-1723 (ISSN-L)
- PMC
- PMC7035358
- OpenAlex
- W3006860236
- Cited by
- 251
- References
- 60
- Citations by year
- 2026: 27 · 2025: 39 · 2024: 44 · 2023: 30 · 2022: 44 · 2021: 48 · 2020: 19
- FWCI
- 19.87
- Type
- journal article
- Language
- en
- Open access
- gold
- doi.org
- Locations
- Nature Communications (publishedVersion, cc-by)
- Europe PMC (PubMed Central) (publishedVersion, cc-by)
- PubMed Central (publishedVersion, cc-by)
- PubMed (publishedVersion)
- RePEc: Research Papers in Economics (submittedVersion)
- DOAJ (DOAJ: Directory of Open Access Journals) (submittedVersion, cc-by-sa)
- Funders
- A Shelter for Cancer Families
- Cancer Prevention and Research Institute of Texas (R120501)
- QuadW Foundation
- Topics
- Health Sciences › Medicine › Oncology › Sarcoma Diagnosis and Treatment
- Health Sciences › Medicine › Oncology › Cancer Immunotherapy and Biomarkers
- Health Sciences › Medicine › Orthopedics and Sports Medicine › Bone Tumor Diagnosis and Treatments
- Keywords
- osteosarcoma, tumor immune microenvironment, immune checkpoint inhibitors, T-cell receptor clonality, neoantigens, nonsense-mediated mRNA decay, immune cell infiltration, PARP2, immunosuppression, pediatric osteosarcoma, immunotherapy
- MeSH terms
- Whole Genome Sequencing, RNA-Seq, Adolescent, Adult, Aged, Aged, 80 and over, Bone Neoplasms, Child, Child, Preschool, Female, Humans, Male, Middle Aged, Mutation, Receptors, Antigen, T-Cell, Osteosarcoma, Cohort Studies, Immunogenetic Phenomena, Young Adult
About these checks
Registry, retraction, Cites and statistics results are computed, not judged, with one exception: a printed reference that no index lists is read once by a model before it counts as a citation error. Claims are extracted by a model and kept only when their quote appears verbatim in the text; each cited source is then checked, with a model’s help, for whether it says what the claim relies on. Those verdicts can be wrong — read the claim’s quote and the cited source before relying on one.
Statistics and arithmetic are recomputed, not judged.
Confidence bands are shown only for fields calibrated on our annotated test set. None is calibrated yet, so no band is shown.
What counts as a claim ›How we measure confidence ›How we check this ›
Are you an author, or do you see a problem with this page? Request a review
