

The DOI matches its Crossref record; 86 of the 86 references it cites were found in a registry or an index.
Genes Affecting Vocal and Facial Anatomy Went Through Extensive Regulatory Divergence in Modern Humans
Open accessAbstract
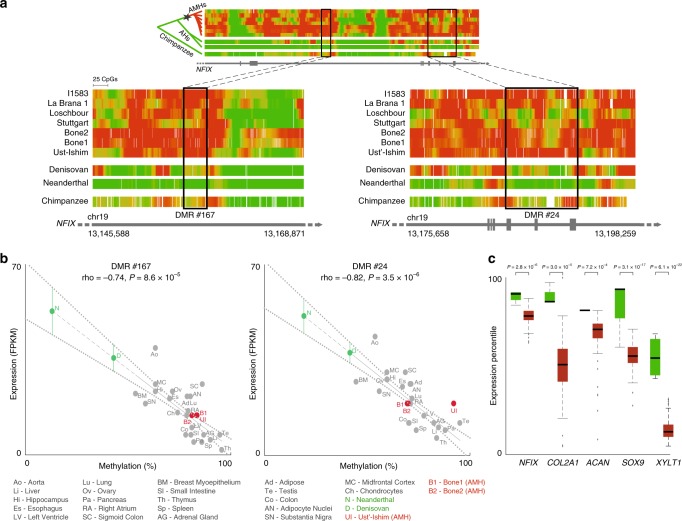
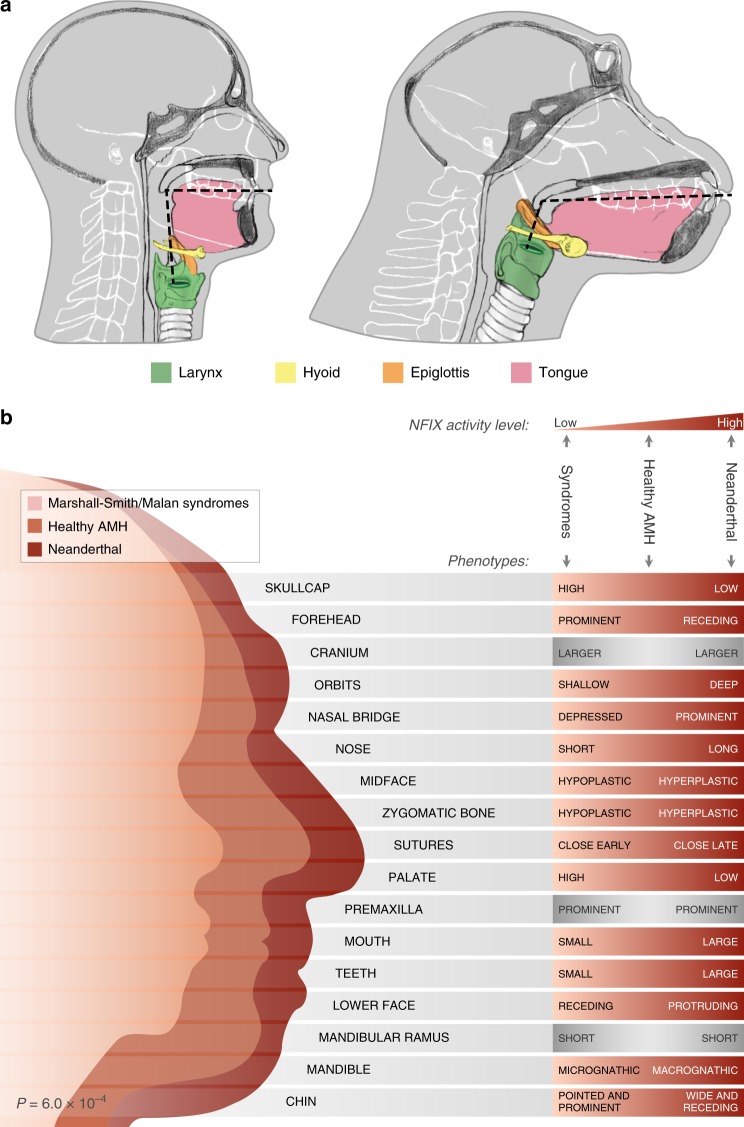
Summary: Regulatory changes are broadly accepted as key drivers of phenotypic divergence. However, identifying regulatory changes that underlie human-specific traits has proven very challenging. Here, we use 63 DNA methylation maps of ancient and present-day humans, as well as of six chimpanzees, to detect differentially methylated regions that emerged in modern humans after the split from Neanderthals and Denisovans. We show that genes affecting the face and vocal tract went through particularly extensive methylation changes. Specifically, we identify widespread hypermethylation in a network of face- and voice-affecting genes ( SOX9 , ACAN , COL2A1 , NFIX and XYLT1 ). We propose that these repression patterns appeared after the split from Neanderthals and Denisovans, and that they might have played a key role in shaping the modern human face and vocal tract.
Overview
The claims and statistics of this paper haven’t been checked yet.
Run the check — free, no account needed. It reads the open-access text and checks the sources it cites.
Integrity signals
Registry
Cites
Statistics
Figures
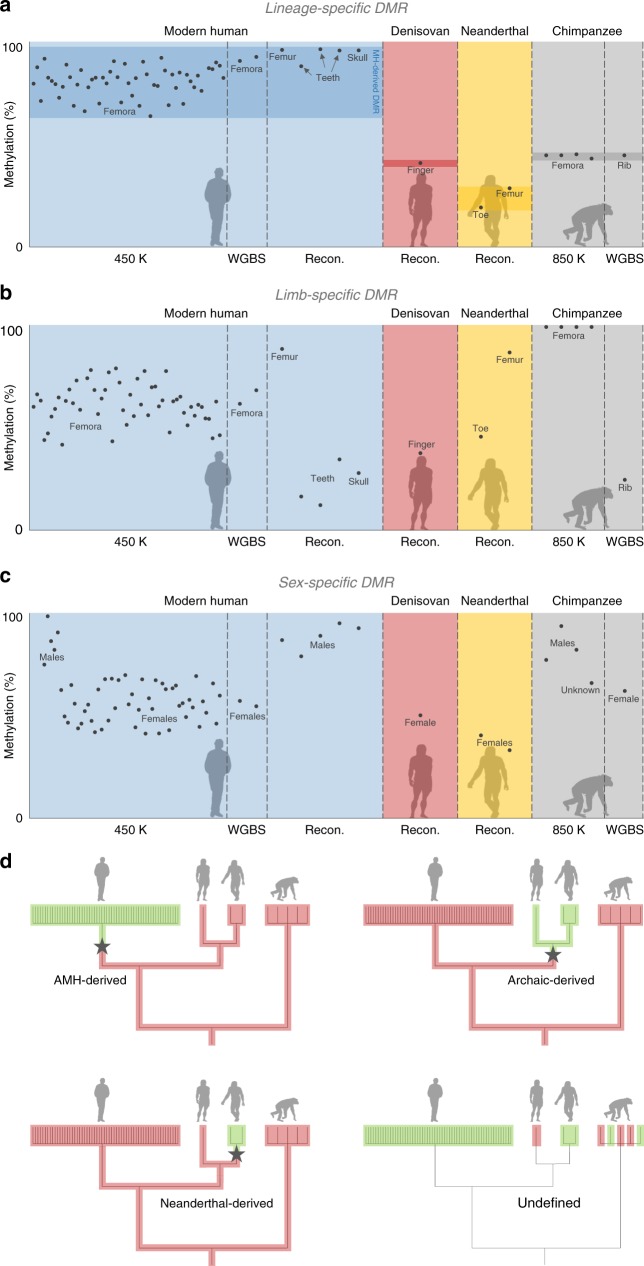
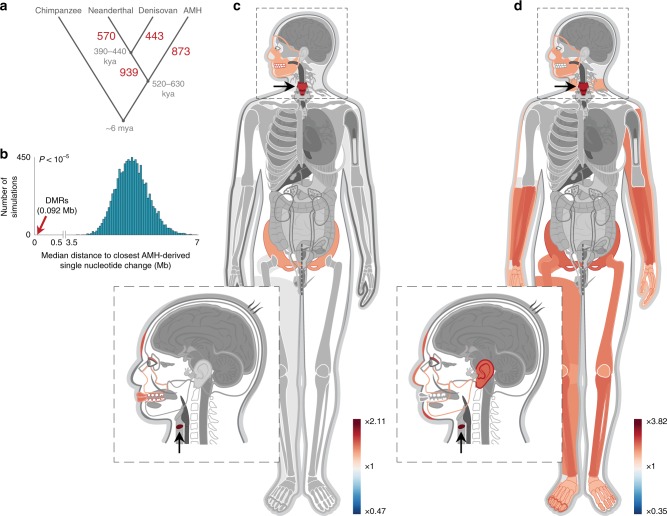
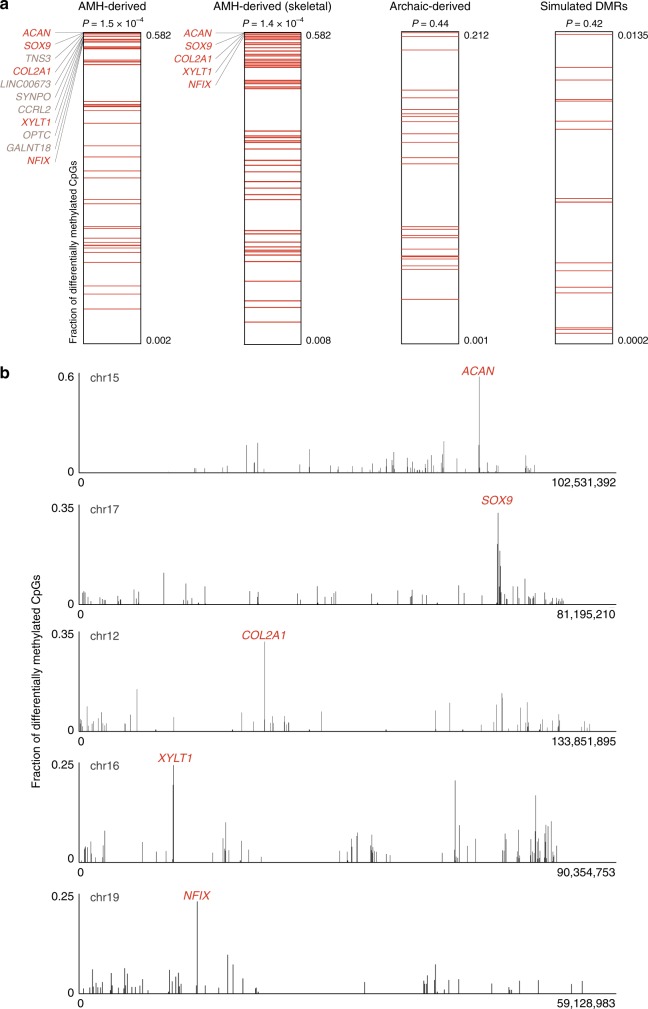
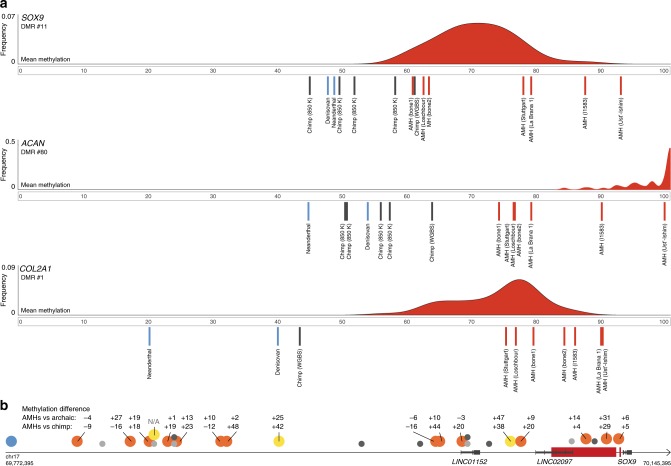
Verification
Claims the paper makes
The claims and statistics of this paper haven’t been checked yet.
Run the check — free, no account needed. It reads the open-access text and checks the sources it cites.
Claims other papers make about this one
Each is checked against this paper’s own text: does it say what the citing paper says it does?
The cited source says what the claim attributes to it.
In the citing paper
“are among the top differentially methylated genes compared to archaics and were also highlighted in a recent study on regulatory changes that shaped the modern human facial and vocal anatomy (tables S1 and S3) (43)”
From Dosage analysis of the 7q11.23 Williams region identifies BAZ1B as a major human gene patterning the modern human face and underlying self-domestication (2019) · cites this paper as [43]
The check wasn’t confident either way, so it gives no verdict — never disputed.
In the citing paper
“This is also reinforced by the recent identification of AMH-specific hypermethylation in the regulatory region of BAZ1B itself (43).”
From Dosage analysis of the 7q11.23 Williams region identifies BAZ1B as a major human gene patterning the modern human face and underlying self-domestication (2019) · cites this paper as [43]
Experimental — accuracy not yet measured
Self-check
Percentages, sums and reported differences re-computed from the paper’s own numbers.
The self-check needs the paper’s full text.
Citations
Cites
Systematic and integrative analysis of large gene lists using DAVID bioinformatics resources
Huang, D. W., Sherman, B. T., & Lempicki, R. A. (2009) · Nature Protocols · doi:10.1038/nprot.2008.211 · Cited by 35,890
An integrated encyclopedia of DNA elements in the human genome
The ENCODE Project Consortium (2012) · Nature · doi:10.1038/nature11247 · Cited by 18,072
Integrative analysis of 111 reference human epigenomes
Roadmap Epigenomics Consortium, Kundaje, A., Meuleman, W., Ernst, J., Bilenky, M., Yen, A., Heravi-Moussavi, A., Kheradpour, P., Zhang, Z., Wang, J., et al. (2015) · Nature · doi:10.1038/nature14248 · Cited by 6,368
Self-citationKing, M.-C., & Wilson, A. C. (1975) · Science · doi:10.1126/science.1090005 · Cited by 2,815
The complete genome sequence of a Neanderthal from the Altai Mountains
Prüfer, K., Racimo, F., Patterson, N., Jay, F., Sankararaman, S., Sawyer, S., Heinze, A., Renaud, G., Sudmant, P. H., de Filippo, C., et al. (2014) · Nature · doi:10.1038/nature12886 · Cited by 2,254
Self-citationThe new NHGRI-EBI Catalog of published genome-wide association studies (GWAS Catalog)
MacArthur, J., Bowler, E., Cerezo, M., Gil, L., Hall, P., Hastings, E., Junkins, H., McMahon, A., Milano, A., Morales, J., et al. (2017) · Nucleic Acids Research · doi:10.1093/nar/gkw1133 · Cited by 2,161
Massive migration from the steppe was a source for Indo-European languages in Europe
Haak, W., Lazaridis, I., Patterson, N., Rohland, N., Mallick, S., Llamas, B., Brandt, G., Nordenfelt, S., Harney, E., Stewardson, K., et al. (2015) · Nature · doi:10.1038/nature14317 · Cited by 1,940
Self-citationConserved role of intragenic DNA methylation in regulating alternative promoters
Maunakea, A. K., Nagarajan, R. P., Bilenky, M., Ballinger, T. J., D’Souza, C., Fouse, S. D., Johnson, B. E., Hong, C., Nielsen, C., Zhao, Y., et al. (2010) · Nature · doi:10.1038/nature09165 · Cited by 1,743
Genome-wide patterns of selection in 230 ancient Eurasians
Mathieson, I., Lazaridis, I., Rohland, N., Mallick, S., Patterson, N., Roodenberg, S. A., Harney, E., Stewardson, K., Fernandes, D., Novak, M., et al. (2015) · Nature · doi:10.1038/nature16152 · Cited by 1,515
Self-citationDabney, J., Knapp, M., Glocke, I., Gansauge, M.-T., Weihmann, A., Nickel, B., Valdiosera, C., García, N., Pääbo, S., Arsuaga, J.-L., et al. (2013) · Proceedings of the National Academy of Sciences · doi:10.1073/pnas.1314445110 · Cited by 1,443
Research works printed but not linked: 1
- Aiello, L. & Dean, C . An Introduction to Human Evolutionary Anatomy. (Elsevier, 2002).
Cited by
A catalog of single nucleotide changes distinguishing modern humans from archaic hominins
Kuhlwilm, M., & Boeckx, C. (2019) · Scientific Reports · doi:10.1038/s41598-019-44877-x · Cited by 108
Zanella, M., Vitriolo, A., Andirko, A., Martins, P. T., Sturm, S., O’Rourke, T., Laugsch, M., Malerba, N., Skaros, A., Trattaro, S., et al. (2019) · Science Advances · doi:10.1126/sciadv.aaw7908 · Cited by 101
The cis-regulatory effects of modern human-specific variants
Weiss, C. V., Harshman, L., Inoue, F., Fraser, H. B., Petrov, D. A., Ahituv, N., & Gokhman, D. (2021) · eLife · doi:10.7554/elife.63713 · Cited by 70
Self-citation
Metadata
- Authors
- Gokhman, D., Nissim-Rafinia, M., Agranat-Tamir, L., Housman, G., García-Pérez, R., Lizano, E., Cheronet, O., Mallick, S., Nieves-Colón, M. A., Li, H., Alpaslan-Roodenberg, S., Novak, M., Gu, H., Osinski, J. M., Ferrando-Bernal, M., Gelabert, P., Lipende, I., Mjungu, D., Kondova, I., Bontrop, R., Kullmer, O., Weber, G., Shahar, T., Dvir-Ginzberg, M., Faerman, M., Quillen, E. E., Meissner, A., Lahav, Y., Kandel, L., Liebergall, M., Prada, M. E., Vidal, J. M., Gronostajski, R. M., Stone, A. C., Yakir, B., Lalueza-Fox, C., Pinhasi, R., Reich, D., Marques-Bonet, T., Meshorer, E., & Carmel, L.
- Affiliations
- Hebrew University of Jerusalem (IL)
- Arizona State University (US)
- Consejo Superior de Investigaciones Científicas (ES)
- University of Vienna (AT)
- Broad Institute (US)
- Harvard University (US)
- University College Dublin (IE)
- University at Buffalo, State University of New York (US)
- The Jane Goodall Institute (TZ)
- Biomedical Primate Research Centre (NL)
- Senckenberg Research Institute and Natural History Museum Frankfurt/M (DE)
- Shaare Zedek Medical Center (IL)
- Texas Biomedical Research Institute (US)
- Hadassah Medical Center (IL)
- Junta de Castilla y León (ES)
- Corresponding author
- Gokhman, David
- Meshorer, Eran
- Carmel, Liran
- ORCID
- Gokhman, David
- Agranat-Tamir, Lily
- Housman, Genevieve
- García-Pérez, Raquel
- Lizano, Esther
- Cheronet, Olivia
- Mallick, Swapan
- Li, Heng
- Alpaslan-Roodenberg, Songül
- Novak, Mario
- Gu, Hongcang
- Osinski, Jason M.
- Ferrando-Bernal, Manuel
- Gelabert, Pere
- Lipende, Iddi
- Kondova, Ivanela
- Bontrop, Ronald
- Kullmer, Ottmar
- Weber, Gerhard
- Shahar, Tal
- Faerman, Marina
- Quillen, Ellen E.
- Meissner, Alexander
- Lahav, Yonatan
- Kandel, Leonid
- Liebergall, Meir
- Vidal, Julio M.
- Gronostajski, Richard M.
- Stone, Anne C.
- Pinhasi, Ron
- Reich, David
- Meshorer, Eran
- Carmel, Liran
- Venue
- Nature Communications
- Publisher
- openRxiv
- Published
- 2017-02-08
- Volume
- 11
- Issue
- 1
- Pages
- 1189-1189
- ISSN
- 2041-1723 (ISSN-L)
- PMC
- PMC7055320
- OpenAlex
- W3009791849
- Cited by
- 144
- References
- 86
- Citations by year
- 2026: 37 · 2025: 23 · 2024: 13 · 2023: 14 · 2022: 21 · 2021: 18 · 2020: 10 · 2019: 6 · 2018: 1 · 2017: 1
- FWCI
- 5.11
- Type
- journal article
- Language
- en
- Open access
- gold
- doi.org
- Licence
- Locations
- Nature Communications (publishedVersion, cc-by)
- bioRxiv (Cold Spring Harbor Laboratory) (acceptedVersion, cc-by-nc-nd)
- Europe PMC (PubMed Central) (publishedVersion, cc-by)
- PubMed Central (publishedVersion, cc-by)
- PubMed (publishedVersion)
- Repositori digital de la UPF (Universitat Pompeu Fabra) (publishedVersion, cc-by)
- LA Referencia (Red Federada de Repositorios Institucionales de Publicaciones Científicas) (submittedVersion, cc-by)
- RePEc: Research Papers in Economics (submittedVersion)
- Dipòsit Digital de Documents de la UAB (Universitat Autònoma de Barcelona) (submittedVersion, cc-by)
- DIGITAL.CSIC (Spanish National Research Council (CSIC)) (submittedVersion, cc-by)
- DOAJ (DOAJ: Directory of Open Access Journals) (submittedVersion, cc-by-sa)
- Utrecht University Repository (Utrecht University) (submittedVersion, other-oa)
- MPG.PuRe (Max Planck Society) (submittedVersion, other-oa)
- Funders
- National Science Foundation (MH106874, 1052693)
- Howard Hughes Medical Institute
- Paul G. Allen Family Foundation
- Leakey Foundation
- Nacey Maggioncalda Foundation
- New York State Stem Cell Science (C030133)
- Centres de Recerca de Catalunya
- Clore Israel Foundation
- Generalitat de Catalunya (BFU2017-86471-P)
- Israel Science Foundation (ISF 1430/13)
- Max-Planck-Gesellschaft
- National Institutes of Health (MH106874, P51OD011133)
- School of Human Evolution and Social Change, Arizona State University
- National Institute of Mental Health (U01MH106874)
- National Institute of Allergy and Infectious Diseases (R01AI058715)
- Division of Materials Research
- FP7 Ideas: European Research Council (263441)
- Topics
- Life Sciences › Biochemistry, Genetics and Molecular Biology › Molecular Biology › Epigenetics and DNA Methylation
- Social Sciences › Anthropology › Pleistocene-Era Hominins and Archaeology
- Life Sciences › Biochemistry, Genetics and Molecular Biology › Genetics › Forensic and Genetic Research
- Keywords
- DNA methylation, differentially methylated regions, human evolution, Neanderthals, Denisovans, human-specific traits, vocal tract anatomy, SOX9, aggrecan, COL2A1, NFIX, XYLT1, hypermethylation, epigenetic regulation, chimpanzees
- MeSH terms
- DNA, Ancient, Adult, Aged, Animals, Cells, Cultured, Child, Pan troglodytes, Face, Female, Humans, Larynx, Male, Middle Aged, Phenotype, Phonation, Tongue, Vocal Cords, Vocalization, Animal, Evolution, Molecular, DNA Methylation, Chondrocytes, Genetic Speciation, Gene Regulatory Networks, Neanderthals, Primary Cell Culture
About these checks
Registry, retraction, Cites and statistics results are computed, not judged, with one exception: a printed reference that no index lists is read once by a model before it counts as a citation error. Claims are extracted by a model and kept only when their quote appears verbatim in the text; each cited source is then checked, with a model’s help, for whether it says what the claim relies on. Those verdicts can be wrong — read the claim’s quote and the cited source before relying on one.
Statistics and arithmetic are recomputed, not judged.
Confidence bands are shown only for fields calibrated on our annotated test set. None is calibrated yet, so no band is shown.
What counts as a claim ›How we measure confidence ›How we check this ›
Are you an author, or do you see a problem with this page? Request a review
How to cite
Cite CoChat for the checks on this page, and the paper for its own findings.
- This page
- CoChat. (2026). Citation check: Genes Affecting Vocal and Facial Anatomy Went Through Extensive Regulatory Divergence in Modern Humans. https://app.cochat.ai/papers/10.1101/106955
- The paper
- Gokhman, D., Nissim-Rafinia, M., Agranat-Tamir, L., Housman, G., García-Pérez, R., Lizano, E., Cheronet, O., Mallick, S., Nieves-Colón, M. A., Li, H., Alpaslan-Roodenberg, S., Novak, M., Gu, H., Osinski, J. M., Ferrando-Bernal, M., Gelabert, P., Lipende, I., Mjungu, D., Kondova, I., . . . Carmel, L. (2017). Genes Affecting Vocal and Facial Anatomy Went Through Extensive Regulatory Divergence in Modern Humans. Nature Communications. https://doi.org/10.1101/106955
