

The DOI matches its Crossref record; 74 of the 78 references it cites were found in a registry or an index; 52 of the 73 sources its claims cite were checked for support.
Microglia clear neuron-released α-synuclein via selective autophagy and prevent neurodegeneration
Open accessPublished version of a preprint
Abstract
Microglia maintain brain homeostasis by removing neuron-derived components such as myelin and cell debris. The evidence linking microglia to neurodegenerative diseases is growing; however, the precise mechanisms remain poorly understood. Herein, we report a neuroprotective role for microglia in the clearance of neuron-released α-synuclein. Neuronal α-synuclein activates microglia, which in turn engulf α-synuclein into autophagosomes for degradation via selective autophagy (termed synucleinphagy). Synucleinphagy requires the presence of microglial Toll-like receptor 4 (TLR4), which induces transcriptional upregulation of p62/SQSTM1 through the NF-κB signaling pathway. Induction of p62, an autophagy receptor, is necessary for the formation of α-synuclein/ubiquitin-positive puncta that are degraded by autophagy. Finally, disruption of microglial autophagy in mice expressing human α-synuclein promotes the accumulation of misfolded α-synuclein and causes midbrain dopaminergic neuron degeneration. Our study thus identifies a neuroprotective function of microglia in the clearance of α-synuclein via TLR4-NF-κB-p62 mediated synucleinphagy.
Overview
AI snapshot
Written from the paper’s full text.
TL;DR
Microglia engulf neuron-released α-synuclein and degrade it through selective autophagy, termed synucleinphagy, via TLR4–NF-κB–p62/SQSTM1 signaling. Disrupting microglial autophagy in mice expressing human α-synuclein increases misfolded α-synuclein and causes midbrain dopaminergic neuron degeneration.
Key findings
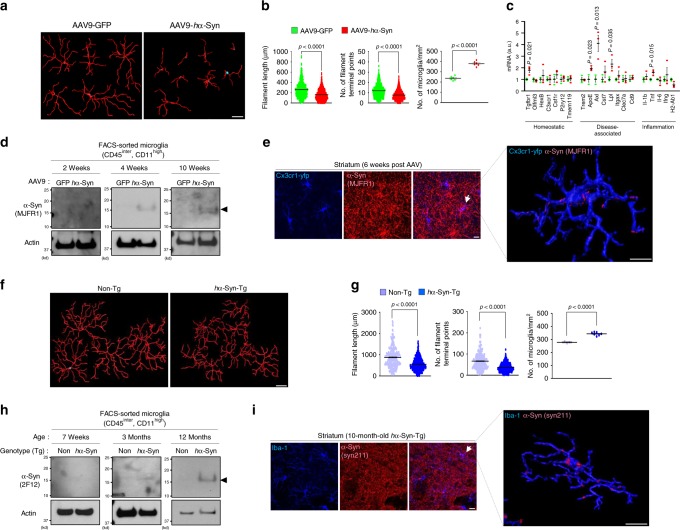
- Neuron-released human α-synuclein (hα-Syn) is engulfed by microglia in vivo in AAV9-hα-Syn-injected mice and hα-Syn-Tg mice, accompanied by microglial activation and detection of hα-Syn in isolated microglia.
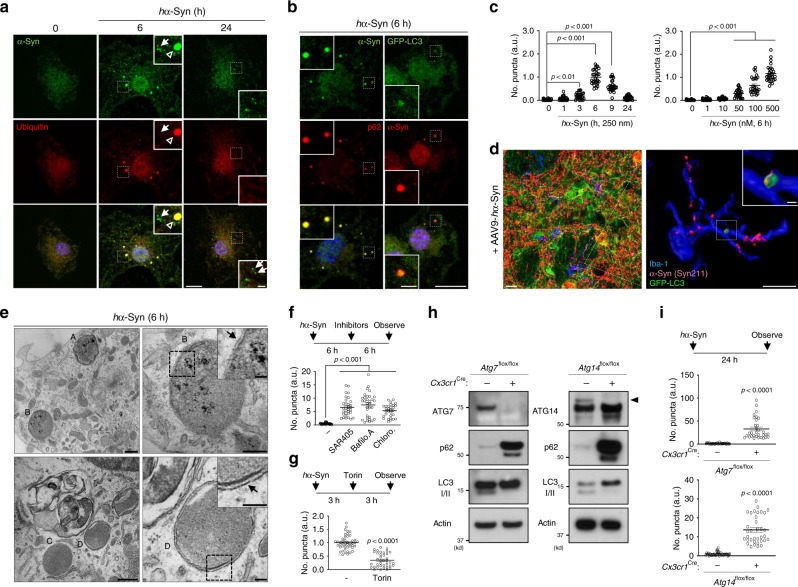
- Ingested hα-Syn forms ubiquitin-, p62-, and GFP–LC3-positive puncta that peak at 6 h and decline by 24 h; clearance is blocked by SAR405, Bafilomycin A1, or Chloroquine, enhanced by Torin1, and abolished in Atg7- or Atg14-deficient microglia and p62-KO microglia.
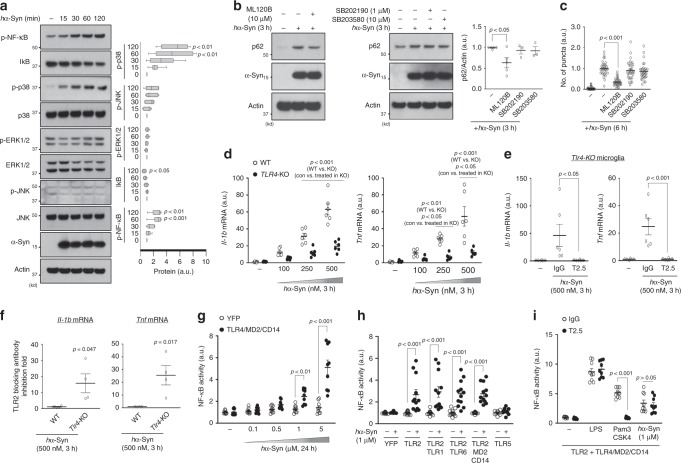
- hα-Syn-induced p62 upregulation requires TLR4 and NF-κB: Tlr4-KO, TAK-242, or ML-120B suppresses p62 induction and hα-Syn/ubiquitin puncta; hα-Syn prefers TLR4 over TLR2 for NF-κB activation in HEK293T reporter assays and does not induce TLR4 endocytosis or IRF3 signaling like LPS.
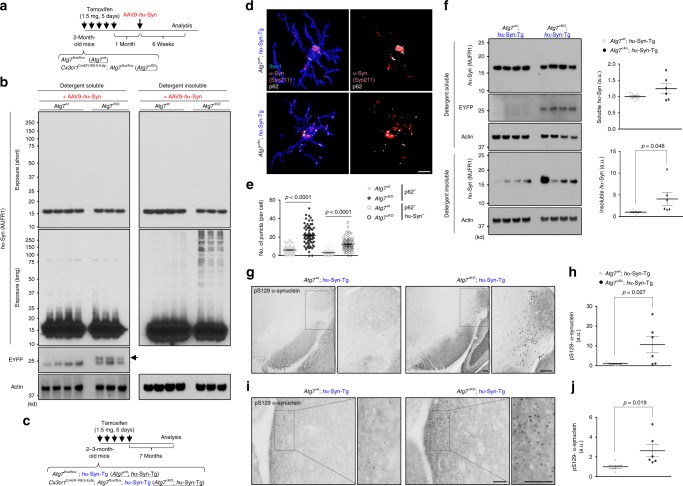
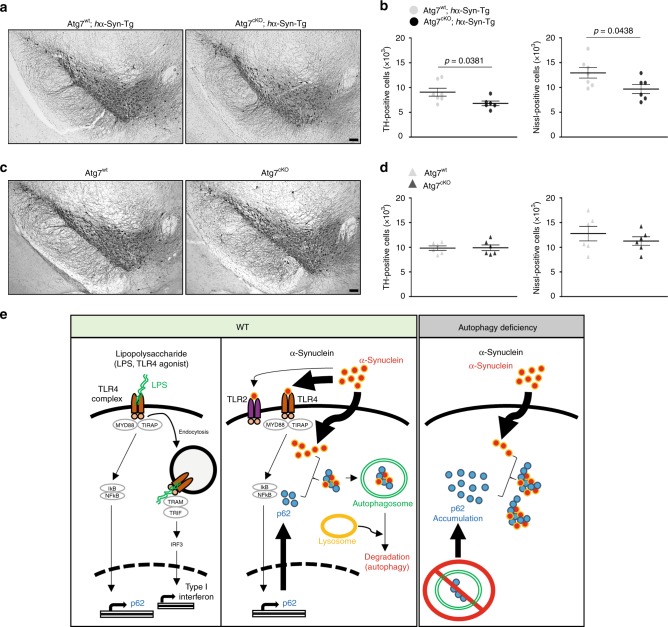
- Microglia-specific Atg7 deficiency in hα-Syn mice increases detergent-insoluble hα-Syn, p-S129 α-synuclein-positive structures, and decreases TH-positive and Nissl-positive cells in the SNpc at 7 months after tamoxifen; hα-Syn-Tg mice alone showed no dopaminergic degeneration up to 12 months.
Methods
- Mouse models included AAV9-GFP or AAV9-hα-Syn injection into SNpc, Thy-1 hα-Syn transgenic mice, Cx3cr1CreER-IRES-Eyfp, Atg7flox/flox, Atg14flox/flox, p62-KO, Tlr4-KO, and GFP–LC3 mice; primary microglia, adult microglia isolation, and HEK293T NF-κB-luciferase TLR assays were used.
- Main analyses included RT-qPCR, western blot, immunostaining with confocal 3D reconstruction, electron microscopy, co-immunoprecipitation, brain fractionation into detergent-soluble/insoluble fractions, flow cytometry, and stereological counting of TH/Nissl-positive SNpc neurons.
- Statistics used unpaired two-tailed Student’s t test or Mann–Whitney U test, one-way ANOVA with Newman–Keuls post hoc, or two-way ANOVA with Bonferroni post hoc; values are mean ± SEM.
Limitations
- The paper states that the exact mechanism by which α-synuclein enters microglia remains unresolved, the specific E3 ligase for α-synuclein in microglia is unidentified, and the significance of other TLRs requires future study.
- Evident from the text: mechanistic dissection relies heavily on cultured primary microglia and recombinant hα-Syn, while in vivo evidence uses overexpression models (AAV or Thy-1 transgenic hα-Syn) rather than endogenous α-synuclein; no human tissue or clinical data are presented.
Model-written summary. Check it against the paper before relying on it.
Integrity signals
Registry
Cites
Statistics
Figures
Verification
Claims the paper makes
77 Own result · 32 Own interpretation · 14 Partly supported · 10 No full text of the sources · 7 Supported · 7 Own method · 4 Mixed support · 3 Couldn’t confirm · 2 Supported so far · accuracy not yet measured
Some cited sources support this claim and some don’t — read each source’s verdict below.
In the paper
“TLR4 was required for NF-κB activation, and increased inflammation and phagocytic activity in response to various forms of α-synuclein40,41,56.”
§ Microglia clear neuron-released α-synuclein via selective autophagy and prevent neurodegeneration > Discussion
What the sources say
- Supportedcites [40] Fellner, L. et al. Toll-like receptor 4 is required for alpha-synuclein dependent activation of microglia and astroglia. Glia 61, 349–360 (2013). source
The Abstract and Discussion report that TLR4 mediates α-synuclein-induced pro-inflammatory cytokine release in primary murine microglia and that TLR4 deficiency suppresses the pro-inflammatory response in astroglia. The Discussion identifies the three forms tested as full-length soluble, fibrillar, and C-terminally truncated α-synuclein. (LLM, conf=0.90)
- Partly supportedcites [41] Rannikko, E. H., Weber, S. S. & Kahle, P. J. Exogenous alpha-synuclein induces toll-like receptor 4 dependent inflammatory responses in astrocytes. BMC Neurosci. 16, 57 (2015). sourceExperimental — accuracy not yet measured
The Results section reports that α-synuclein induced inflammatory-gene expression in control astrocytes but not significantly in TLR4-knockout astrocytes. However, the Discussion says the study did not determine which α-synuclein species were involved, so it does not establish the claim for various forms. (LLM, conf=0.88)
- Disputedcites [56] Stefanova, N. et al. Toll-like receptor 4 promotes alpha-synuclein clearance and survival of nigral dopaminergic neurons. Am. J. Pathol. 179, 954–963 (2011). sourceExperimental — accuracy not yet measured
The Results section reports the opposite for an inflammatory measure: α-synuclein-overexpressing mice lacking TLR4 had increased midbrain TNF-α and a proinflammatory astroglial response. The Discussion supports a role for TLR4 in α-synuclein phagocytosis, but not the attributed requirement for increased inflammation. (LLM, conf=0.86)
Checked by a reasoning model — may be wrong.
plaindirect- Asserted: passes — The authors put it forward as true.
- Checkable: passes — It can be checked against evidence.
- Load-bearing: passes — The paper’s conclusions depend on it.
- Based: passes — The paper gives a reason why it holds.
- Supported
Some cited sources support this claim and some don’t — read each source’s verdict below.
In the paper
“TLR4 was required for NF-κB activation, and increased inflammation and phagocytic activity in response to various forms of α-synuclein40,41,56.”
§ Microglia clear neuron-released α-synuclein via selective autophagy and prevent neurodegeneration > Discussion
What the sources say
- Supportedcites [40] Fellner, L. et al. Toll-like receptor 4 is required for alpha-synuclein dependent activation of microglia and astroglia. Glia 61, 349–360 (2013). source
The Results section, “TLR4 Is Required for AS-Induced Phagocytic Response in Primary Microglia” (page not provided), reports increased phagocytic activity after treatment with soluble, fibrillized, and C-terminally truncated α-synuclein. Activity was significantly reduced in TLR4-deficient microglia. The finding concerns microglial phagocytosis measured by uptake of fluorescent microspheres. (LLM, conf=0.94)
- Disputedcites [41] Rannikko, E. H., Weber, S. S. & Kahle, P. J. Exogenous alpha-synuclein induces toll-like receptor 4 dependent inflammatory responses in astrocytes. BMC Neurosci. 16, 57 (2015). sourceExperimental — accuracy not yet measured
The Results section, “Primary astrocytes internalize αSYN from the medium in a TLR4-independent manner” (page unavailable), reports no considerable difference in α-synuclein internalization between TLR4-positive and TLR4-knockout astrocytes, including across the tested variants. The paper supports TLR4-dependent inflammatory signaling, but says α-synuclein uptake is TLR4-independent rather than requiring TLR4. (LLM, conf=0.86)
Checked by a reasoning model — may be wrong.
- Supportedcites [56] Stefanova, N. et al. Toll-like receptor 4 promotes alpha-synuclein clearance and survival of nigral dopaminergic neurons. Am. J. Pathol. 179, 954–963 (2011). source
The Results report that blocking TLR4 suppressed microglial phagocytosis of α-synuclein debris, while TLR4-deficient primary microglia took up far less recombinant α-synuclein than controls. The Materials and Methods identify debris and recombinant α-synuclein as distinct forms tested, supporting the attributed phagocytosis claim. (LLM, conf=0.91)
plaindirect- Asserted: passes — The authors put it forward as true.
- Checkable: passes — It can be checked against evidence.
- Load-bearing: passes — The paper’s conclusions depend on it.
- Based: passes — The paper gives a reason why it holds.
- Supported
The cited sources support only part of this claim — read each source’s verdict below.
In the paper
“By contrast, treatment with Torin1, an inhibitor of mTOR that stimulates autophagy37, facilitated the clearance of puncta (Fig. 2g).”
§ Microglia clear neuron-released α-synuclein via selective autophagy and prevent neurodegeneration > Results > Microglia-engulfed α-synuclein is degraded by autophagy
What the sources say
- Partly supportedcites [37] Liu, Q. S. et al. Discovery of 1-(4-(4-Propionylpiperazin-1-yl)-3-(trifluoromethyl)phenyl)-9-(quinolin-3-yl)benzo[h][1,6]naphthyridin-2(1H)-one as a highly potent, selective mammalian target of rapamycin (mTOR) inhibitor for the treatment of cancer. J. Med. Chem. 53, 7146–7155 (2010). sourceExperimental — accuracy not yet measured
The Results and discussion identify Torin1 as an inhibitor of cellular mTOR activity. The Introduction says mTOR regulates autophagy, but our copy does not establish that Torin1 stimulates autophagy. The citing sentence attributes puncta clearance to its own Fig. 2g, not to this source. (LLM, conf=0.86)
plaindirect- Asserted: passes — The authors put it forward as true.
- Checkable: passes — It can be checked against evidence.
- Load-bearing: passes — The paper’s conclusions depend on it.
- Based: passes — The paper gives a reason why it holds.
- Partly supported
The cited sources that could be checked couldn’t confirm or dispute this claim.
In the paper
“However, the evidence for macroautophagy (hereafter referred to as autophagy) degradation of α-synuclein is extremely limited24,25.”
§ Microglia clear neuron-released α-synuclein via selective autophagy and prevent neurodegeneration > Introduction
What the sources say
- Not checked — no full text of the sourcecites [24] Lin, Y. C., Kuo, H. C., Wang, J. S. & Lin, W. W. Regulation of inflammatory response by 3-methyladenine involves the coordinative actions on akt and glycogen synthase kinase 3 beta rather than autophagy. J. Immunol. 189, 4154–4164 (2012). source
- Could not verifycites [25] Wu, Y. T. et al. Dual role of 3-methyladenine in modulation of autophagy via different temporal patterns of inhibition on class I and III phosphoinositide 3-kinase. J. Biol. Chem. 285, 10850–10861 (2010). sourceExperimental — accuracy not yet measured
The ‘Dual Role of 3-Methyladenine in Modulation of Autophagy’ section reports autophagic flux and degradation of long-lived proteins, not α-synuclein. Searches for α-synuclein and synuclein found no passage assessing whether evidence for its macroautophagic degradation is limited. Page numbers were not available in our copy. (LLM, conf=0.76)
plain- Asserted: passes — The authors put it forward as true.
- Checkable: passes — It can be checked against evidence.
- Load-bearing: passes — The paper’s conclusions depend on it.
- Based: passes — The paper gives a reason why it holds.
The cited sources support only part of this claim — read each source’s verdict below.
In the paper
“α-synuclein can be secreted by neurons as a result of cellular stress or injury, or as a response to stimulation11–13.”
§ Microglia clear neuron-released α-synuclein via selective autophagy and prevent neurodegeneration > Introduction
What the sources say
- Partly supportedcites [11] Emmanouilidou, E. et al. Assessment of alpha-synuclein secretion in mouse and human brain parenchyma. PLoS One 6, e22225 (2011). sourceExperimental — accuracy not yet measured
The Introduction and Results and Discussion report physiological release of α-synuclein into brain interstitial fluid, supporting neuronal secretion. The study detected it in patients with severe brain injury, but does not establish injury or cellular stress as the cause of secretion; it also does not show secretion in response to stimulation. Its discussion of probe insertion argues against neuronal membrane damage explaining the measured release. (LLM, conf=0.87)
- Not checked — no full text of the sourcecites [12] Jang, A. et al. Non-classical exocytosis of alpha-synuclein is sensitive to folding states and promoted under stress conditions. J. Neurochem. 113, 1263–1274 (2010). source
- Partly supportedcites [13] Yamada, K. & Iwatsubo, T. Extracellular alpha-synuclein levels are regulated by neuronal activity. Mol. Neurodegener. 13, 9 (2018). sourceExperimental — accuracy not yet measured
The Discussion reports that stressed cells release more α-synuclein, and the Results show that increased neuronal activity increases its release. The paper does not establish injury as a cause of α-synuclein secretion; the Background instead notes that release can occur independently of cell death. Page numbers are unavailable in our copy. (LLM, conf=0.85)
plaindirect- Asserted: passes — The authors put it forward as true.
- Checkable: passes — It can be checked against evidence.
- Load-bearing: passes — The paper’s conclusions depend on it.
- Based: passes — The paper gives a reason why it holds.
- Partly supported
The sources with a verdict support this claim; the rest weren’t checked yet, have no full text we could read, or their verdicts aren’t rated yet.
In the paper
“injection of fibrillar α-synuclein into animal brains causes the spread of LB-like pathology14, supporting the “Braak hypothesis” of staging in synucleinopathies15.”
§ Microglia clear neuron-released α-synuclein via selective autophagy and prevent neurodegeneration > Introduction
What the sources say
- Supportedcites [14] Luk, K. C. et al. Pathological alpha-synuclein transmission initiates Parkinson-like neurodegeneration in nontransgenic mice. Science 338, 949–953 (2012). source
The paper’s Abstract reports that a single intrastriatal injection of synthetic α-synuclein fibrils in wild-type mice produced cell-to-cell transmission and Parkinson’s-like Lewy pathology in interconnected brain regions. It also describes progressive spread to additional regions over time. The claim is supported for the mice and injection conditions studied. (LLM, conf=0.94)
- Not checked — no full text of the sourcecites [15] Braak, H. et al. Staging of brain pathology related to sporadic Parkinson’s disease. Neurobiol. Aging 24, 197–211 (2003). source
plaindirect- Asserted: passes — The authors put it forward as true.
- Checkable: passes — It can be checked against evidence.
- Load-bearing: passes — The paper’s conclusions depend on it.
- Based: passes — The paper gives a reason why it holds.
- Supported
The cited sources support only part of this claim — read each source’s verdict below.
In the paper
“NRF2 or TFEB pathways were unaltered as shown by the lack of change in the level of NQO-1 and HO-1, two major targets of NRF2, or the intensity of nuclear TFEB in response to hα-Syn46,47 (Supplementary Fig. 4i, j).”
§ Microglia clear neuron-released α-synuclein via selective autophagy and prevent neurodegeneration > Results > NF-κB mediates α-synuclein-TLR4 signaling and p62 induction
What the sources say
- Could not verifycites [46] Fujita, K. & Srinivasula, S. M. TLR4-mediated autophagy in macrophages is a p62-dependent type of selective autophagy of aggresome-like induced structures (ALIS). Autophagy 7, 552–554 (2011). sourceExperimental — accuracy not yet measured
The paper’s introductory passage discusses Nrf2 activation in macrophages exposed to LPS or E. coli. Searches for TFEB, nuclear TFEB intensity, microglia, and α-synuclein found no passage addressing the attributed claim. Section and page labels were not available in our copy. (LLM, conf=0.76)
- Supportedcites [47] Settembre, C. et al. TFEB links autophagy to lysosomal biogenesis. Science 332, 1429–1433 (2011). source
The paper’s Abstract states that TFEB nuclear localization and activity are regulated together, supporting nuclear TFEB as a readout of the pathway. The lack of change after hα-Syn exposure is the citing authors’ own result, attributed to their Supplementary Fig. 4, not a finding attributed to this source. (LLM, conf=0.88)
plain- Asserted: passes — The authors put it forward as true.
- Checkable: passes — It can be checked against evidence.
- Load-bearing: unclear — It is unclear whether the paper’s conclusions depend on it.
- Based: passes — The paper gives a reason why it holds.
- Could not verify
The cited sources support only part of this claim — read each source’s verdict below.
In the paper
“Mice injected with AAV9-hα-Syn in the SNpc showed loss of dopaminergic neurons on the ipsilateral side (Supplementary Fig. 1c), as reported29.”
§ Microglia clear neuron-released α-synuclein via selective autophagy and prevent neurodegeneration > Results > Neuron-released α-synuclein is engulfed by microglia in vivo
What the sources say
- Partly supportedcites [29] Oliveras-Salva, M. et al. rAAV2/7 vector-mediated overexpression of alpha-synuclein in mouse substantia nigra induces protein aggregation and progressive dose-dependent neurodegeneration. Mol. Neurodegener. 8, 44 (2013). sourceExperimental — accuracy not yet measured
The Results report loss of dopaminergic neurons on the injected side of the mouse substantia nigra, while the non-injected side showed no loss. However, the Methods identify the injected human α-synuclein vector as rAAV2/7, not AAV9; this paper does not establish the claimed effect for AAV9. (LLM, conf=0.90)
plaindirect- Asserted: passes — The authors put it forward as true.
- Checkable: passes — It can be checked against evidence.
- Load-bearing: passes — The paper’s conclusions depend on it.
- Based: passes — The paper gives a reason why it holds.
- Partly supported
The cited sources that could be checked couldn’t confirm or dispute this claim.
In the paper
“NRF2 or TFEB pathways were unaltered as shown by the lack of change in the level of NQO-1 and HO-1, two major targets of NRF2, or the intensity of nuclear TFEB in response to hα-Syn46,47 (Supplementary Fig. 4i, j).”
§ Microglia clear neuron-released α-synuclein via selective autophagy and prevent neurodegeneration > Results > NF-κB mediates α-synuclein-TLR4 signaling and p62 induction
What the sources say
- Could not verifycites [46] Fujita, K. & Srinivasula, S. M. TLR4-mediated autophagy in macrophages is a p62-dependent type of selective autophagy of aggresome-like induced structures (ALIS). Autophagy 7, 552–554 (2011). sourceExperimental — accuracy not yet measured
The opening summary and TLR4-signaling discussion (page numbers unavailable) report Nrf2 activation in macrophages exposed to LPS or E. coli. Our copy does not address hα-Syn exposure in microglia or report NQO-1, HO-1, or nuclear TFEB measurements; searches for those terms found no supporting passage. (LLM, conf=0.76)
- Could not verifycites [47] Settembre, C. et al. TFEB links autophagy to lysosomal biogenesis. Science 332, 1429–1433 (2011). sourceExperimental — accuracy not yet measured
The paper’s TFEB passages discuss nuclear translocation in response to starvation in HeLa cells, not hα-Syn exposure in microglia. Searches for NRF2, NQO-1, HO-1, microglia, and α-synuclein found no passage addressing whether the NRF2 pathway was unchanged under the claimed condition. (LLM, conf=0.77)
plain- Asserted: passes — The authors put it forward as true.
- Checkable: passes — It can be checked against evidence.
- Load-bearing: unclear — It is unclear whether the paper’s conclusions depend on it.
- Based: passes — The paper gives a reason why it holds.
- Could not verify
The cited sources that could be checked couldn’t confirm or dispute this claim.
In the paper
“Thus, synucleinphagy is a distinct process from LC3-associated phagocytosis (LAP)60.”
§ Microglia clear neuron-released α-synuclein via selective autophagy and prevent neurodegeneration > Discussion
What the sources say
- Could not verifycites [60] Martinez, J. et al. Molecular characterization of LC3-associated phagocytosis reveals distinct roles for Rubicon, NOX2 and autophagy proteins. Nat. Cell Biol. 17, 893–906 (2015). sourceExperimental — accuracy not yet measured
The Introduction describes LAP and distinguishes it from canonical autophagy, not from synucleinphagy. Searches for synucleinphagy, alpha-synuclein, and related terms found no passage in our copy addressing the claimed distinction; page numbers were not available. (LLM, conf=0.76)
plain- Asserted: passes — The authors put it forward as true.
- Checkable: passes — It can be checked against evidence.
- Load-bearing: passes — The paper’s conclusions depend on it.
- Based: passes — The paper gives a reason why it holds.
- Could not verify
- Probably not a substantial claim. 27
- It may state two separate claims as one. 19
Some cited sources support this claim and some don’t — read each source’s verdict below.
In the paper
“TLR4-NF-κB signaling was previously shown to induce selective autophagy after pathogen invasion52–54.”
§ Microglia clear neuron-released α-synuclein via selective autophagy and prevent neurodegeneration > Discussion
What the sources say
- Partly supportedcites [52] Shi, C. S. & Kehrl, J. H. MyD88 and Trif target Beclin 1 to trigger autophagy in macrophages. J. Biol. Chem. 283, 33175–33182 (2008). sourceExperimental — accuracy not yet measured
The ‘TLRs Induce Autophagy in Murine’ section reports that TLR4 ligands induced autophagosome formation in macrophages. The Discussion identifies MyD88, Trif and Beclin 1 in the proposed mechanism; although it mentions TLR-mediated NF-κB activation, it does not show that NF-κB induces the autophagy. The experiments also do not establish selective autophagy after pathogen invasion. (LLM, conf=0.88)
- Disputedcites [53] Watson, R. O., Manzanillo, P. S. & Cox, J. S. Extracellular M. tuberculosis DNA targets bacteria for autophagy by activating the host DNA-sensing pathway. Cell 150, 803–815 (2012). sourceExperimental — accuracy not yet measured
In Results, under “Cytosolic DNA Sensing Mediates Targeting of M. tuberculosis to Autophagosomes” (page unavailable), the paper reports that autophagy targeting remained normal in macrophages deficient in TLR signaling. It instead identifies cytosolic DNA sensing through STING as necessary for selective targeting of M. tuberculosis; it does not show induction by TLR4–NF-κB signaling. (LLM, conf=0.86)
Checked by a reasoning model — may be wrong.
- Partly supportedcites [54] Xu, Y. et al. Toll-like receptor 4 is a sensor for autophagy associated with innate immunity. Immunity 27, 135–144 (2007). sourceExperimental — accuracy not yet measured
The Results show that LPS induces autophagy through TLR4, and the Discussion identifies a TRIF-dependent pathway involving RIP1 and p38 MAPK. The paper also reports colocalization of mycobacterial phagosomes with autophagosomes, but it does not establish NF-κB as the mediator or characterize the response as selective autophagy after pathogen invasion. (LLM, conf=0.88)
plaindirect- Asserted: passes — The authors put it forward as true.
- Checkable: passes — It can be checked against evidence.
- Load-bearing: fails — The paper’s conclusions may not depend on it.
- Based: passes — The paper gives a reason why it holds.
Probably not a substantial claim. The paper’s conclusions may not depend on it.
- Partly supported
Some cited sources support this claim and some don’t — read each source’s verdict below.
In the paper
“A number of studies demonstrated that α-synuclein can enter the cells or penetrate cytoplasmic membrane through endocytosis-independent process61–63.”
§ Microglia clear neuron-released α-synuclein via selective autophagy and prevent neurodegeneration > Discussion
What the sources say
- Supportedcites [61] Ahn, K. J., Paik, S. R., Chung, K. C. & Kim, J. Amino acid sequence motifs and mechanistic features of the membrane translocation of alpha-synuclein. J. Neurochem. 97, 265–279 (2006). source
The Abstract reports that α-synuclein enters cells rapidly and that endocytosis inhibitors did not significantly affect its membrane translocation. The Discussion concludes that uptake occurs by a route distinct from normal endocytosis. Page numbers are not provided in our copy's passages. (LLM, conf=0.91)
- Not checked — no full text of the sourcecites [62] Lee, H. J. et al. Assembly-dependent endocytosis and clearance of extracellular alpha-synuclein. Int. J. Biochem. Cell Biol. 40, 1835–1849 (2008). source
- Disputedcites [63] Park, J. Y. et al. On the mechanism of internalization of alpha-synuclein into microglia: roles of ganglioside GM1 and lipid raft. J. Neurochem. 110, 400–411 (2009). sourceExperimental — accuracy not yet measured
The Discussion describes extracellular monomeric α-synuclein entering microglia via GM1-mediated endocytosis. It says this uptake is independent of clathrin, caveolae and dynamin, but lipid raft-dependent; independence from those pathways is not independence from endocytosis. (LLM, conf=0.88)
Checked by a reasoning model — may be wrong.
boosteddirect- Asserted: passes — The authors put it forward as true.
- Checkable: passes — It can be checked against evidence.
- Load-bearing: passes — The paper’s conclusions depend on it.
- Based: passes — The paper gives a reason why it holds.
Probably not a substantial claim.
- Supported
Every source the paper cites for this claim was checked and supports it.
In the paper
“Atg7 encodes an E1-like enzyme essential in the ubiquitin-like conjugation systems required for autophagy, and Atg14 encodes a positive regulator of VPS34 (refs. 38,39).”
§ Microglia clear neuron-released α-synuclein via selective autophagy and prevent neurodegeneration > Results > Microglia-engulfed α-synuclein is degraded by autophagy
What the sources say
- Supportedcites [38] Komatsu, M. et al. Impairment of starvation-induced and constitutive autophagy in Atg7-deficient mice. J. Cell Biol. 169, 425–434 (2005). source
The Introduction describes Atg7p as an E1-like enzyme that activates components of both ubiquitin-like conjugation systems. The Results state that Atg7 is essential for those systems and autophagosome formation in mice. This Atg7 paper supports the Atg7 clause; the separately cited Atg14 clause is not attributed to it. (LLM, conf=0.92)
- Supportedcites [39] Matsunaga, K. et al. Autophagy requires endoplasmic reticulum targeting of the PI3-kinase complex via Atg14L. J. Cell Biol. 190, 511–521 (2010). source
This source addresses the Atg14 clause of the sentence, rather than the Atg7 clause. The Introduction identifies Atg14L as a subunit of the autophagy-specific Vps34 PI3-kinase complex, and the Results and discussion conclude that Atg14L recruits that complex to the ER for autophagy. This supports describing Atg14 as a positive regulator of Vps34 in this context. (LLM, conf=0.86)
plain- Asserted: passes — The authors put it forward as true.
- Checkable: passes — It can be checked against evidence.
- Load-bearing: passes — The paper’s conclusions depend on it.
- Based: passes — The paper gives a reason why it holds.
Probably not a substantial claim. It may state two separate claims as one.
- Supported
The cited sources support only part of this claim — read each source’s verdict below.
In the paper
“Aggregated α-synuclein is a major component in intraneuronal inclusions known as Lewy bodies (LB) associated with neurodegenerative diseases, such as Parkinson’s disease (PD) and dementia with Lewy body (DLB)5,6.”
§ Microglia clear neuron-released α-synuclein via selective autophagy and prevent neurodegeneration > Introduction
What the sources say
- Not checked — no full text of the sourcecites [5] Baba, M. et al. Aggregation of alpha-synuclein in Lewy bodies of sporadic Parkinson’s disease and dementia with Lewy bodies. Am. J. Pathol. 152, 879–884 (1998).
- Partly supportedcites [6] Toledo, J. B. et al. Pathological alpha-synuclein distribution in subjects with coincident Alzheimer’s and Lewy body pathology. Acta Neuropathol. 131, 393–409 (2016). sourceExperimental — accuracy not yet measured
The Introduction describes α-synuclein in the form of Lewy body–related pathology in Parkinson’s disease and discusses that pathology in dementia with Lewy bodies. It does not specify that Lewy bodies are intraneuronal inclusions or that aggregated α-synuclein is a major component of them. (LLM, conf=0.82)
plaincorrelational- Asserted: passes — The authors put it forward as true.
- Checkable: passes — It can be checked against evidence.
- Load-bearing: fails — The paper’s conclusions may not depend on it.
- Based: passes — The paper gives a reason why it holds.
Probably not a substantial claim. The paper’s conclusions may not depend on it.
The cited sources support only part of this claim — read each source’s verdict below.
In the paper
“Previous reports showed α-synuclein can trigger TLR4 or TLR2 activation in cultured glia, which leads to an increase in inflammatory gene transcription19,40,41.”
§ Microglia clear neuron-released α-synuclein via selective autophagy and prevent neurodegeneration > Results > α-synuclein-induced p62 upregulation requires TLR4
What the sources say
- Supportedcites [19] Kim, C. et al. Neuron-released oligomeric alpha-synuclein is an endogenous agonist of TLR2 for paracrine activation of microglia. Nat. Commun. 4, 1562 (2013). source
The Results section ('Role of Tlr2 in α-synuclein-induced microglia activation') reports that α-synuclein released from cells induced inflammatory cytokine and chemokine genes in cultured microglia through TLR2. This supports the TLR2 alternative in the citing sentence; the paper does not support TLR4 activation by the α-synuclein preparation it tested. (LLM, conf=0.91)
- Partly supportedcites [40] Fellner, L. et al. Toll-like receptor 4 is required for alpha-synuclein dependent activation of microglia and astroglia. Glia 61, 349–360 (2013). sourceExperimental — accuracy not yet measured
The Results (page unavailable) show that α-synuclein treatment caused TLR4-dependent NF-κB nuclear translocation and increased inflammatory cytokine release in cultured murine glia. The paper measured cytokine release, not an increase in inflammatory gene transcription; its experiments address TLR4 rather than TLR2. (LLM, conf=0.84)
- Supportedcites [41] Rannikko, E. H., Weber, S. S. & Kahle, P. J. Exogenous alpha-synuclein induces toll-like receptor 4 dependent inflammatory responses in astrocytes. BMC Neurosci. 16, 57 (2015). source
The Results section reports that α-synuclein increased inflammatory-gene mRNA in cultured astrocytes, with no significant induction in Tlr4−/− astrocytes. This directly supports the TLR4 alternative in the citing sentence; the paper also discusses prior reports of TLR2-mediated microglial activation, but does not establish TLR2-dependent transcription in its own experiments. (LLM, conf=0.93)
plaindirect- Asserted: passes — The authors put it forward as true.
- Checkable: passes — It can be checked against evidence.
- Load-bearing: fails — The paper’s conclusions may not depend on it.
- Based: passes — The paper gives a reason why it holds.
Probably not a substantial claim. The paper’s conclusions may not depend on it.
- Supported
Every source the paper cites for this claim was checked and supports it.
In the paper
“p62/SQSTM1, an autophagy receptor34”
- Also stated in: § p62 mediates sequestration and degradation of α-synuclein · boosted
“p62 is known to recognize and interact with ubiquitinated cargo to initiate selective autophagy34.”
§ Microglia clear neuron-released α-synuclein via selective autophagy and prevent neurodegeneration > Results > Microglia-engulfed α-synuclein is degraded by autophagy
What the sources say
- Supportedcites [34] Lamark, T., Kirkin, V., Dikic, I. & Johansen, T. NBR1 and p62 as cargo receptors for selective autophagy of ubiquitinated targets. Cell Cycle 8, 1986–1990 (2009). source
The LIR–LC3/GABARAP Interaction section explicitly identifies p62/SQSTM1 as a cargo receptor for selective autophagy of ubiquitinated substrates. The Conclusions section also describes how p62 binds ubiquitin on substrates and links them to the forming autophagosome. (LLM, conf=0.94)
boosteddirect- Asserted: passes — The authors put it forward as true.
- Checkable: passes — It can be checked against evidence.
- Load-bearing: passes — The paper’s conclusions depend on it.
- Based: passes — The paper gives a reason why it holds.
Probably not a substantial claim.
- Also stated in: § p62 mediates sequestration and degradation of α-synuclein · boosted
The sources with a verdict support this claim; the rest weren’t checked yet, have no full text we could read, or their verdicts aren’t rated yet.
In the paper
“TLR4-LPS binding induces endocytosis of the TLR4-LPS complex and subsequent expression of interferon-beta 1 (Ifnb1) through activation of interferon regulatory factor 3 (IRF3)43,44.”
§ Microglia clear neuron-released α-synuclein via selective autophagy and prevent neurodegeneration > Results > α-synuclein-induced p62 upregulation requires TLR4
What the sources say
- Not checked — no full text of the sourcecites [43] Sakaguchi, S. et al. Essential role of IRF-3 in lipopolysaccharide-induced interferon-beta gene expression and endotoxin shock. Biochem. Bioph. Res. Commun. 306, 860–866 (2003). source
- Supportedcites [44] Zanoni, I. et al. CD14 controls the LPS-induced endocytosis of Toll-like receptor 4. Cell 147, 868–880 (2011). source
The Introduction (page unavailable) describes TLR4 encountering LPS, then entering endosomes, where TRAM–TRIF signaling activates IRF3 to regulate type I interferon expression. The Discussion (page unavailable) also describes transport of both TLR4 and LPS to endosomes. Together, these passages support the cited sequence leading to interferon-beta expression. (LLM, conf=0.88)
plaindirect- Asserted: passes — The authors put it forward as true.
- Checkable: passes — It can be checked against evidence.
- Load-bearing: fails — The paper’s conclusions may not depend on it.
- Based: passes — The paper gives a reason why it holds.
Probably not a substantial claim. The paper’s conclusions may not depend on it. It may state two separate claims as one.
The cited sources support only part of this claim — read each source’s verdict below.
In the paper
“Torin1, an inhibitor of mTOR that stimulates autophagy37”
§ Microglia clear neuron-released α-synuclein via selective autophagy and prevent neurodegeneration > Results > Microglia-engulfed α-synuclein is degraded by autophagy
What the sources say
- Partly supportedcites [37] Liu, Q. S. et al. Discovery of 1-(4-(4-Propionylpiperazin-1-yl)-3-(trifluoromethyl)phenyl)-9-(quinolin-3-yl)benzo[h][1,6]naphthyridin-2(1H)-one as a highly potent, selective mammalian target of rapamycin (mTOR) inhibitor for the treatment of cancer. J. Med. Chem. 53, 7146–7155 (2010). sourceExperimental — accuracy not yet measured
The Abstract identifies Torin1 as an mTOR inhibitor, and the Introduction says mTOR regulates autophagy. Our copy does not state that Torin1 stimulates autophagy; the autophagy claim is therefore unsupported by this source. (LLM, conf=0.86)
plaindirect- Asserted: passes — The authors put it forward as true.
- Checkable: passes — It can be checked against evidence.
- Load-bearing: passes — The paper’s conclusions depend on it.
- Based: passes — The paper gives a reason why it holds.
Probably not a substantial claim. It may state two separate claims as one.
- Partly supported
The cited sources support only part of this claim — read each source’s verdict below.
In the paper
“Previous studies suggest that α-synuclein is degraded by macroautophagy, chaperone-mediated autophagy, and the proteasome20–23.”
§ Microglia clear neuron-released α-synuclein via selective autophagy and prevent neurodegeneration > Introduction
What the sources say
- Not checked — no full text of the sourcecites [20] Cuervo, A. M., Stefanis, L., Fredenburg, R., Lansbury, P. T. & Sulzer, D. Impaired degradation of mutant alpha-synuclein by chaperone-mediated autophagy. Science 305, 1292–1295 (2004). source
- Supportedcites [21] Tofaris, G. K. et al. Ubiquitin ligase Nedd4 promotes alpha-synuclein degradation by the endosomal-lysosomal pathway. Proc. Natl Acad. Sci. USA 108, 17004–17009 (2011). source
The paper’s introductory passage explicitly says that proteasomes, macroautophagy, and chaperone-mediated autophagy have all been implicated in α-synuclein degradation. Its results section also reports contributions from proteasomes and macroautophagy to basal degradation. The claim appropriately frames these pathways as suggestions from previous studies. (LLM, conf=0.95)
- Supportedcites [22] Vogiatzi, T., Xilouri, M., Vekrellis, K. & Stefanis, L. Wild type alpha-synuclein is degraded by chaperone-mediated autophagy and macroautophagy in neuronal cells. J. Biol. Chem. 283, 23542–23556 (2008). source
The opening passage reports studies suggesting proteasomal degradation, while the Discussion reports macroautophagic clearance and the neuronal-cell results report degradation by CMA. The paper also says its own proteasomal-inhibition experiments found no significant effect, so the proteasome portion is supported as a suggestion from previous studies, not as this study’s finding. (LLM, conf=0.87)
- Partly supportedcites [23] Webb, J. L., Ravikumar, B., Atkins, J., Skepper, J. N. & Rubinsztein, D. C. alpha-synuclein is degraded by both autophagy and the proteasome. J. Biol. Chem. 278, 25009–25013 (2003). sourceExperimental — accuracy not yet measured
The Discussion reports that α-synuclein is degraded by the proteasome and autophagy in inducible PC12 cells. The paper describes autophagy through the formation of autophagosomes, consistent with macroautophagy, but our copy does not address chaperone-mediated autophagy; a search for that term found no supporting passage. (LLM, conf=0.87)
hedgeddirect- Asserted: passes — The authors put it forward as true.
- Checkable: passes — It can be checked against evidence.
- Load-bearing: fails — The paper’s conclusions may not depend on it.
- Based: passes — The paper gives a reason why it holds.
Probably not a substantial claim. The paper’s conclusions may not depend on it.
The cited sources support only part of this claim — read each source’s verdict below.
In the paper
“p62 has a role in the clearance of intra-cytosolic Shigella and Listeria55.”
§ Microglia clear neuron-released α-synuclein via selective autophagy and prevent neurodegeneration > Discussion
What the sources say
- Partly supportedcites [55] Mostowy, S. et al. p62 and NDP52 proteins target intracytosolic Shigella and Listeria to different autophagy pathways. J. Biol. Chem. 286, 26987–26995 (2011). sourceExperimental — accuracy not yet measured
The Discussion says p62 targets the Listeria ActA mutant to an autophagy pathway, supporting a role in its clearance. The section on p62 and NDP52 recruitment specifies that wild-type Listeria avoids p62 recognition, so the claim is too broad without the ActA-mutant qualification. Page numbers are not available in our copy. (LLM, conf=0.88)
plaindirect- Asserted: passes — The authors put it forward as true.
- Checkable: passes — It can be checked against evidence.
- Load-bearing: fails — The paper’s conclusions may not depend on it.
- Based: passes — The paper gives a reason why it holds.
Probably not a substantial claim. The paper’s conclusions may not depend on it.
- Partly supported
The cited sources support only part of this claim — read each source’s verdict below.
In the paper
“A number of studies demonstrated that α-synuclein can enter the cells or penetrate cytoplasmic membrane through endocytosis-independent process61–63.”
§ Microglia clear neuron-released α-synuclein via selective autophagy and prevent neurodegeneration > Discussion
What the sources say
- Supportedcites [61] Ahn, K. J., Paik, S. R., Chung, K. C. & Kim, J. Amino acid sequence motifs and mechanistic features of the membrane translocation of alpha-synuclein. J. Neurochem. 97, 265–279 (2006). source
The Discussion reports that α-synuclein entered cells despite treatment with endocytosis inhibitors and concludes that uptake occurs by a route distinct from normal endocytosis. This supports the citing sentence’s description of an endocytosis-independent process; the supplied passages do not give page numbers. (LLM, conf=0.92)
- Not checked — no full text of the sourcecites [62] Lee, H. J. et al. Assembly-dependent endocytosis and clearance of extracellular alpha-synuclein. Int. J. Biochem. Cell Biol. 40, 1835–1849 (2008). source
- Partly supportedcites [63] Park, J. Y. et al. On the mechanism of internalization of alpha-synuclein into microglia: roles of ganglioside GM1 and lipid raft. J. Neurochem. 110, 400–411 (2009). sourceExperimental — accuracy not yet measured
The Discussion reports that high-dose α-synuclein uptake can be temperature-independent and that monomeric uptake into microglia is independent of clathrin, caveolae and dynamin. But it describes the studied route as lipid-raft-dependent endocytosis, not as independent of endocytosis altogether. No page number is available in our copy. (LLM, conf=0.85)
boosteddirect- Asserted: passes — The authors put it forward as true.
- Checkable: passes — It can be checked against evidence.
- Load-bearing: passes — The paper’s conclusions depend on it.
- Based: passes — The paper gives a reason why it holds.
Probably not a substantial claim.
- Supported
Every source the paper cites for this claim was checked and supports it.
In the paper
“TLR2 also plays a role in neurons in response to α-synuclein in addition to microglia19,57,58.”
§ Microglia clear neuron-released α-synuclein via selective autophagy and prevent neurodegeneration > Discussion
What the sources say
- Supportedcites [19] Kim, C. et al. Neuron-released oligomeric alpha-synuclein is an endogenous agonist of TLR2 for paracrine activation of microglia. Nat. Commun. 4, 1562 (2013). source
The Results section, “Role of Tlr2 in α-synuclein-induced microglia activation,” reports reduced signaling in Tlr2-deficient microglia and concludes that TLR2 mediates their response to α-synuclein. The in vivo Results section likewise reports lower microglial activation in Tlr2-deficient mice. (LLM, conf=0.94)
- Supportedcites [57] Dzamko, N. et al. Toll-like receptor 2 is increased in neurons in Parkinson’s disease brain and may contribute to alpha-synuclein pathology. Acta Neuropathol. 133, 303–319 (2017). source
The Introduction states that α-synuclein can activate TLR2 on microglia and promote inflammatory cytokine production. The Discussion likewise reports that oligomeric and fibrillar α-synuclein activate microglial TLR2 in tissue-culture experiments. (LLM, conf=0.93)
- Supportedcites [58] Kim, C. et al. Antagonizing neuronal Toll-like receptor 2 prevents synucleinopathy by activating autophagy. Cell Rep. 13, 771–782 (2015). source
The Discussion reports that α-synuclein oligomers released from neurons activate TLR2 in microglia and induce proinflammatory responses. Although it describes this as a previous finding, the paper reports and relies on it when discussing microglia-based mechanisms. (LLM, conf=0.92)
plaincorrelational- Asserted: passes — The authors put it forward as true.
- Checkable: passes — It can be checked against evidence.
- Load-bearing: fails — The paper’s conclusions may not depend on it.
- Based: passes — The paper gives a reason why it holds.
Probably not a substantial claim. The paper’s conclusions may not depend on it.
- Supported
Every source the paper cites for this claim was checked and supports it.
In the paper
“p62 has a role in the clearance of intra-cytosolic Shigella and Listeria55.”
§ Microglia clear neuron-released α-synuclein via selective autophagy and prevent neurodegeneration > Discussion
What the sources say
- Supportedcites [55] Mostowy, S. et al. p62 and NDP52 proteins target intracytosolic Shigella and Listeria to different autophagy pathways. J. Biol. Chem. 286, 26987–26995 (2011). source
The Results report that p62 and NDP52 act interdependently to target intracytosolic Shigella toward autophagy. The Discussion links this pathway to bacterial clearance, supporting the stated role for p62. (LLM, conf=0.91)
plaindirect- Asserted: passes — The authors put it forward as true.
- Checkable: passes — It can be checked against evidence.
- Load-bearing: fails — The paper’s conclusions may not depend on it.
- Based: passes — The paper gives a reason why it holds.
Probably not a substantial claim. The paper’s conclusions may not depend on it.
- Supported
The cited sources support only part of this claim — read each source’s verdict below.
In the paper
“TLR2 also plays a role in neurons in response to α-synuclein in addition to microglia19,57,58.”
§ Microglia clear neuron-released α-synuclein via selective autophagy and prevent neurodegeneration > Discussion
What the sources say
- Partly supportedcites [19] Kim, C. et al. Neuron-released oligomeric alpha-synuclein is an endogenous agonist of TLR2 for paracrine activation of microglia. Nat. Commun. 4, 1562 (2013). sourceExperimental — accuracy not yet measured
The Results section on TLR2 upregulation reports TLR2 labeling in pyramidal neurons, but the α-synuclein-related increase it describes is in microglia. The in vivo Results show that α-synuclein expressed by neurons activates microglia through TLR2; they do not establish that TLR2 mediates a neuronal response to α-synuclein. Page numbers are unavailable in our copy. (LLM, conf=0.82)
- Partly supportedcites [57] Dzamko, N. et al. Toll-like receptor 2 is increased in neurons in Parkinson’s disease brain and may contribute to alpha-synuclein pathology. Acta Neuropathol. 133, 303–319 (2017). sourceExperimental — accuracy not yet measured
The Introduction and Discussion report neuronal TLR2 expression and show that activating neuronal TLR2 increases α-synuclein protein. They do not show that neurons activate TLR2 in response to α-synuclein; the experiments activated TLR2 with an agonist, so the direction implied by “in response to” is not established. (LLM, conf=0.83)
- Supportedcites [58] Kim, C. et al. Antagonizing neuronal Toll-like receptor 2 prevents synucleinopathy by activating autophagy. Cell Rep. 13, 771–782 (2015). source
The Results section reports that TLR2 is expressed in neurons and that its activation increases α-synuclein accumulation and toxicity in human neural precursor cells. TLR2 knockdown reduced those effects, supporting a neuronal role alongside the microglial role discussed in the paper. (LLM, conf=0.92)
plaincorrelational- Asserted: passes — The authors put it forward as true.
- Checkable: passes — It can be checked against evidence.
- Load-bearing: fails — The paper’s conclusions may not depend on it.
- Based: passes — The paper gives a reason why it holds.
Probably not a substantial claim. The paper’s conclusions may not depend on it.
- Partly supported
Every source the paper cites for this claim was checked and supports it.
In the paper
“emerging human genomic studies suggest the autophagy–lysosome system as a converging pathogenic pathway of PD64”
§ Microglia clear neuron-released α-synuclein via selective autophagy and prevent neurodegeneration > Discussion
What the sources say
- Supportedcites [64] Chang, D. et al. A meta-analysis of genome-wide association studies identifies 17 new Parkinson’s disease risk loci. Nat. Genet. 49, 1511–1516 (2017). source
The paper states that its genetic findings indicate a key role for autophagy and lysosomal biology in PD risk (Abstract). It also reports enrichment of PD-associated signals among autophagy and lysosomal genes, supporting the citing sentence’s hedged description of a converging pathway. (LLM, conf=0.92)
hedgeddirect- Asserted: passes — The authors put it forward as true.
- Checkable: passes — It can be checked against evidence.
- Load-bearing: fails — The paper’s conclusions may not depend on it.
- Based: passes — The paper gives a reason why it holds.
Probably not a substantial claim. The paper’s conclusions may not depend on it.
- Supported
The cited sources support only part of this claim — read each source’s verdict below.
In the paper
“many PD-related genes such as PINK1, PARKIN, GBA, and LRRK2, were shown to play a role in autophagy-related pathways in glial cells65.”
§ Microglia clear neuron-released α-synuclein via selective autophagy and prevent neurodegeneration > Discussion
What the sources say
- Partly supportedcites [65] Gan-Or, Z., Dion, P. A. & Rouleau, G. A. Genetic perspective on the role of the autophagy-lysosome pathway in Parkinson disease. Autophagy 11, 1443–1457 (2015). sourceExperimental — accuracy not yet measured
The Introduction and the sections on PARK2/PINK1, GBA, and LRRK2 link these PD-related genes to autophagy or lysosomal pathways. The passages do not establish that these roles were shown specifically in glial cells, so the cell-type qualifier is unsupported. (LLM, conf=0.88)
plaincorrelational- Asserted: passes — The authors put it forward as true.
- Checkable: passes — It can be checked against evidence.
- Load-bearing: fails — The paper’s conclusions may not depend on it.
- Based: passes — The paper gives a reason why it holds.
Probably not a substantial claim. The paper’s conclusions may not depend on it.
- Partly supported
A result the paper reports from its own data — it cites no other source for it, so there is none to check. The quote shows it is in the paper.
In the paper
“Thus, we concluded that microglia engulf extracellular α-syn protein, which is sequestered by autophagosomes and degraded by the autophagy–lysosome pathway.”
- Also stated in: § Abstract · plain
“which in turn engulf α-synuclein into autophagosomes for degradation via selective autophagy (termed synucleinphagy).”
§ Microglia clear neuron-released α-synuclein via selective autophagy and prevent neurodegeneration > Results > Microglia-engulfed α-synuclein is degraded by autophagy
boosteddirect- Asserted: passes — The authors put it forward as true.
- Checkable: passes — It can be checked against evidence.
- Load-bearing: passes — The paper’s conclusions depend on it.
- Based: passes — The paper gives a reason why it holds.
It may state two separate claims as one.
- Rests on an assumption: The two mouse models used (AAV9-hα-Syn and hα-Syn-Tg) faithfully model neuron-released α-synuclein relevant to human synucleinopathies.
- Also stated in: § Abstract · plain
A result the paper reports from its own data — it cites no other source for it, so there is none to check. The quote shows it is in the paper.
In the paper
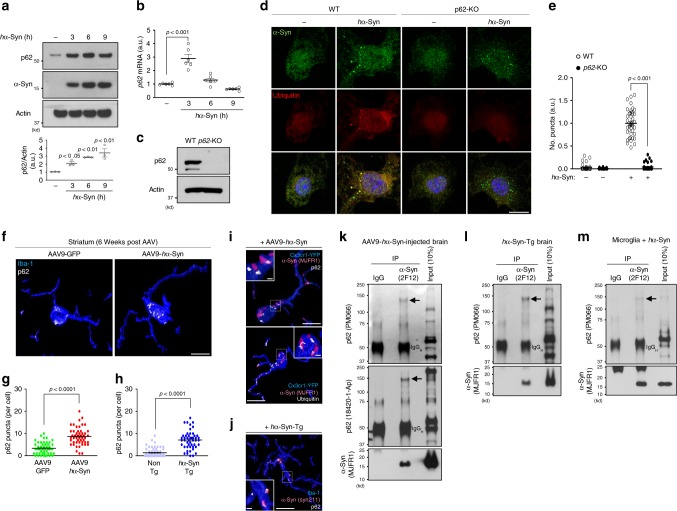
“total LC3-II levels changed little after hα-Syn treatment (Supplementary Fig. 4i), suggesting no significant alteration of overall autophagy.”
- Also stated in: § p62 mediates sequestration and degradation of α-synuclein · hedged
“other autophagy receptors such as Ndp52, Optineurin, and Nbr1 were not altered (Supplementary Fig. 4i), suggesting that hα-Syn selectively induces p62 expression without affecting other autophagy receptors.”
§ Microglia clear neuron-released α-synuclein via selective autophagy and prevent neurodegeneration > Results > p62 mediates sequestration and degradation of α-synuclein
hedged- Asserted: passes — The authors put it forward as true.
- Checkable: passes — It can be checked against evidence.
- Load-bearing: passes — The paper’s conclusions depend on it.
- Based: passes — The paper gives a reason why it holds.
It may state two separate claims as one.
- Also stated in: § p62 mediates sequestration and degradation of α-synuclein · hedged
A result the paper reports from its own data — it cites no other source for it, so there is none to check. The quote shows it is in the paper.
In the paper
“We observed that hα-Syn treatment caused an increase in p62 protein up to 9 h (Fig. 3a).”
- Also stated in: § p62 mediates sequestration and degradation of α-synuclein · plain
“p62 mRNA levels peaked at 3 h, declined at 6 h, and returned to baseline at 9 h post treatment (Fig. 3b)”
§ Microglia clear neuron-released α-synuclein via selective autophagy and prevent neurodegeneration > Results > p62 mediates sequestration and degradation of α-synuclein
plaindirect- Asserted: passes — The authors put it forward as true.
- Checkable: passes — It can be checked against evidence.
- Load-bearing: passes — The paper’s conclusions depend on it.
- Based: passes — The paper gives a reason why it holds.
It may state two separate claims as one.
- Also stated in: § p62 mediates sequestration and degradation of α-synuclein · plain
A result the paper reports from its own data — it cites no other source for it, so there is none to check. The quote shows it is in the paper.
In the paper
“Actinomycin D, a blocker of mRNA translation, inhibited p62 induction when added before hα-Syn treatment (Supplementary Fig. 4g) and suppressed the formation of hα-Syn/ubiquitin-positive puncta (Supplementary fig. 4h).”
§ Microglia clear neuron-released α-synuclein via selective autophagy and prevent neurodegeneration > Results > p62 mediates sequestration and degradation of α-synuclein
plaindirect- Asserted: passes — The authors put it forward as true.
- Checkable: passes — It can be checked against evidence.
- Load-bearing: passes — The paper’s conclusions depend on it.
- Based: passes — The paper gives a reason why it holds.
It may state two separate claims as one.
A result the paper reports from its own data — it cites no other source for it, so there is none to check. The quote shows it is in the paper.
In the paper
“Neither cytochalasin D, a blocker of actin polymerization necessary for phagocytosis, nor Dynasore, a GTPase inhibitor that suppresses both clathrin-dependent and independent endocytosis, inhibited the uptake of hα-Syn protein but rather it increased the uptake (Supplementary Figs. 4b, 5a, 5b).”
§ Microglia clear neuron-released α-synuclein via selective autophagy and prevent neurodegeneration > Results > Microglia-engulfed α-synuclein is degraded by autophagy
plaindirect- Asserted: passes — The authors put it forward as true.
- Checkable: passes — It can be checked against evidence.
- Load-bearing: passes — The paper’s conclusions depend on it.
- Based: passes — The paper gives a reason why it holds.
It may state two separate claims as one.
A result the paper reports from its own data — it cites no other source for it, so there is none to check. The quote shows it is in the paper.
In the paper
“only ML-120B significantly suppressed p62 induction and reduced the number of hα-Syn/ubiquitin-positive puncta after hα-Syn treatment (Fig. 5b, c)”
§ Microglia clear neuron-released α-synuclein via selective autophagy and prevent neurodegeneration > Results > NF-κB mediates α-synuclein-TLR4 signaling and p62 induction
plain- Asserted: passes — The authors put it forward as true.
- Checkable: passes — It can be checked against evidence.
- Load-bearing: passes — The paper’s conclusions depend on it.
- Based: passes — The paper gives a reason why it holds.
It may state two separate claims as one.
A result the paper reports from its own data — it cites no other source for it, so there is none to check. The quote shows it is in the paper.
In the paper
“Finally, disruption of microglial autophagy in mice expressing human α-synuclein promotes the accumulation of misfolded α-synuclein and causes midbrain dopaminergic neuron degeneration.”
§ Microglia clear neuron-released α-synuclein via selective autophagy and prevent neurodegeneration > Abstract
plaindirect- Asserted: passes — The authors put it forward as true.
- Checkable: passes — It can be checked against evidence.
- Load-bearing: passes — The paper’s conclusions depend on it.
- Based: passes — The paper gives a reason why it holds.
It may state two separate claims as one.
- Rests on an assumption: The two mouse models used (AAV9-hα-Syn and hα-Syn-Tg) faithfully model neuron-released α-synuclein relevant to human synucleinopathies.
A result the paper reports from its own data — it cites no other source for it, so there is none to check. The quote shows it is in the paper.
In the paper
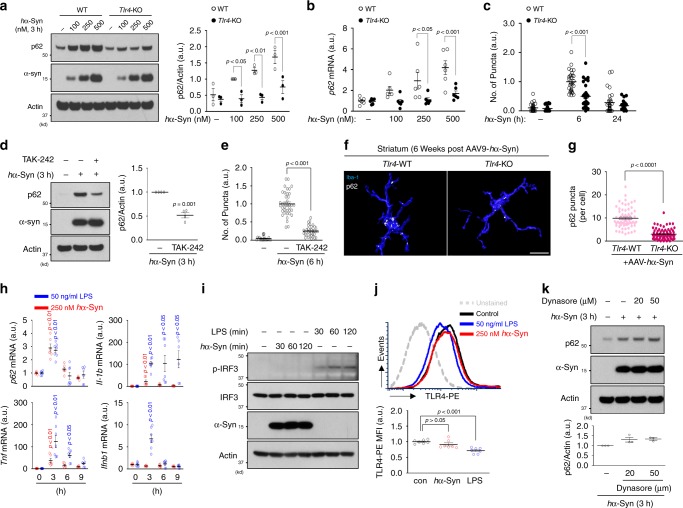
“LPS, but not hα-Syn, induced Ifnb1 expression (Fig. 4h) and increased levels of p-IFR3 (S396), a marker of IRF3 activation (Fig. 4i), indicating the absence of IRF3 signaling in hα-Syn-treated microglia.”
§ Microglia clear neuron-released α-synuclein via selective autophagy and prevent neurodegeneration > Results > α-synuclein-induced p62 upregulation requires TLR4
hedged- Asserted: passes — The authors put it forward as true.
- Checkable: passes — It can be checked against evidence.
- Load-bearing: unclear — It is unclear whether the paper’s conclusions depend on it.
- Based: passes — The paper gives a reason why it holds.
It may state two separate claims as one.
A result the paper reports from its own data — it cites no other source for it, so there is none to check. The quote shows it is in the paper.
In the paper
“Similar to Tlr4-KO microglia, TAK-242-treated cells showed impaired p62 induction (Fig. 4d) as well as a reduction in the number of hα-Syn/ubiquitin-positive puncta following hα-Syn treatment (Fig. 4e).”
§ Microglia clear neuron-released α-synuclein via selective autophagy and prevent neurodegeneration > Results > α-synuclein-induced p62 upregulation requires TLR4
plaindirect- Asserted: passes — The authors put it forward as true.
- Checkable: passes — It can be checked against evidence.
- Load-bearing: passes — The paper’s conclusions depend on it.
- Based: passes — The paper gives a reason why it holds.
It may state two separate claims as one.
In the paper
“TAK-242, an inhibitor of TLR4 signaling by selectively binding to Cys747 of TLR4 cytoplasmic tail that disrupts its interaction with adaptor molecules TIRAP and TRAM42”
§ Microglia clear neuron-released α-synuclein via selective autophagy and prevent neurodegeneration > Results > α-synuclein-induced p62 upregulation requires TLR4
What the sources say
- Not checked — no full text of the sourcecites [42] Matsunaga, N., Tsuchimori, N., Matsumoto, T. & Ii, M. TAK-242 (resatorvid), a small-molecule inhibitor of Toll-like receptor (TLR) 4 signaling, binds selectively to TLR4 and interferes with interactions between TLR4 and its adaptor molecules. Mol. Pharm. 79, 34–41 (2011). source
plaindirect- Asserted: passes — The authors put it forward as true.
- Checkable: passes — It can be checked against evidence.
- Load-bearing: fails — The paper’s conclusions may not depend on it.
- Based: passes — The paper gives a reason why it holds.
Probably not a substantial claim. The paper’s conclusions may not depend on it.
A conclusion the paper draws from its own results — it cites no other source for it, so there is none to check. The quote shows it is in the paper.
In the paper
“The above observations suggest that the hα-Syn-TLR4 interaction stimulates p62 expression without causing TLR4 receptor endocytosis distinctively from LPS-TLR4 signaling.”
§ Microglia clear neuron-released α-synuclein via selective autophagy and prevent neurodegeneration > Results > α-synuclein-induced p62 upregulation requires TLR4
hedgeddirect- Asserted: passes — The authors put it forward as true.
- Checkable: passes — It can be checked against evidence.
- Load-bearing: passes — The paper’s conclusions depend on it.
- Based: passes — The paper gives a reason why it holds.
It may state two separate claims as one.
In the paper
“Recent evidence demonstrates a strong selectivity for autophagy28.”
§ Microglia clear neuron-released α-synuclein via selective autophagy and prevent neurodegeneration > Introduction
What the sources say
- Not checked — no full text of the sourcecites [28] Stolz, A., Ernst, A. & Dikic, I. Cargo recognition and trafficking in selective autophagy. Nat. Cell Biol. 16, 495–501 (2014). source
boosted- Asserted: passes — The authors put it forward as true.
- Checkable: passes — It can be checked against evidence.
- Load-bearing: passes — The paper’s conclusions depend on it.
- Based: passes — The paper gives a reason why it holds.
Probably not a substantial claim.
A conclusion the paper draws from its own results — it cites no other source for it, so there is none to check. The quote shows it is in the paper.
In the paper
“Thus, our results uncover a microglia-specific α-synuclein degradation pathway termed synucleinphagy that regulates α-synuclein homeostasis in the CNS.”
§ Microglia clear neuron-released α-synuclein via selective autophagy and prevent neurodegeneration > Introduction
plaindirect- Asserted: passes — The authors put it forward as true.
- Checkable: passes — It can be checked against evidence.
- Load-bearing: passes — The paper’s conclusions depend on it.
- Based: passes — The paper gives a reason why it holds.
It may state two separate claims as one.
- Rests on an assumption: Direct evidence for autophagy in selective degradation of α-synuclein is entirely lacking.
- Rests on an assumption: Whether microglia take part in the degradation of α-synuclein remains unclear.
- Rests on an assumption: The exact mechanism for the clearance of internalized α-synuclein remains unclear.
A claim is checked only against the cited paper’s full text, never its abstract, and none is available for its sources.
In the paper
“Previous evidence suggested “prion-like” cell-to-cell transmission of α-synuclein9,10.”
§ Microglia clear neuron-released α-synuclein via selective autophagy and prevent neurodegeneration > Introduction
What the sources say
- Not checked — no full text of the sourcecites [9] Kordower, J. H., Chu, Y., Hauser, R. A., Freeman, T. B. & Olanow, C. W. Lewy body-like pathology in long-term embryonic nigral transplants in Parkinson’s disease. Nat. Med. 14, 504–506 (2008). source
- Not checked — no full text of the sourcecites [10] Li, J. Y. et al. Lewy bodies in grafted neurons in subjects with Parkinson’s disease suggest host-to-graft disease propagation. Nat. Med. 14, 501–503 (2008). source
hedged- Asserted: passes — The authors put it forward as true.
- Checkable: passes — It can be checked against evidence.
- Load-bearing: passes — The paper’s conclusions depend on it.
- Based: passes — The paper gives a reason why it holds.
Probably not a substantial claim.
A claim is checked only against the cited paper’s full text, never its abstract, and none is available for its sources.
In the paper
“Autophagy is a bulk degradation pathway responsible for the clearance of protein aggregates and damaged cellular organelles26,27.”
§ Microglia clear neuron-released α-synuclein via selective autophagy and prevent neurodegeneration > Introduction
What the sources say
- Not checked — no full text of the sourcecites [26] Mizushima, N., Yoshimori, T. & Ohsumi, Y. The role of Atg proteins in autophagosome formation. Annu. Rev. Cell Dev. Biol. 27, 107–132 (2011). source
- Not checked — no full text of the sourcecites [27] Yamamoto, A. & Yue, Z. Autophagy and its normal and pathogenic states in the brain. Annu. Rev. Neurosci. 37, 55–78 (2014). source
plaindirect- Asserted: passes — The authors put it forward as true.
- Checkable: passes — It can be checked against evidence.
- Load-bearing: fails — The paper’s conclusions may not depend on it.
- Based: passes — The paper gives a reason why it holds.
Probably not a substantial claim. The paper’s conclusions may not depend on it.
In the paper
“SAR405, an inhibitor of VPS34, which is a class III phosphatidylinositol 3-kinase required for autophagosome membrane synthesis36”
§ Microglia clear neuron-released α-synuclein via selective autophagy and prevent neurodegeneration > Results > Microglia-engulfed α-synuclein is degraded by autophagy
What the sources say
- Not checked — no full text of the sourcecites [36] Ronan, B. et al. A highly potent and selective Vps34 inhibitor alters vesicle trafficking and autophagy. Nat. Chem. Biol. 10, 1013 (2014). source
plain- Asserted: passes — The authors put it forward as true.
- Checkable: passes — It can be checked against evidence.
- Load-bearing: passes — The paper’s conclusions depend on it.
- Based: passes — The paper gives a reason why it holds.
Probably not a substantial claim.
A conclusion the paper draws from its own results — it cites no other source for it, so there is none to check. The quote shows it is in the paper.
In the paper
“Synucleinphagy requires the presence of microglial Toll-like receptor 4 (TLR4), which induces transcriptional upregulation of p62/SQSTM1 through the NF-κB signaling pathway.”
§ Microglia clear neuron-released α-synuclein via selective autophagy and prevent neurodegeneration > Abstract
plaindirect- Asserted: passes — The authors put it forward as true.
- Checkable: passes — It can be checked against evidence.
- Load-bearing: passes — The paper’s conclusions depend on it.
- Based: passes — The paper gives a reason why it holds.
It may state two separate claims as one.
A claim is checked only against the cited paper’s full text, never its abstract, and none is available for its sources.
In the paper
“Increased α-synuclein level due to the multiplication of SNCA alleles is causal to PD7,8.”
§ Microglia clear neuron-released α-synuclein via selective autophagy and prevent neurodegeneration > Introduction
What the sources say
- Not checked — no full text of the sourcecites [7] Chartier-Harlin, M. C. et al. alpha-synuclein locus duplication as a cause of familial Parkinson’s disease. Lancet 364, 1167–1169 (2004). source
- Not checked — no full text of the sourcecites [8] Singleton, A. B. et al. alpha-synuclein locus triplication causes Parkinson’s disease. Science 302, 841–841 (2003). source
plaindirect- Asserted: passes — The authors put it forward as true.
- Checkable: passes — It can be checked against evidence.
- Load-bearing: fails — The paper’s conclusions may not depend on it.
- Based: passes — The paper gives a reason why it holds.
Probably not a substantial claim. The paper’s conclusions may not depend on it.
A conclusion the paper draws from its own results — it cites no other source for it, so there is none to check. The quote shows it is in the paper.
In the paper
“We document that ingested α-synuclein in microglia is sequestered by autophagosomes for degradation, which is mediated by TLR4-NF-κB signaling through upregulation of the autophagy receptor, p62/SQSTM1.”
§ Microglia clear neuron-released α-synuclein via selective autophagy and prevent neurodegeneration > Introduction
boosteddirect- Asserted: passes — The authors put it forward as true.
- Checkable: passes — It can be checked against evidence.
- Load-bearing: passes — The paper’s conclusions depend on it.
- Based: passes — The paper gives a reason why it holds.
It may state two separate claims as one.
- Rests on an assumption: Direct evidence for autophagy in selective degradation of α-synuclein is entirely lacking.
- Rests on an assumption: Whether microglia take part in the degradation of α-synuclein remains unclear.
- Rests on an assumption: The exact mechanism for the clearance of internalized α-synuclein remains unclear.
A conclusion the paper draws from its own results — it cites no other source for it, so there is none to check. The quote shows it is in the paper.
In the paper
“supporting that oligomeric p62 directly binds and recruits hα-Syn into autophagosomes.”
§ Microglia clear neuron-released α-synuclein via selective autophagy and prevent neurodegeneration > Results > p62 mediates sequestration and degradation of α-synuclein
hedgeddirect- Asserted: passes — The authors put it forward as true.
- Checkable: passes — It can be checked against evidence.
- Load-bearing: passes — The paper’s conclusions depend on it.
- Based: passes — The paper gives a reason why it holds.
It may state two separate claims as one.
- Rests on an assumption: The high molecular weight p62 species observed by co-immunoprecipitation is oligomeric p62.
A conclusion the paper draws from its own results — it cites no other source for it, so there is none to check. The quote shows it is in the paper.
In the paper
“likely due to lack of the TLR4-NF-κB pathway.”
§ Microglia clear neuron-released α-synuclein via selective autophagy and prevent neurodegeneration > Discussion
hedgedconditional- Asserted: passes — The authors put it forward as true.
- Checkable: passes — It can be checked against evidence.
- Load-bearing: passes — The paper’s conclusions depend on it.
- Based: passes — The paper gives a reason why it holds.
It may state two separate claims as one.
What the paper did — it cites no source for this, so there is none to check. The quote shows it is in the paper.
In the paper
“Application of LPS, Pam3CSK4, and recombinant Flagellin peptides selectively increased NF-κB activity in TLR4 complex, TLR2 and TLR2 combinations, and TLR5, respectively (Supplementary Fig. 6).”
§ Microglia clear neuron-released α-synuclein via selective autophagy and prevent neurodegeneration > Results > TLR4 is a preferred TLR for α-synuclein to activate NF-κB
plaindirect- Asserted: passes — The authors put it forward as true.
- Checkable: passes — It can be checked against evidence.
- Load-bearing: fails — The paper’s conclusions may not depend on it.
- Based: passes — The paper gives a reason why it holds.
Probably not a substantial claim. The paper’s conclusions may not depend on it.
What the paper did — it cites no source for this, so there is none to check. The quote shows it is in the paper.
In the paper
“Application of LPS, Pam3CSK4, and recombinant Flagellin peptides selectively increased NF-κB activity in TLR4 complex, TLR2 and TLR2 combinations, and TLR5, respectively (Supplementary Fig. 6).”
§ Microglia clear neuron-released α-synuclein via selective autophagy and prevent neurodegeneration > Results > TLR4 is a preferred TLR for α-synuclein to activate NF-κB
plaindirect- Asserted: passes — The authors put it forward as true.
- Checkable: passes — It can be checked against evidence.
- Load-bearing: fails — The paper’s conclusions may not depend on it.
- Based: passes — The paper gives a reason why it holds.
Probably not a substantial claim. The paper’s conclusions may not depend on it.
What the paper did — it cites no source for this, so there is none to check. The quote shows it is in the paper.
In the paper
“Data are representative of at least three independent experiments unless indicated.”
§ Microglia clear neuron-released α-synuclein via selective autophagy and prevent neurodegeneration > Methods > Statistics and reproducibility
plain- Asserted: passes — The authors put it forward as true.
- Checkable: passes — It can be checked against evidence.
- Load-bearing: fails — The paper’s conclusions may not depend on it.
- Based: passes — The paper gives a reason why it holds.
Probably not a substantial claim. The paper’s conclusions may not depend on it.
What the paper did — it cites no source for this, so there is none to check. The quote shows it is in the paper.
In the paper
“These parameters yielded a coefficient of error <10% throughout the analysis.”
§ Microglia clear neuron-released α-synuclein via selective autophagy and prevent neurodegeneration > Methods > Image analysis and quantification
plain- Asserted: passes — The authors put it forward as true.
- Checkable: passes — It can be checked against evidence.
- Load-bearing: passes — The paper’s conclusions depend on it.
- Based: passes — The paper gives a reason why it holds.
Probably not a substantial claim.
A conclusion the paper draws from its own results — it cites no other source for it, so there is none to check. The quote shows it is in the paper.
In the paper
“our study supports a model that a portion of extracellular α-synuclein interacts with TLR4 (or TLR2), which then triggers NF-κB signaling, while a majority of α-synuclein penetrates cytoplasmic membrane or enters microglia through TLR4 endocytosis-independent manner.”
§ Microglia clear neuron-released α-synuclein via selective autophagy and prevent neurodegeneration > Discussion
hedgeddirect- Asserted: passes — The authors put it forward as true.
- Checkable: passes — It can be checked against evidence.
- Load-bearing: unclear — It is unclear whether the paper’s conclusions depend on it.
- Based: passes — The paper gives a reason why it holds.
It may state two separate claims as one.
What the paper did — it cites no source for this, so there is none to check. The quote shows it is in the paper.
In the paper
“Data are representative of at least three independent experiments.”
§ Microglia clear neuron-released α-synuclein via selective autophagy and prevent neurodegeneration > Results > NF-κB mediates α-synuclein-TLR4 signaling and p62 induction
plain- Asserted: passes — The authors put it forward as true.
- Checkable: passes — It can be checked against evidence.
- Load-bearing: passes — The paper’s conclusions depend on it.
- Based: passes — The paper gives a reason why it holds.
Probably not a substantial claim.
The paper relies on this without support.
The high molecular weight p62 species observed by co-immunoprecipitation is oligomeric p62.
“supporting that oligomeric p62 directly binds and recruits hα-Syn into autophagosomes.”
The paper relies on this without support.
Direct evidence for autophagy in selective degradation of α-synuclein is entirely lacking.
“Direct evidence for autophagy in selective degradation of α-synuclein is entirely lacking.”
The paper relies on this without support.
Whether microglia take part in the degradation of α-synuclein remains unclear.
“whether or not microglia, the prototypical scavenger cell in the brain, take part in the degradation of α-synuclein remains unclear.”
The paper relies on this without support.
The exact mechanism for the clearance of internalized α-synuclein remains unclear.
“However, the exact mechanism for the clearance of internalized α-synuclein remains unclear.”
The paper relies on this without support.
The two mouse models used (AAV9-hα-Syn and hα-Syn-Tg) faithfully model neuron-released α-synuclein relevant to human synucleinopathies.
“we employed two mouse models, both of which express wild-type (WT) human α-synuclein (hα-Syn) in a neuron-specific manner.”
Claims other papers make about this one
Each is checked against this paper’s own text: does it say what the citing paper says it does?
The source backs part of the claim, not all of it — or backs it for a different population, condition or comparison.
In the citing paper
“In animal models of PD and in PD patients, misfolded α-synuclein was found to be released from injured neurons into the extracellular fluid.51,61,62”
From Role of neuroinflammation in neurodegeneration development (2023) · cites this paper as [62]
Experimental — accuracy not yet measured
Statistics that don’t add up
Each reported p-value recomputed from its test statistic and degrees of freedom.
Rated minor: it would not touch a result — a value no result rests on, a p-value that stays on the same side of the significance level, or a conflict that is clerical, resolved elsewhere in the paper, or outside its own findings.
In the paper
“F(3, 6) = 11.46, p = 0.0003”
§ Microglia clear neuron-released α-synuclein via selective autophagy and prevent neurodegeneration > Results > α-synuclein-induced p62 upregulation requires TLR4
Reported p = .0003 · recomputed p = .007
Statistics recomputed
Every reported test result, recomputed from its test statistic and degrees of freedom. A result shows as not adding up only once an independent check has confirmed it.
- Doesn’t add upF(3, 6) = 11.46reported p = .0003 · recomputed p = .007
“F(3, 6) = 11.46, p = .0003”
- ConsistentF(5, 168) = 139.6reported p = 6.43e-58 · recomputed p < .001
“F(5,168) = 139.6, p = 6.43e-58”
- ConsistentF(5, 162) = 118.4reported p = 3.14e-52 · recomputed p < .001
“F(5,162) = 118.4, p = 3.14e-52”
- ConsistentF(3, 130) = 39.88reported p = 2.43e-18 · recomputed p < .001
“F(3,130)=39.88, p = 2.43e-18”
- ConsistentF(3, 8) = 13.44reported p = .0017 · recomputed p = .002
“F(3,8) = 13.44, p = .0017”
- ConsistentF(3, 20) = 35.43reported p = 3.39e-8 · recomputed p < .001
“F(3,20) = 35.43, p = 3.39e-08”
- ConsistentF(1, 139) = 272.5reported p = 1.44e-34 · recomputed p < .001
“F(1,139)=272.5, p = 1.44e-34”
- ConsistentF(1, 139) = 315.3reported p = 1.45e-37 · recomputed p < .001
“F(1,139) = 315.3, p = 1.45e-37”
- ConsistentF(1, 139) = 303.7reported p = 8.81e-37 · recomputed p < .001
“F(1,139)=303.7, p = 8.81e-37”
- ConsistentF(3, 16) = 3.381reported p = .0443 · recomputed p = .044
“F(3,16) = 3.381, p = .0443”
- ConsistentF(1, 16) = 43.09reported p = .00000651 · recomputed p < .001
“F(1,16) = 43.09, p = 6.51e-06”
- ConsistentF(3, 40) = 3.199reported p = .0334 · recomputed p = .033
“F(3,40) = 3.199, p = .0334”
- ConsistentF(3, 40) = 8.326reported p = .0002 · recomputed p < .001
“F(3,40) = 8.326, p = .0002”
- ConsistentF(1, 40) = 21.77reported p = .0000341 · recomputed p < .001
“F(1,40) = 21.77, p = 3.41e-05”
- ConsistentF(2, 174) = 12.56reported p = .00000803 · recomputed p < .001
“F(2,174) = 12.56, p = 8.03e-06”
- ConsistentF(2, 174) = 91.61reported p = 6.64e-28 · recomputed p < .001
“F(2,174) = 91.61, p = 6.64e-28”
- ConsistentF(1, 174) = 24.89reported p = .00000146 · recomputed p < .001
“F(1,174) = 24.89, p = 1.46e-06”
- ConsistentF(2, 92) = 156.7reported p = 2.35e-30 · recomputed p < .001
“F(2,92) = 156.7, p = 2.35e-30”
- ConsistentF(3, 20) = 35.43reported p = 3.39e-8 · recomputed p < .001
“F(3,20)=35.43, p = 3.39e-08”
- ConsistentF(3, 20) = 6.655reported p = .0027 · recomputed p = .003
“F(3,20) = 6.655, p = .0027”
- ConsistentF(3, 20) = 8.907reported p = .0006 · recomputed p < .001
“F(3,20) = 8.907, p = .0006”
- ConsistentF(3, 20) = 5.104reported p = .0087 · recomputed p = .009
“F(3,20) = 5.104, p = .0087”
- ConsistentF(3, 23) = 19.53reported p = .00000161 · recomputed p < .001
“F(3,23) = 19.53, p = 1.61e-06”
- ConsistentF(3, 23) = 4.643reported p = .0111 · recomputed p = .011
“F(3,23) = 4.643, p = .0111”
- ConsistentF(3, 23) = 12.09reported p = .0000592 · recomputed p < .001
“F(3,23) = 12.09, p = 5.92e-05”
- ConsistentF(3, 23) = 35.86reported p = 7.68e-9 · recomputed p < .001
“F(3,23)=35.86, p = 7.68e-09”
- ConsistentF(2, 18) = 15.1reported p = .0001 · recomputed p < .001
“F(2,18) = 15.10, p = .0001”
- ConsistentF(4, 24) = 9.196reported p = .0001 · recomputed p < .001
“F(4,24) = 9.196, p = .0001”
- ConsistentF(4, 24) = 4.53reported p = .0072 · recomputed p = .007
“F(4,24) = 4.530, p = .0072”
- ConsistentF(4, 24) = 0.8644reported p = .4994 · recomputed p = .499
“F(4,24) = 0.8644, p = .4994”
- ConsistentF(4, 24) = 1.369reported p = .2741 · recomputed p = .274
“F(4,24) = 1.369, p = .2741”
- ConsistentF(4, 24) = 5.372reported p = .0031 · recomputed p = .003
“F(4,24) = 5.372, p = .0031”
- ConsistentF(3, 12) = 3.75reported p = .0413 · recomputed p = .041
“F(3,12) = 3.750, p = .0413”
- ConsistentF(4, 160) = 56.21reported p = 1.53e-29 · recomputed p < .001
“F(4,160) = 56.21, p = 1.53e-29”
- ConsistentF(3, 40) = 20.7reported p = 2.95e-8 · recomputed p < .001
“F(3,40) = 20.70, p = 2.95e-08”
- ConsistentF(3, 40) = 69.43reported p = 6.55e-16 · recomputed p < .001
“F(3,40) = 69.43, p = 6.55e-16”
- ConsistentF(1, 40) = 69.57reported p = 2.74e-10 · recomputed p < .001
“F(1,40) = 69.57, p = 2.74e-10”
- ConsistentF(3, 40) = 10.12reported p = .0000432 · recomputed p < .001
“F(3,40) = 10.12, p = 4.32e-05”
- ConsistentF(3, 40) = 21.73reported p = 1.64e-8 · recomputed p < .001
“F(3,40) = 21.73, p = 1.64e-08”
- ConsistentF(1, 40) = 34.36reported p = 7.39e-7 · recomputed p < .001
“F(1,40) = 34.36, p = 7.39e-07”
- ConsistentF(3, 20) = 22.11reported p = .00000146 · recomputed p < .001
“F(3,20) = 22.11, p = 1.46e-06”
- ConsistentF(3, 20) = 11.88reported p = .0001 · recomputed p < .001
“F(3,20) = 11.88, p = .0001”
- ConsistentF(4, 80) = 19.63reported p = 2.74e-11 · recomputed p < .001
“F(4,80) = 19.63, p = 2.74e-11”
- ConsistentF(4, 80) = 27.31reported p = 2.66e-14 · recomputed p < .001
“F(4,80) = 27.31, p = 2.66e-14”
- ConsistentF(1, 80) = 47.95reported p = 9.9e-10 · recomputed p < .001
“F(1,80) = 47.95, p = 9.90e-10”
- ConsistentF(5, 126) = 6.07reported p = .0000454 · recomputed p < .001
“F(5,126) = 6.070, p = 4.54e-05”
- ConsistentF(5, 126) = 6.07reported p = .0000454 · recomputed p < .001
“F(5,126) =6.070, p = 4.54e-05”
- ConsistentF(1, 126) = 73.83reported p = 2.77e-14 · recomputed p < .001
“F(1,126) = 73.83, p = 2.77e-14”
- ConsistentF(3, 64) = 16.98reported p = 3.19e-8 · recomputed p < .001
“F(3,64) = 16.98, p = 3.19e-08”
- ConsistentF(3, 64) = 177.4reported p = 5.9e-31 · recomputed p < .001
“F(3,64) = 177.4, p = 5.90e-31”
- ConsistentF(1, 64) = 17.47reported p = .0000903 · recomputed p < .001
“F(1,64) = 17.47, p = 9.03e-05”
Self-check
Percentages, sums and reported differences re-computed from the paper’s own numbers.
Each contradiction between two passages listed here was confirmed by an independent check.
Rated minor: it would not touch a result — a value no result rests on, a p-value that stays on the same side of the significance level, or a conflict that is clerical, resolved elsewhere in the paper, or outside its own findings.
In the paper
§ Microglia clear neuron-released α-synuclein via selective autophagy and prevent neurodegeneration > Results > α-synuclein-induced p62 upregulation requires TLR4
“F(3, 6) = 11.46, p = 0.0003 for hα-Syn”
§ Microglia clear neuron-released α-synuclein via selective autophagy and prevent neurodegeneration > Results > α-synuclein-induced p62 upregulation requires TLR4
“F(3,16) = 3.381, p = 0.0443 for hα-Syn-genotype interaction; F(3, 6) = 11.46, p = 0.0003 for hα-Syn; F(1,16) = 43.09, p = 6.51E-06 for genotype”
Cited works that were retracted
Works this paper cites that were later retracted, from the retraction notices publishers deposit. Major when the notice came out before this paper was published.
A note, not an issue: for example, a cited work that was retracted only after this paper was published, which its authors could not have known.
In the paper
“Martinez, J. et al. Molecular characterization of LC3-associated phagocytosis reveals distinct roles for Rubicon, NOX2 and autophagy proteins. Nat. Cell Biol. 17, 893–906 (2015).”
Cited work 10.1038/ncb3192 · retracted 2024-03-04 · notice 10.1038/s41556-024-01383-1 · this paper published 2020-03-13
Citations
Cites
1 retracted
Martinez, J., Malireddi, R. K. S., Lu, Q., Cunha, L. D., Pelletier, S., Gingras, S., Orchard, R., Guan, J.-L., Tan, H., Peng, J., et al. (2015) · Nature Cell Biology · doi:10.1038/ncb3192 · Cited by 758
RetractedStaging of brain pathology related to sporadic Parkinson’s disease
Braak, H., Tredici, K. D., Rüb, U., de Vos, R. A. I., Jansen Steur, E. N. H., & Braak, E. (2003) · Neurobiology of Aging · doi:10.1016/s0197-4580(02)00065-9 · Cited by 10,777
A Unique Microglia Type Associated with Restricting Development of Alzheimer’s Disease
Keren-Shaul, H., Spinrad, A., Weiner, A., Matcovitch-Natan, O., Dvir-Szternfeld, R., Ulland, T. K., David, E., Baruch, K., Lara-Astaiso, D., Toth, B., et al. (2017) · Cell · doi:10.1016/j.cell.2017.05.018 · Cited by 5,493
α-Synuclein Locus Triplication Causes Parkinson's Disease
Singleton, A. B., Farrer, M., Johnson, J., Singleton, A., Hague, S., Kachergus, J., Hulihan, M., Peuralinna, T., Dutra, A., Nussbaum, R., et al. (2003) · Science · doi:10.1126/science.1090278 · Cited by 4,383
Loss of autophagy in the central nervous system causes neurodegeneration in mice
Komatsu, M., Waguri, S., Chiba, T., Murata, S., Iwata, J.-I., Tanida, I., Ueno, T., Koike, M., Uchiyama, Y., Kominami, E., et al. (2006) · Nature · doi:10.1038/nature04723 · Cited by 3,500
TFEB Links Autophagy to Lysosomal Biogenesis
Settembre, C., Di Malta, C., Polito, V. A., Arencibia, M. G., Vetrini, F., Erdin, S., Erdin, S. U., Huynh, T., Medina, D., Colella, P., et al. (2011) · Science · doi:10.1126/science.1204592 · Cited by 3,365
Krasemann, S., Madore, C., Cialic, R., Baufeld, C., Calcagno, N., El Fatimy, R., Beckers, L., O’Loughlin, E., Xu, Y., Fanek, Z., et al. (2017) · Immunity · doi:10.1016/j.immuni.2017.08.008 · Cited by 2,979
The Role of Atg Proteins in Autophagosome Formation
Mizushima, N., Yoshimori, T., & Ohsumi, Y. (2011) · Annual Review of Cell and Developmental Biology · doi:10.1146/annurev-cellbio-092910-154005 · Cited by 2,978
Microglia promote learning-dependent synapse formation through brain-derived neurotrophic factor
Parkhurst, C. N., Yang, G., Ninan, I., Savas, J. N., Yates, J. R., Lafaille, J. J., Hempstead, B. L., Littman, D. R., & Gan, W.-B. (2013) · Cell · doi:10.1016/j.cell.2013.11.030 · Cited by 2,599
Luk, K. C., Kehm, V., Carroll, J., Zhang, B., O’Brien, P., Trojanowski, J. Q., & Lee, V. M.-Y. (2012) · Science · doi:10.1126/science.1227157 · Cited by 2,563
Self-citationIdentification of a unique TGF-β–dependent molecular and functional signature in microglia
Butovsky, O., Jedrychowski, M. P., Moore, C. S., Cialic, R., Lanser, A. J., Gabriely, G., Koeglsperger, T., Dake, B., Wu, P. M., Doykan, C. E., et al. (2014) · Nature Neuroscience · doi:10.1038/nn.3599 · Cited by 2,543
Impairment of starvation-induced and constitutive autophagy in Atg7 -deficient mice
Komatsu, M., Waguri, S., Ueno, T., Iwata, J., Murata, S., Tanida, I., Ezaki, J., Mizushima, N., Ohsumi, Y., Uchiyama, Y., et al. (2005) · The Journal of Cell Biology · doi:10.1083/jcb.200412022 · Cited by 2,331
Homeostatic levels of p62 control cytoplasmic inclusion body formation in autophagy-deficient mice.
Komatsu, M., Waguri, S., Koike, M., Sou, Y.-S., Ueno, T., Hara, T., Mizushima, N., Iwata, J.-I., Ezaki, J., Murata, S., et al. (2007) · Cell · doi:10.1016/j.cell.2007.10.035 · Cited by 2,124
Self-citationMizushima, N., Yamamoto, A., Matsui, M., Yoshimori, T., & Ohsumi, Y. (2004) · Molecular Biology of the Cell · doi:10.1091/mbc.e03-09-0704 · Cited by 2,105
α-synuclein locus duplication as a cause of familial Parkinson's disease
Chartier-Harlin, M.-C., Kachergus, J., Roumier, C., Mouroux, V., Douay, X., Lincoln, S., Levecque, C., Larvor, L., Andrieux, J., Hulihan, M., et al. (2004) · The Lancet · doi:10.1016/s0140-6736(04)17103-1 · Cited by 2,029
Impaired Degradation of Mutant α-Synuclein by Chaperone-Mediated Autophagy
Cuervo, A. M., Stefanis, L., Fredenburg, R., Lansbury, P. T., & Sulzer, D. (2004) · Science · doi:10.1126/science.1101738 · Cited by 2,024
Li, J.-Y., Englund, E., Holton, J. L., Soulet, D., Hagell, P., Lees, A. J., Lashley, T., Quinn, N. P., Rehncrona, S., Björklund, A., et al. (2008) · Nature Medicine · doi:10.1038/nm1746 · Cited by 1,845
Lewy body–like pathology in long-term embryonic nigral transplants in Parkinson's disease
Kordower, J. H., Chu, Y., Hauser, R. A., Freeman, T. B., & Olanow, C. W. (2008) · Nature Medicine · doi:10.1038/nm1747 · Cited by 1,722
(1998) · Europe PMC (PubMed Central) · Cited by 1,594
α-Synuclein Is Degraded by Both Autophagy and the Proteasome
Webb, J. L., Ravikumar, B., Atkins, J., Skepper, J. N., & Rubinsztein, D. C. (2003) · Journal of Biological Chemistry · doi:10.1074/jbc.m300227200 · Cited by 1,429
Iwai, A., Masliah, E., Yoshimoto, M., Ge, N., Flanagan, L., Rohan de Silva, H. A., Kittel, A., & Saitoh, T. (1995) · Neuron · doi:10.1016/0896-6273(95)90302-x · Cited by 1,316
Cargo recognition and trafficking in selective autophagy
Stolz, A., Ernst, A., & Dikic, I. (2014) · Nature Cell Biology · doi:10.1038/ncb2979 · Cited by 1,207
NF-κB Restricts Inflammasome Activation via Elimination of Damaged Mitochondria
Zhong, Z., Umemura, A., Sanchez-Lopez, E., Liang, S., Shalapour, S., Wong, J., He, F., Boassa, D., Perkins, G., Ali, S. R., et al. (2016) · Cell · doi:10.1016/j.cell.2015.12.057 · Cited by 1,197
Wu, Y.-T., Tan, H.-L., Shui, G., Bauvy, C., Huang, Q., Wenk, M. R., Ong, C.-N., Codogno, P., & Shen, H.-M. (2010) · Journal of Biological Chemistry · doi:10.1074/jbc.m109.080796 · Cited by 1,127
A meta-analysis of genome-wide association studies identifies 17 new Parkinson's disease risk loci
Chang, D., Nalls, M. A., Hallgrímsdóttir, I. B., Hunkapiller, J., van der Brug, M., Cai, F., International Parkinson's Disease Genomics Consortium, 23andMe Research Team, Kerchner, G. A., Ayalon, G., et al. (2017) · Nature Genetics · doi:10.1038/ng.3955 · Cited by 1,112
CD14 Controls the LPS-Induced Endocytosis of Toll-like Receptor 4
Zanoni, I., Ostuni, R., Marek, L. R., Barresi, S., Barbalat, R., Barton, G. M., Granucci, F., & Kagan, J. C. (2011) · Cell · doi:10.1016/j.cell.2011.09.051 · Cited by 997
α-Synuclein Cooperates with CSPα in Preventing Neurodegeneration
Chandra, S. S., Gallardo, G., Fernández‐Chacón, R., Schlüter, O. M., & Südhof, T. C. (2005) · Cell · doi:10.1016/j.cell.2005.09.028 · Cited by 992
Murphy, D. D., Rueter, S. M., Trojanowski, J. Q., & Lee, V. M. ‐. (2000) · Journal of Neuroscience · doi:10.1523/jneurosci.20-09-03214.2000 · Cited by 925
Toll-like Receptor 4 Is a Sensor for Autophagy Associated with Innate Immunity
Xu, Y., Jagannath, C., Liu, X.-D., Sharafkhaneh, A., Kolodziejska, K. E., & Eissa, N. T. (2007) · Immunity · doi:10.1016/j.immuni.2007.05.022 · Cited by 880
Lee, H.-J., Suk, J.-E., Patrick, C., Bae, E.-J., Cho, J.-H., Rho, S., Hwang, D., Masliah, E., & Lee, S.-J. (2010) · Journal of Biological Chemistry · doi:10.1074/jbc.m109.081125 · Cited by 877
Kim, C., Ho, D.-H., Suk, J.-E., You, S., Michael, S., Kang, J., Joong Lee, S., Masliah, E., Hwang, D., Lee, H.-J., et al. (2013) · Nature Communications · doi:10.1038/ncomms2534 · Cited by 856
Assembly and localization of Toll-like receptor signalling complexes
Gay, N. J., Symmons, M. F., Gangloff, M., & Bryant, C. E. (2014) · Nature Reviews Immunology · doi:10.1038/nri3713 · Cited by 832
Bendor, J. T., Logan, T. P., & Edwards, R. H. (2013) · Neuron · doi:10.1016/j.neuron.2013.09.004 · Cited by 825
Watson, R. O., Manzanillo, P. S., & Cox, J. S. (2012) · Cell · doi:10.1016/j.cell.2012.06.040 · Cited by 755
Toll‐like receptor 4 is required for α‐synuclein dependent activation of microglia and astroglia
Fellner, L., Irschick, R., Schanda, K., Reindl, M., Klimaschewski, L., Poewe, W., Wenning, G. K., & Stefanova, N. (2013) · Glia · doi:10.1002/glia.22437 · Cited by 697
Pathological α-synuclein transmission initiated by binding lymphocyte-activation gene 3
Mao, X., Ou, M. T., Karuppagounder, S. S., Kam, T.-I., Yin, X., Xiong, Y., Ge, P., Umanah, G. E., Brahmachari, S., Shin, J.-H., et al. (2016) · Science · doi:10.1126/science.aah3374 · Cited by 690
Vogiatzi, T., Xilouri, M., Vekrellis, K., & Stefanis, L. (2008) · Journal of Biological Chemistry · doi:10.1074/jbc.m801992200 · Cited by 683
Matsunaga, N., Tsuchimori, N., Matsumoto, T., & Ii, M. (2011) · Molecular Pharmacology · doi:10.1124/mol.110.068064 · Cited by 597
Rockenstein, E., Mallory, M., Hashimoto, M., Song, D., Shults, C. W., Lang, I., & Masliah, E. (2002) · Journal of Neuroscience Research · doi:10.1002/jnr.10231 · Cited by 502
A highly potent and selective Vps34 inhibitor alters vesicle trafficking and autophagy
Ronan, B., Flamand, O., Vescovi, L., Dureuil, C., Durand, L., Fassy, F., Bachelot, M.-F., Lamberton, A., Mathieu, M., Bertrand, T., et al. (2014) · Nature Chemical Biology · doi:10.1038/nchembio.1681 · Cited by 500
Assembly-dependent endocytosis and clearance of extracellular a-synuclein
Lee, H.-J., Suk, J.-E., Bae, E.-J., Lee, J.-H., Paik, S. R., & Lee, S.-J. (2008) · The International Journal of Biochemistry & Cell Biology · doi:10.1016/j.biocel.2008.01.017 · Cited by 470
NBR1 and p62 as cargo receptors for selective autophagy of ubiquitinated targets
Lamark, T., Kirkin, V., Dikic, I., & Johansen, T. (2009) · Cell Cycle · doi:10.4161/cc.8.13.8892 · Cited by 464
Autophagy requires endoplasmic reticulum targeting of the PI3-kinase complex via Atg14L
Matsunaga, K., Morita, E., Saitoh, T., Akira, S., Ktistakis, N. T., Izumi, T., Noda, T., & Yoshimori, T. (2010) · Journal of Cell Biology · doi:10.1083/jcb.200911141 · Cited by 456
MyD88 and Trif Target Beclin 1 to Trigger Autophagy in Macrophages
Shi, C.-S., & Kehrl, J. H. (2008) · Journal of Biological Chemistry · doi:10.1074/jbc.m804478200 · Cited by 395
Clearance and deposition of extracellular α-synuclein aggregates in microglia
Lee, H.-J., Suk, J.-E., Bae, E.-J., & Lee, S.-J. (2008) · Biochemical and Biophysical Research Communications · doi:10.1016/j.bbrc.2008.05.045 · Cited by 343
Friedman, L. G., Lachenmayer, M. L., Wang, J., He, L., Poulose, S. M., Komatsu, M., Holstein, G. R., & Yue, Z. (2012) · The Journal of Neuroscience · doi:10.1523/jneurosci.5809-11.2012 · Cited by 303
Self-citationp62 and NDP52 Proteins Target Intracytosolic Shigella and Listeria to Different Autophagy Pathways
Mostowy, S., Sancho-Shimizu, V., Hamon, M. A., Simeone, R., Brosch, R., Johansen, T., & Cossart, P. (2011) · Journal of Biological Chemistry · doi:10.1074/jbc.m111.223610 · Cited by 294
Jang, A., Lee, H., Suk, J., Jung, J., Kim, K., & Lee, S. (2010) · Journal of Neurochemistry · doi:10.1111/j.1471-4159.2010.06695.x · Cited by 281
Dzamko, N., Gysbers, A., Perera, G., Bahar, A., Shankar, A., Gao, J., Fu, Y., & Halliday, G. M. (2017) · Acta Neuropathologica · doi:10.1007/s00401-016-1648-8 · Cited by 273
Toll-Like Receptor 4 Promotes α-Synuclein Clearance and Survival of Nigral Dopaminergic Neurons
Stefanova, N., Fellner, L., Reindl, M., Masliah, E., Poewe, W., & Wenning, G. K. (2011) · The American Journal of Pathology · doi:10.1016/j.ajpath.2011.04.013 · Cited by 272
Ubiquitin ligase Nedd4 promotes α-synuclein degradation by the endosomal–lysosomal pathway
Tofaris, G. K., Kim, H. T., Hourez, R., Jung, J.-W., Kim, K. P., & Goldberg, A. L. (2011) · Proceedings of the National Academy of Sciences · doi:10.1073/pnas.1109356108 · Cited by 271
Sakaguchi, S., Negishi, H., Asagiri, M., Nakajima, C., Mizutani, T., Takaoka, A., Honda, K., & Taniguchi, T. (2003) · Biochemical and Biophysical Research Communications · doi:10.1016/s0006-291x(03)01049-0 · Cited by 264
Genetic perspective on the role of the autophagy-lysosome pathway in Parkinson disease
Gan-Or, Z., Dion, P. A., & Rouleau, G. A. (2015) · Autophagy · doi:10.1080/15548627.2015.1067364 · Cited by 260
Liu, Q., Chang, J. W., Wang, J., Kang, S. A., Thoreen, C. C., Markhard, A., Hur, W., Zhang, J., Sim, T., Sabatini, D. M., et al. (2010) · Journal of Medicinal Chemistry · doi:10.1021/jm101144f · Cited by 257
Autophagy and Its Normal and Pathogenic States in the Brain
Yamamoto, A., & Yue, Z. (2014) · Annual Review of Neuroscience · doi:10.1146/annurev-neuro-071013-014149 · Cited by 204
Self-citationOliveras-Salvá, M., Van der Perren, A., Casadei, N., Stroobants, S., Nuber, S., D’Hooge, R., Van den Haute, C., & Baekelandt, V. (2013) · Molecular Neurodegeneration · doi:10.1186/1750-1326-8-44 · Cited by 191
Choi, J., Park, S., Biering, S. B., Selleck, E. M., Liu, C. Y., Zhang, X., Fujita, N., Saitoh, T., Akira, S., Yoshimori, T., et al. (2014) · Immunity · doi:10.1016/j.immuni.2014.05.006 · Cited by 186
Exogenous α-synuclein induces toll-like receptor 4 dependent inflammatory responses in astrocytes
Rannikko, E. H., Weber, S. S., & Kahle, P. J. (2015) · BMC Neuroscience · doi:10.1186/s12868-015-0192-0 · Cited by 185
Toledo, J. B., Gopal, P., Raible, K., Irwin, D. J., Brettschneider, J., Sedor, S., Waits, K., Boluda, S., Grossman, M., Van Deerlin, V. M., et al. (2016) · Acta Neuropathologica · doi:10.1007/s00401-015-1526-9 · Cited by 184
Goodwin, L., Splinter, E., Davis, T. L., Urban, R., He, H., Braun, R., Chesler, E., Kumar, V., van Min, M., Ndukum, J., et al. (2017) · bioRxiv · doi:10.1101/gr.233866.117 · Cited by 184
Assessment of α-Synuclein Secretion in Mouse and Human Brain Parenchyma
Emmanouilidou, E., Elenis, D., Papasilekas, T., Stranjalis, G., Gerozissis, K., Ioannou, P. C., & Vekrellis, K. (2011) · PLoS ONE · doi:10.1371/journal.pone.0022225 · Cited by 163
Extracellular α-synuclein levels are regulated by neuronal activity
Yamada, K., & Iwatsubo, T. (2018) · Molecular Neurodegeneration · doi:10.1186/s13024-018-0241-0 · Cited by 148
Antagonizing Neuronal Toll-like Receptor 2 Prevents Synucleinopathy by Activating Autophagy
Kim, C., Rockenstein, E., Spencer, B., Kim, H.-K., Adame, A., Trejo, M., Stafa, K., Lee, H.-J., Lee, S.-J., & Masliah, E. (2015) · Cell Reports · doi:10.1016/j.celrep.2015.09.044 · Cited by 135
Park, J., Kim, K. S., Lee, S., Ryu, J., Chung, K. C., Choo, Y., Jou, I., Kim, J., & Park, S. M. (2009) · Journal of Neurochemistry · doi:10.1111/j.1471-4159.2009.06150.x · Cited by 135
Amino acid sequence motifs and mechanistic features of the membrane translocation of α‐synuclein
Ahn, K. J., Paik, S. R., Chung, K. C., & Kim, J. (2006) · Journal of Neurochemistry · doi:10.1111/j.1471-4159.2006.03731.x · Cited by 123
Main, B. S., Zhang, M., Brody, K. M., Ayton, S., Frugier, T., Steer, D., Finkelstein, D., Crack, P. J., & Taylor, J. M. (2016) · Glia · doi:10.1002/glia.23028 · Cited by 92
Impairment of starvation-induced and constitutive autophagy in Atg7-deficient mice.
Komatsu, M., Waguri, S., Ueno, T., et al. (2016) · Tokyo Tech Research Repository (Tokyo Institute of Technology) · Cited by 88
Fujita, K.-I., & Srinivasula, S. M. (2011) · Autophagy · doi:10.4161/auto.7.5.15101 · Cited by 65
Lin, Y.-C., Kuo, H.-C., Wang, J.-S., & Lin, W.-W. (2012) · The Journal of Immunology · doi:10.4049/jimmunol.1102739 · Cited by 46
Trehalose does not improve neuronal survival on exposure to alpha-synuclein pre-formed fibrils
Redmann, M., Wani, W. Y., Volpicelli-Daley, L., Darley-Usmar, V., & Zhang, J. (2017) · Redox Biology · doi:10.1016/j.redox.2016.12.032 · Cited by 46
Detection of MicroRNAs in Microglia by Real-time PCR in Normal CNS and During Neuroinflammation
Veremeyko, T., Starossom, S. C., Weiner, H. L., & Ponomarev, E. D. (2012) · Journal of Visualized Experiments · doi:10.3791/4097 · Cited by 37
IWAI, A., MASLIAH, E., YOSHIMOTO, M., et al. (1995) · UCL Discovery (University College London) · Cited by 23
Harari, Y., & Castro, G. A. (1985) · Molecular and Biochemical Parasitology · doi:10.1016/0166-6851(85)90093-3 · Cited by 9
Detection of MicroRNAs in Microglia by Real-time PCR in Normal CNS and During Neuroinflammation
Veremeyko, T., Starossom, S. C., Weiner, H. L., et al. (2012) · Journal of Visualized Experiments · doi:10.3791/4097-v · Cited by 9
Cited by
Sorted by citations
Role of neuroinflammation in neurodegeneration development
Zhang, W., Xiao, D., Mao, Q., & Xia, H. (2023) · Signal Transduction and Targeted Therapy · doi:10.1038/s41392-023-01486-5 · Cited by 1,668
Microglia in neurodegenerative diseases: mechanism and potential therapeutic targets
Gao, C., Jiang, J., Tan, Y., & Chen, S. (2023) · Signal Transduction and Targeted Therapy · doi:10.1038/s41392-023-01588-0 · Cited by 1,616
“As CNS monitors, microglia take up and degrade α-syn, whose internalization can activate microglia and cause neuroinflammation.(238,239) Different conformation states of α-syn can activate microglia in PD, leading to increased secretion of IL-6, IL-1β, and NO.”
BackgroundAutophagy in major human diseases
Klionsky, D. J., Petroni, G., Amaravadi, R. K., Baehrecke, E. H., Ballabio, A., Boya, P., Bravo‐San Pedro, J. M., Cadwell, K., Cecconi, F., Choi, A. M. K., et al. (2021) · The EMBO Journal · doi:10.15252/embj.2021108863 · Cited by 1,585
Self-citationMicrobiota–gut–brain axis and its therapeutic applications in neurodegenerative diseases
Loh, J. S., Mak, W. Q., Tan, L. K. S., Ng, C. X., Chan, H. H., Yeow, S. H., Foo, J. B., Ong, Y. S., How, C. W., & Khaw, K. Y. (2024) · Signal Transduction and Targeted Therapy · doi:10.1038/s41392-024-01743-1 · Cited by 1,193
The different autophagy degradation pathways and neurodegeneration
Fleming, A., Bourdenx, M., Fujimaki, M., Karabiyik, C., Krause, G. J., Lopez, A., Martín‐Segura, A., Puri, C., Scrivo, A., Skidmore, J., et al. (2022) · Neuron · doi:10.1016/j.neuron.2022.01.017 · Cited by 500
Metadata
- Authors
- Choi, I., Zhang, Y., Seegobin, S. P., Pruvost, M., Wang, Q., Purtell, K., Zhang, B., & Yue, Z.
- Affiliations
- Icahn School of Medicine at Mount Sinai (US)
- Corresponding author
- Yue, Zhenyu
- ORCID
- Venue
- Nature Communications
- Published
- 2020-03-13
- Volume
- 11
- Issue
- 1
- Pages
- 1386-1386
- ISSN
- 2041-1723 (ISSN-L)
- PMC
- PMC7069981
- OpenAlex
- W3011306000
- Semantic Scholar
- 0f4f3bc638feddb76ae7720b6dba5b2be88e755a
- Cited by
- 549
- References
- 78
- Citations by year
- 2026: 71 · 2025: 112 · 2024: 97 · 2023: 75 · 2022: 100 · 2021: 69 · 2020: 25
- FWCI
- 22.04
- Type
- journal article
- Language
- en
- Open access
- gold
- doi.org
- Locations
- Nature Communications (publishedVersion, cc-by)
- bioRxiv (Cold Spring Harbor Laboratory) (acceptedVersion)
- PubMed (publishedVersion)
- PubMed Central (submittedVersion, cc-by)
- RePEc: Research Papers in Economics (submittedVersion)
- DOAJ (DOAJ: Directory of Open Access Journals) (submittedVersion, cc-by-sa)
- Funders
- U.S. Department of Health & Human Services | NIH | National Institute of Neurological Disorders and Stroke (NS060123, P50NS094733)
- Topics
- Life Sciences › Neuroscience › Neurology › Neuroinflammation and Neurodegeneration Mechanisms
- Health Sciences › Medicine › Clinical Neurology › Parkinson's Disease Mechanisms and Treatments
- Life Sciences › Biochemistry, Genetics and Molecular Biology › Cell Biology › Autophagy in Disease and Therapy
- Keywords
- microglia, alpha-synuclein, selective autophagy, TLR4, NF-κB signaling, p62, neurodegeneration, dopaminergic neuron loss, neuroprotection, autophagy receptors, Parkinson's disease
- MeSH terms
- Animals, Autoantigens, Autophagy, Brain, Disease Models, Animal, Female, Humans, Mesencephalon, Mice, Inbred C57BL, Signal Transduction, NF-kappa B, Microglia, Mice, Knockout, Neurodegenerative Diseases, Toll-Like Receptor 4, Mice, alpha-Synuclein, HEK293 Cells, Dopaminergic Neurons
About these checks
Registry, retraction, Cites and statistics results are computed, not judged, with one exception: a printed reference that no index lists is read once by a model before it counts as a citation error. Claims are extracted by a model and kept only when their quote appears verbatim in the text; each cited source is then checked, with a model’s help, for whether it says what the claim relies on. Those verdicts can be wrong — read the claim’s quote and the cited source before relying on one.
A language model drew the claims from the paper on 2026-10-15, under version 3 of the claim definition (model deepseek-v4.1-flash, prompt extract-v3).
A second model labelled each claim on 2026-10-15 (model jev-1.13-20260917, definition revision gold-guideline-v0.2).
Cited sources are checked with a language model’s help (gpt-6-sol).
Statistics and arithmetic are recomputed, not judged.
Confidence bands are shown only for fields calibrated on our annotated test set. None is calibrated yet, so no band is shown.
What counts as a claim ›How we measure confidence ›How we check this ›
Are you an author, or do you see a problem with this page? Request a review
