

The DOI matches its Crossref record; 61 of the 61 references it cites were found in a registry or an index.
Dynamics of the 4D genome during in vivo lineage specification and differentiation
Open accessPublished version of a preprint
Abstract
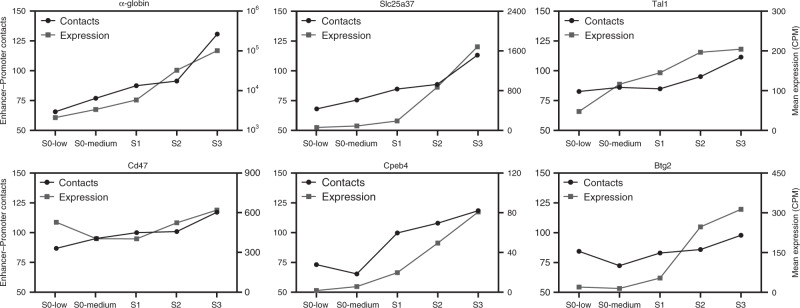
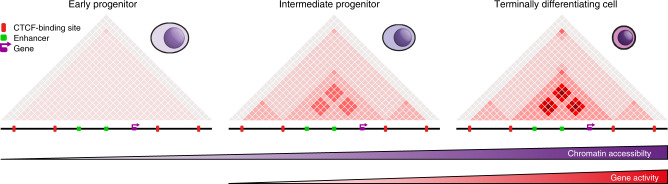
Mammalian gene expression patterns are controlled by regulatory elements, which interact within topologically associating domains (TADs). The relationship between activation of regulatory elements, formation of structural chromatin interactions and gene expression during development is unclear. Here, we present Tiled-C, a low-input chromosome conformation capture (3C) technique. We use this approach to study chromatin architecture at high spatial and temporal resolution through in vivo mouse erythroid differentiation. Integrated analysis of chromatin accessibility and single-cell expression data shows that regulatory elements gradually become accessible within pre-existing TADs during early differentiation. This is followed by structural re-organization within the TAD and formation of specific contacts between enhancers and promoters. Our high-resolution data show that these enhancer-promoter interactions are not established prior to gene expression, but formed gradually during differentiation, concomitant with progressive upregulation of gene activity. Together, these results provide new insight into the close, interdependent relationship between chromatin architecture and gene regulation during development.
Overview
The claims and statistics of this paper haven’t been checked yet.
Run the check — free, no account needed. It reads the open-access text and checks the sources it cites.
Integrity signals
Registry
Cites
Statistics
Figures
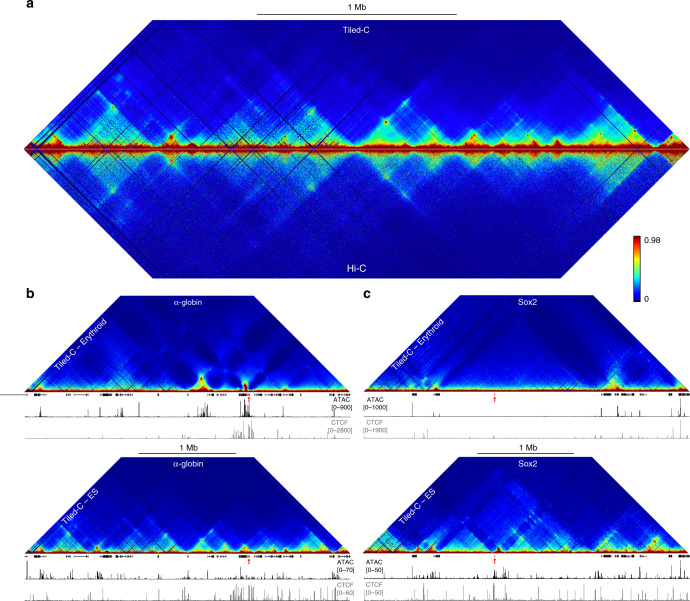
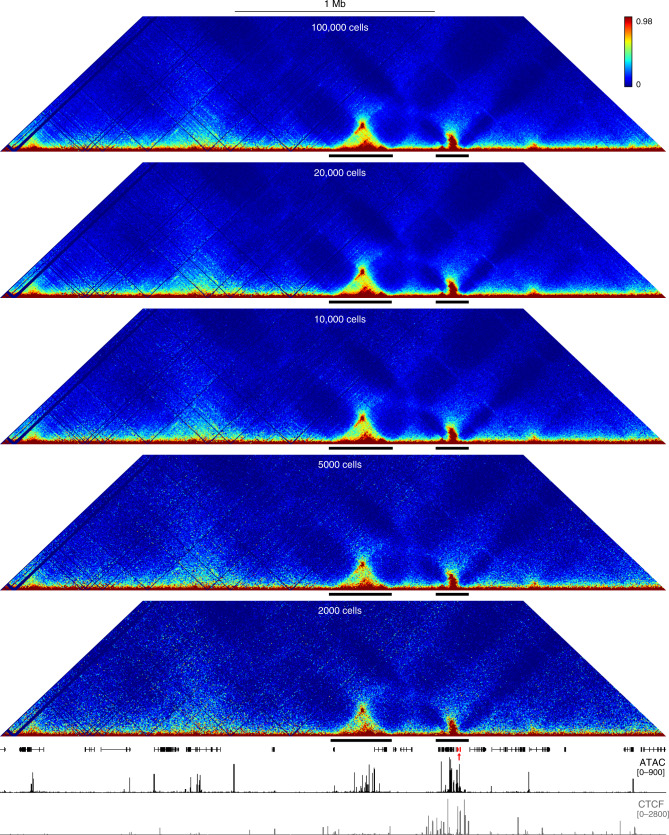
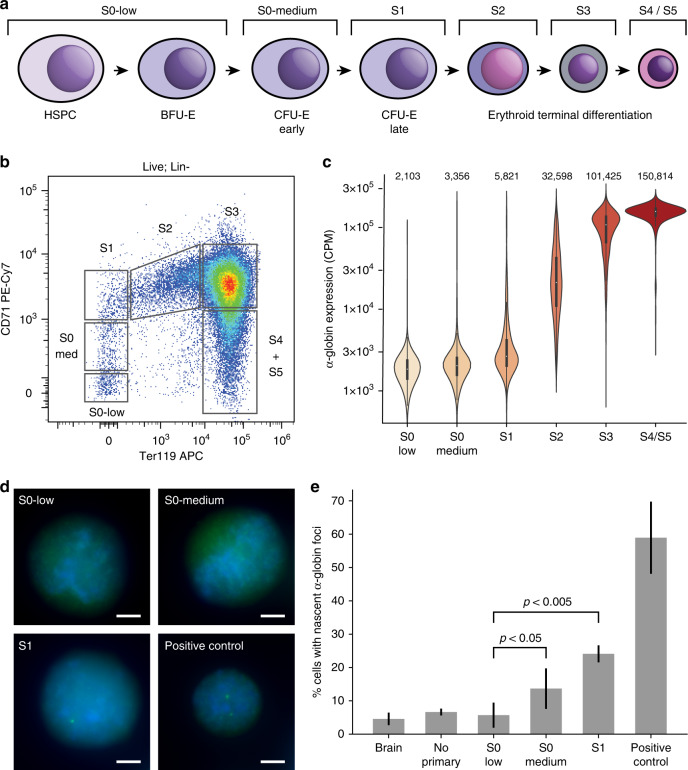
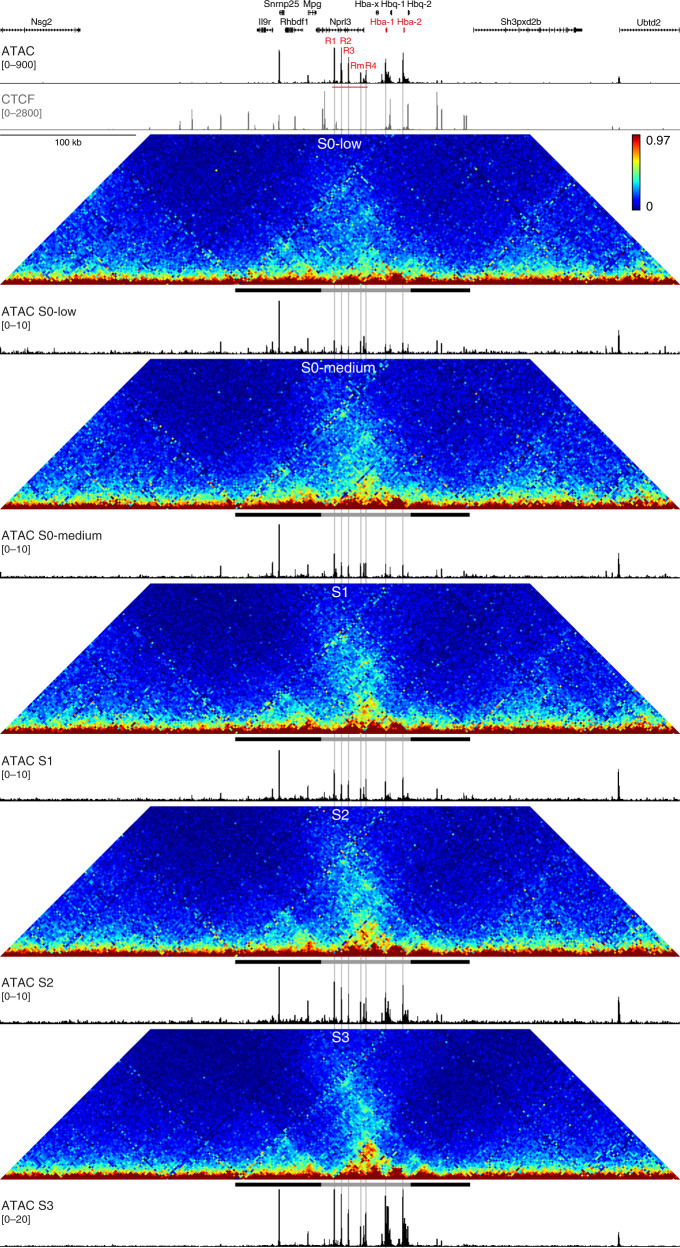
Verification
Claims the paper makes
The claims and statistics of this paper haven’t been checked yet.
Run the check — free, no account needed. It reads the open-access text and checks the sources it cites.
Claims other papers make about this one
Each is checked against this paper’s own text: does it say what the citing paper says it does?
The cited source says what the claim attributes to it.
In the citing paper
“Tiled-C, a high-resolution Chromosome Conformation Capture (3C) method that produces contact matrices of selected regions of interest was conducted as previously described.41”
From Super-enhancers include classical enhancers and facilitators to fully activate gene expression (2023) · cites this paper as [41]
The cited source says what the claim attributes to it.
In the citing paper
“In mammalian differentiation models, in contrast, extensive remodelling of enhancer–promoter contacts is typically observed consistently with enhancer activation [141, 394–397].”
From Transcriptional enhancers and their communication with gene promoters (2021) · cites this paper as [396]
Self-check
Percentages, sums and reported differences re-computed from the paper’s own numbers.
The self-check needs the paper’s full text.
Citations
Cites
BEDTools: a flexible suite of utilities for comparing genomic features
Quinlan, A. R., & Hall, I. M. (2010) · Bioinformatics · doi:10.1093/bioinformatics/btq033 · Cited by 27,437
Model-based Analysis of ChIP-Seq (MACS)
Zhang, Y., Liu, T., Meyer, C. A., Eeckhoute, J., Johnson, D. S., Bernstein, B. E., Nusbaum, C., Myers, R. M., Brown, M., Li, W., et al. (2008) · Genome Biology · doi:10.1186/gb-2008-9-9-r137 · Cited by 18,386
Comprehensive Mapping of Long-Range Interactions Reveals Folding Principles of the Human Genome
Lieberman-Aiden, E., van Berkum, N. L., Williams, L., Imakaev, M., Ragoczy, T., Telling, A., Amit, I., Lajoie, B. R., Sabo, P. J., Dorschner, M. O., et al. (2009) · Science · doi:10.1126/science.1181369 · Cited by 8,898
Buenrostro, J. D., Giresi, P. G., Zaba, L. C., Chang, H. Y., & Greenleaf, W. J. (2013) · Nature Methods · doi:10.1038/nmeth.2688 · Cited by 6,422
Capturing Chromosome Conformation
Dekker, J., Rippe, K., Dekker, M., & Kleckner, N. (2002) · Science · doi:10.1126/science.1067799 · Cited by 3,652
Simultaneous epitope and transcriptome measurement in single cells
Stoeckius, M., Hafemeister, C., Stephenson, W., Houck-Loomis, B., Chattopadhyay, P. K., Swerdlow, H., Satija, R., & Smibert, P. (2017) · Nature Methods · doi:10.1038/nmeth.4380 · Cited by 3,098
Scrublet: computational identification of cell doublets in single-cell transcriptomic data
Wolock, S. L., Lopez, R., & Klein, A. M. (2018) · doi:10.1101/357368 · Cited by 2,758
Scrublet: computational identification of cell doublets in single-cell transcriptomic data
Wolock, S. L., Lopez, R., & Klein, A. M. (2019) · Cell Systems · doi:10.1016/j.cels.2018.11.005 · Cited by 2,758
HiC-Pro: an optimized and flexible pipeline for Hi-C data processing.
Servant, N., Varoquaux, N., Lajoie, B. R., Viara, E., Chen, C.-J., Vert, J.-P., Heard, E., Dekker, J., & Barillot, E. (2015) · Genome Biology · doi:10.1186/s13059-015-0831-x · Cited by 2,565
HiGlass: web-based visual exploration and analysis of genome interaction maps
Kerpedjiev, P., Abdennur, N. A., Lekschas, F., McCallum, C., Dinkla, K., Strobelt, H., Luber, J. M., Ouellette, S., Azhir, A., Kumar, N., et al. (2018) · Genome biology · doi:10.1186/s13059-018-1486-1 · Cited by 2,430
Cited by
Sorted by citations
The relationship between genome structure and function
Oudelaar, A. M., & Higgs, D. R. (2021) · Nature Reviews Genetics · doi:10.1038/s41576-020-00303-x · Cited by 304
Self-citationRegion Capture Micro-C reveals coalescence of enhancers and promoters into nested microcompartments
Goel, V. Y., Huseyin, M. K., & Hansen, A. S. (2023) · Nature Genetics · doi:10.1038/s41588-023-01391-1 · Cited by 271
DeepC: predicting 3D genome folding using megabase-scale transfer learning
Schweßinger, R., Gosden, M. E., Downes, D. J., Brown, R. C., Oudelaar, A. M., Telenius, J. M., Teh, Y. W., Lunter, G. A., & Hughes, J. R. (2020) · Nature Methods · doi:10.1038/s41592-020-0960-3 · Cited by 223
Self-citationSuper-enhancers include classical enhancers and facilitators to fully activate gene expression
Blayney, J. W., Francis, H., Rampasekova, A., Camellato, B., Mitchell, L., Stolper, R., Cornell, L., Babbs, C., Boeke, J. D., Higgs, D. R., et al. (2023) · Cell · doi:10.1016/j.cell.2023.11.030 · Cited by 196
Self-citationLinking genome structures to functions by simultaneous single-cell Hi-C and RNA-seq
Liu, Z., Chen, Y., Xia, Q., Liu, M., Xu, H., Chi, Y., Deng, Y., & Xing, D. (2023) · Science · doi:10.1126/science.adg3797 · Cited by 174
Metadata
- Authors
- Oudelaar, A. M., Beagrie, R. A., Gosden, M., de Ornellas, S., Georgiades, E., Kerry, J., Hidalgo, D., Carrelha, J., Shivalingam, A., El-Sagheer, A. H., Telenius, J. M., Brown, T., Buckle, V. J., Socolovsky, M., Higgs, D. R., & Hughes, J. R.
- Affiliations
- University of Oxford (GB)
- University of Massachusetts Chan Medical School (US)
- Suez University (EG)
- Corresponding author
- Higgs, Douglas R.
- Hughes, Jim R.
- ORCID
- Venue
- Nature Communications
- Published
- 2020-06-01
- Volume
- 11
- Issue
- 1
- Pages
- 2722-2722
- ISSN
- 2041-1723 (ISSN-L)
- PMC
- PMC7264236
- OpenAlex
- W3030892594
- Cited by
- 119
- References
- 61
- Citations by year
- 2026: 9 · 2025: 20 · 2024: 19 · 2023: 20 · 2022: 17 · 2021: 20 · 2020: 14
- FWCI
- 5.76
- Type
- journal article
- Language
- en
- Open access
- gold
- doi.org
- Locations
- Nature Communications (publishedVersion, cc-by)
- bioRxiv (Cold Spring Harbor Laboratory) (acceptedVersion)
- PubMed Central (publishedVersion, cc-by)
- PubMed (publishedVersion)
- The Journal of the American Medical Association (JAMA) Network (American Medical Association) (submittedVersion, cc-by)
- RePEc: Research Papers in Economics (submittedVersion)
- DOAJ (DOAJ: Directory of Open Access Journals) (submittedVersion, cc-by-sa)
- MPG.PuRe (Max Planck Society) (submittedVersion, other-oa)
- Funders
- RCUK | Medical Research Council
- Wellcome Trust
- Topics
- Life Sciences › Biochemistry, Genetics and Molecular Biology › Molecular Biology › Genomics and Chromatin Dynamics
- Life Sciences › Biochemistry, Genetics and Molecular Biology › Molecular Biology › Chromatin Remodeling and Cancer
- Life Sciences › Biochemistry, Genetics and Molecular Biology › Genetics › Chromosomal and Genetic Variations
- Keywords
- topologically associating domains, chromatin structure, enhancer-promoter interactions, erythroid differentiation, lineage specification, chromatin accessibility, chromosome conformation capture, regulatory elements, single-cell gene expression, mouse embryo
- MeSH terms
- Mouse Embryonic Stem Cells, Animals, Cell Differentiation, Cells, Cultured, Chromatin, Enhancer Elements, Genetic, Female, Hematopoietic Stem Cells, Mice, Inbred C57BL, Promoter Regions, Genetic, Stem Cells, Genome, Gene Expression Regulation, Developmental, Gene Expression Profiling, Chromosomes, Mammalian, Mice
About these checks
Registry, retraction, Cites and statistics results are computed, not judged, with one exception: a printed reference that no index lists is read once by a model before it counts as a citation error. Claims are extracted by a model and kept only when their quote appears verbatim in the text; each cited source is then checked, with a model’s help, for whether it says what the claim relies on. Those verdicts can be wrong — read the claim’s quote and the cited source before relying on one.
Statistics and arithmetic are recomputed, not judged.
Confidence bands are shown only for fields calibrated on our annotated test set. None is calibrated yet, so no band is shown.
What counts as a claim ›How we measure confidence ›How we check this ›
Are you an author, or do you see a problem with this page? Request a review
