

The DOI matches its Crossref record; 73 of the 73 references it cites were found in a registry or an index.
Turn-on chemiluminescence probes and dual-amplification of signal for detection of amyloid beta species in vivo
Open accessPublished version of a preprint
Abstract
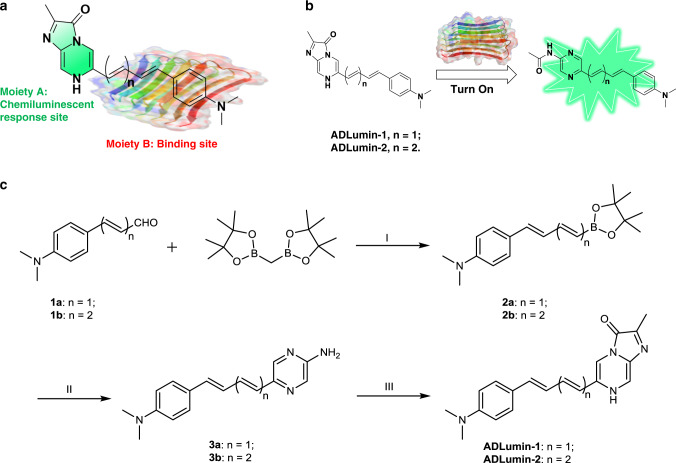
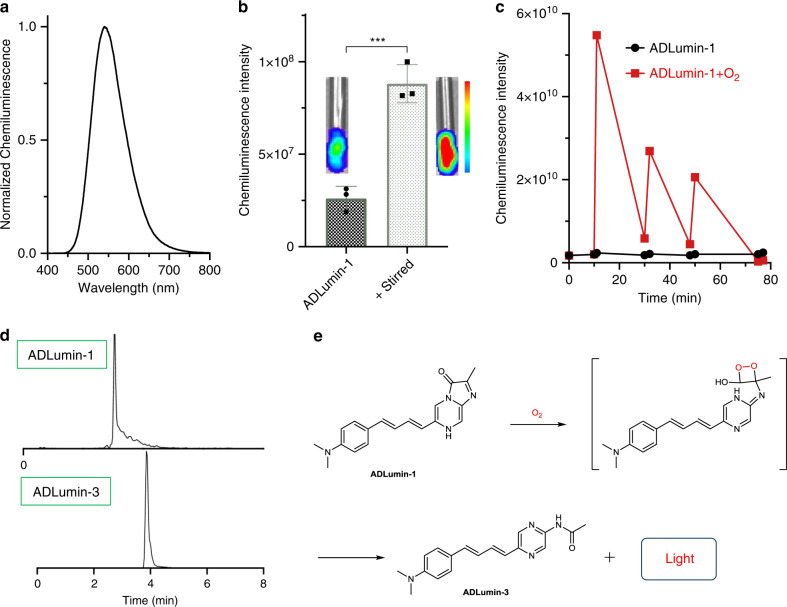
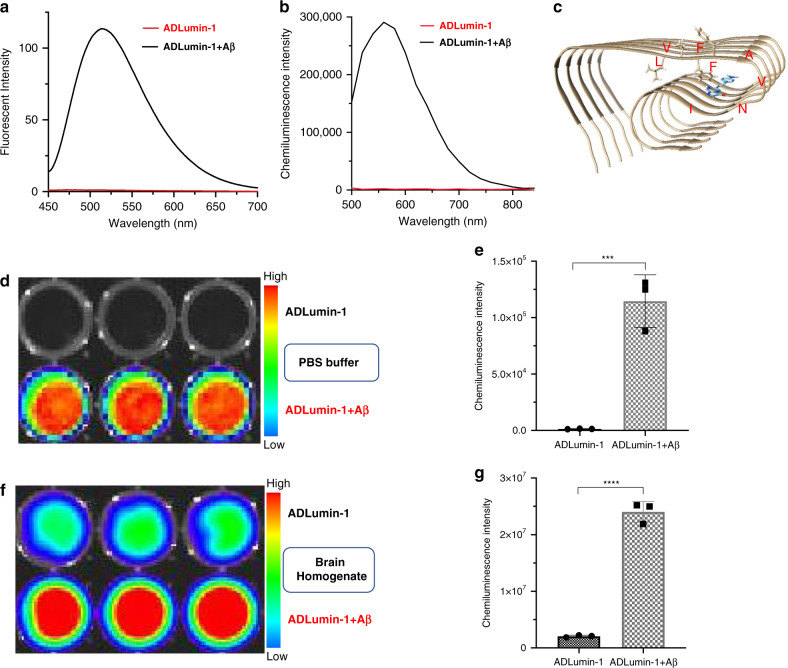
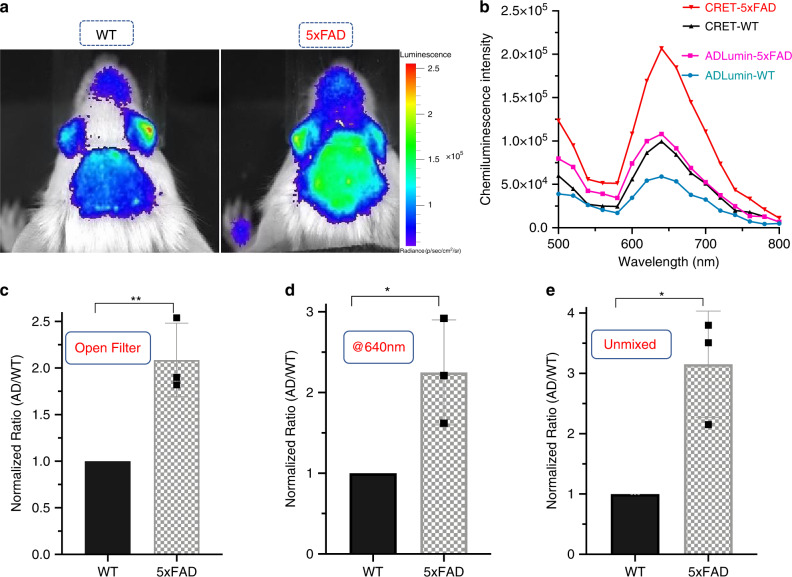
Turn-on fluorescence imaging is routinely studied; however, turn-on chemiluminescence has been rarely explored for in vivo imaging. Herein, we report the design and validation of chemiluminescence probe ADLumin-1 as a turn-on probe for amyloid beta (Aβ) species. Two-photon imaging indicates that ADLumin-1 can efficiently cross the blood–brain barrier and provides excellent contrast for Aβ plaques and cerebral amyloid angiopathy. In vivo brain imaging shows that the chemiluminescence signal of ADLumin-1 from 5-month-old transgenic 5xFAD mice is 1.80-fold higher than that from the age-matched wild-type mice. Moreover, we demonstrate that it is feasible to further d ually- a mplify s ignal via c hemiluminescence r esonance e nergy t ransfer (DAS-CRET) using two non-conjugated smart probes (ADLumin-1 and CRANAD-3) in solutions, brain homogenates, and in vivo whole brain imaging. Our results show that DAS-CRET can provide a 2.25-fold margin between 5-month-old 5xFAD mice and wild type mice. We believe that our strategy could be extended to other aggregating-prone proteins.
Overview
The claims and statistics of this paper haven’t been checked yet.
Run the check — free, no account needed. It reads the open-access text and checks the sources it cites.
Integrity signals
Registry
Cites
Statistics
Figures
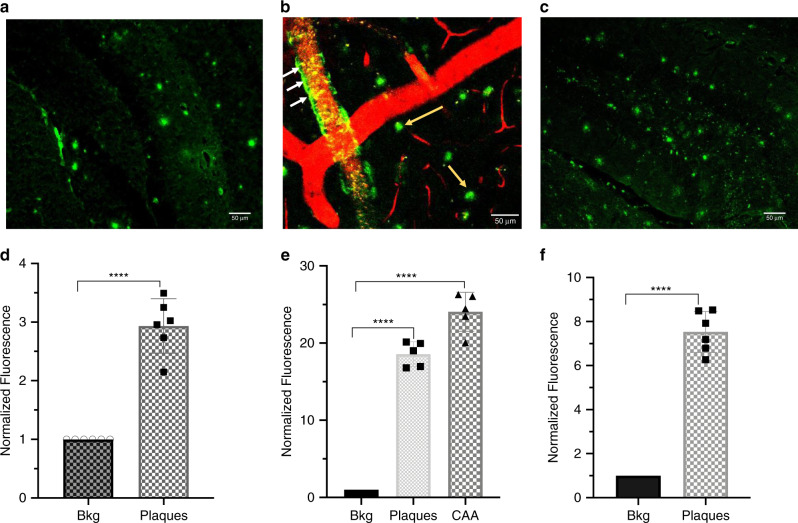
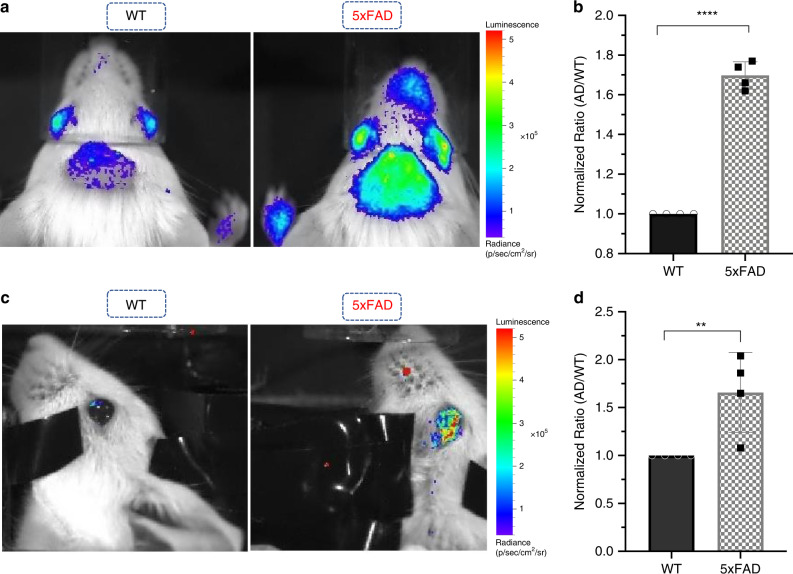
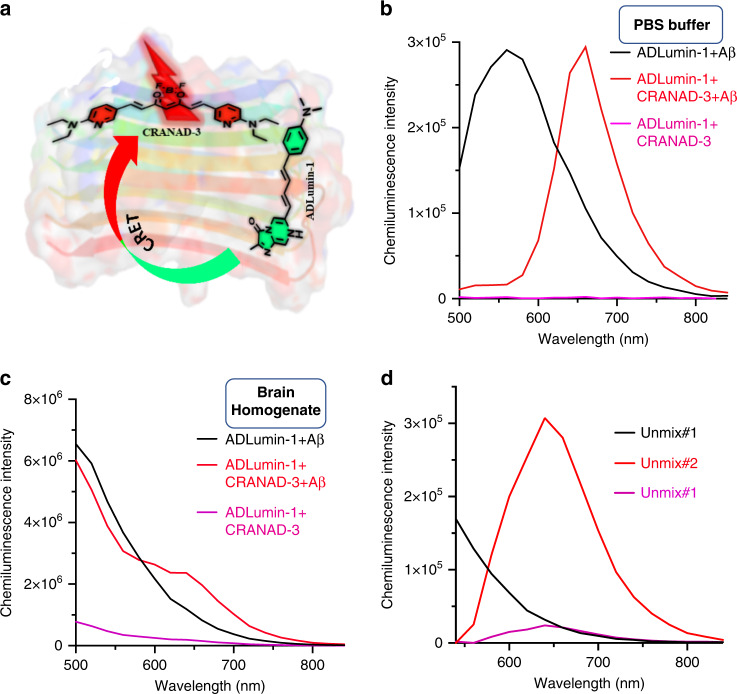
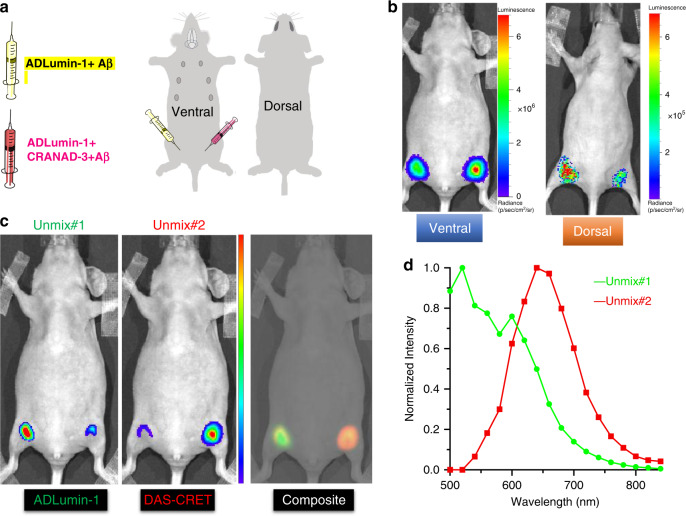
Verification
Claims the paper makes
The claims and statistics of this paper haven’t been checked yet.
Run the check — free, no account needed. It reads the open-access text and checks the sources it cites.
Claims other papers make about this one
Each is checked against this paper’s own text: does it say what the citing paper says it does?
The source backs part of the claim, not all of it — or backs it for a different population, condition or comparison.
In the citing paper
“Cinnamic derivatives can cross the BBB and insert into the beta sheet of amyloid β proteins41.”
From Blood–brain-barrier-crossing lipid nanoparticles for mRNA delivery to the central nervous system (2025) · cites this paper as [41]
Experimental — accuracy not yet measured
Self-check
Percentages, sums and reported differences re-computed from the paper’s own numbers.
The self-check needs the paper’s full text.
Citations
Cites
Principles of Fluorescence Spectroscopy
Lakowicz, J. R. (1999) · Springer eBooks · doi:10.1007/978-1-4757-3061-6 · Cited by 26,948
Grabowski, Z. R., Rotkiewicz, K., & Rettig, W. (2003) · Chemical Reviews · doi:10.1021/cr940745l · Cited by 3,714
Oakley, H., Cole, S. L., Logan, S., Maus, E., Shao, P., Craft, J., Guillozet-Bongaarts, A., Ohno, M., Disterhoft, J., Van Eldik, L., et al. (2006) · The Journal of Neuroscience · doi:10.1523/jneurosci.1202-06.2006 · Cited by 3,530
New Strategies for Fluorescent Probe Design in Medical Diagnostic Imaging
Kobayashi, H., Ogawa, M., Alford, R. E., Choyke, P. L., & Urano, Y. (2009) · Chemical Reviews · doi:10.1021/cr900263j · Cited by 2,205
Molecular imaging in living subjects: seeing fundamental biological processes in a new lightPreprint
Massoud, T. F., & Gambhir, S. S. (2003) · Genes & Development · doi:10.1101/gad.1047403 · Cited by 2,205
Sapsford, K. E., Berti, L., & Medintz, I. L. (2006) · Angewandte Chemie International Edition · doi:10.1002/anie.200503873 · Cited by 1,563
Molecular afterglow imaging with bright, biodegradable polymer nanoparticles
Miao, Q., Xie, C., Xu, Z. J., Lyu, Y., Duan, H., Liu, X., Jokerst, J. V., & Pu, K. (2017) · Nature Biotechnology · doi:10.1038/nbt.3987 · Cited by 980
Fluorescence imaging in vivo: recent advances
Rao, J., Dragulescu‐Andrasi, A., & Yao, H. (2007) · Current Opinion in Biotechnology · doi:10.1016/j.copbio.2007.01.003 · Cited by 780
Fluorescent probes for sensing and imaging
Ueno, T., & Nagano, T. (2011) · Nature Methods · doi:10.1038/nmeth.1663 · Cited by 634
Alzheimer's Disease: From Pathology to Therapeutic Approaches
Jakob‐Roetne, R., & Jacobsen, H. (2009) · Angewandte Chemie International Edition · doi:10.1002/anie.200802808 · Cited by 626
Shuhendler, A. J., Pu, K., Cui, L., Uetrecht, J., & Rao, J. (2014) · Nature Biotechnology · doi:10.1038/nbt.2838 · Cited by 622
In vivo imaging of hydrogen peroxide with chemiluminescent nanoparticles
Lee, D., Khaja, S. D., Velasquez-Castano, J. C., Dasari, M., Sun, C. Q., Petros, J. A., Taylor, W. R., & Murthy, N. (2007) · Nature Materials · doi:10.1038/nmat1983 · Cited by 547
Resolving controversies on the path to Alzheimer's therapeutics
Selkoe, D. J. (2011) · Nature Medicine · doi:10.1038/nm.2460 · Cited by 494
Ran, C., Xu, X., Raymond, S. B., Ferrara, B. J., Neal, K. L., Bacskai, B. J., Medarova, Z. O., & Moore, A. V. (2009) · Journal of the American Chemical Society · doi:10.1021/ja9047043 · Cited by 486
Self-citationFu, W., Yan, C., Guo, Z., Zhang, J., Zhang, H., Tian, H., & Zhu, W. (2019) · Journal of the American Chemical Society · doi:10.1021/jacs.8b12820 · Cited by 448
Preclinical Properties of 18F-AV-45: A PET Agent for Aβ Plaques in the Brain
Choi, S., Golding, G., Zhuang, Z., Zhang, W., Lim, N. C., Hefti, F. F., Benedum, T. E., Kilbourn, M. R., Skovronsky, D., & Kung, H. F. (2009) · Journal of Nuclear Medicine · doi:10.2967/jnumed.109.065284 · Cited by 431
Zhang, X., Tian, Y., Zeng, L., Tian, X., Sun, H., Liu, H., Moore, A. V., & Ran, C. (2013) · Journal of the American Chemical Society · doi:10.1021/ja405239v · Cited by 354
Self-citationBiotechnological applications of bioluminescence and chemiluminescence
Roda, A. (2004) · Trends in biotechnology · doi:10.1016/j.tibtech.2004.03.011 · Cited by 347
In vivo detection of amyloid-β deposits by near-infrared imaging using an oxazine-derivative probe
Hintersteiner, M., Enz, A., Frey, P., Jaton, A.-L., Kinzy, W., Kneuer, R., Neumann, U., Rudin, M., Staufenbiel, M., Stoeckli, M., et al. (2005) · Nature Biotechnology · doi:10.1038/nbt1085 · Cited by 344
19F and 1H MRI detection of amyloid β plaques in vivo
Higuchi, M., Iwata, N., Matsuba, Y., Sato, K., Sasamoto, K., & Saido, T. C. (2005) · Nature Neuroscience · doi:10.1038/nn1422 · Cited by 339
In Vivo Optical Imaging of Amyloid Aggregates in Brain: Design of Fluorescent Markers
Nesterov, E. E., Skoch, J. M., Hyman, B. T., Klunk, W. E., Bacskai, B. J., & Swager, T. M. (2005) · Angewandte Chemie International Edition · doi:10.1002/anie.200500845 · Cited by 339
Luminol and lucigenin as detectors for O2ṡ−
Faulkner, K. M., & Fridovich, I. (1993) · Free Radical Biology and Medicine · doi:10.1016/0891-5849(93)90044-u · Cited by 336
Cui, M., Ono, M., Watanabe, H., Kimura, H., Liu, B., & Saji, H. (2014) · Journal of the American Chemical Society · doi:10.1021/ja4052922 · Cited by 283
Near-Infrared Dioxetane Luminophores with Direct Chemiluminescence Emission Mode
Green, O., Gnaim, S., Blau, R., Eldar‐Boock, A., Satchi‐Fainaro, R., & Shabat, D. (2017) · Journal of the American Chemical Society · doi:10.1021/jacs.7b08446 · Cited by 277
Detection of Alzheimer's amyloid in transgenic mice using magnetic resonance microimaging
Wadghiri, Y. Z., Sigurdsson, E. M., Sadowski, M. J., Elliott, J. I., Li, Y., Scholtzova, H., Tang, C. Y., Aguinaldo, G., Pappolla, M. A., Duff, K., et al. (2003) · Magnetic Resonance in Medicine · doi:10.1002/mrm.10529 · Cited by 273
Baumes, J. M., Gassensmith, J. J., Giblin, J., Lee, J., White, A. G., Lu-Culligan, W. J., Leevy, W. M., Kuno, M. K., & Smith, B. D. (2010) · Nature Chemistry · doi:10.1038/nchem.871 · Cited by 273
Huang, X., Li, L., Qian, H., Dong, C., & Ren, J. (2006) · Angewandte Chemie International Edition · doi:10.1002/anie.200601196 · Cited by 263
Zhang, X., Tian, Y., Zhang, C. M., Tian, X., Ross, A., Moir, R. D., Sun, H., Tanzi, R. E., Moore, A. V., & Ran, C. (2015) · Proceedings of the National Academy of Sciences · doi:10.1073/pnas.1505420112 · Cited by 228
Self-citationHananya, N., & Shabat, D. (2019) · ACS Central Science · doi:10.1021/acscentsci.9b00372 · Cited by 216
Olfactory epithelium amyloid‐β and paired helical filament‐tau pathology in Alzheimer disease
Arnold, S. E., Lee, E. B., Moberg, P. J., Stutzbach, L., Kazi, H., Han, L., Lee, V. M. ‐., & Trojanowski, J. Q. (2009) · Annals of Neurology · doi:10.1002/ana.21910 · Cited by 215
Barondeau, D. P., Putnam, C. D., Kassmann, C. J., Tainer, J. A., & Getzoff, E. D. (2003) · Proceedings of the National Academy of Sciences · doi:10.1073/pnas.2133463100 · Cited by 215
In vivo detection of amyloid plaques in a mouse model of Alzheimer's disease
Skovronsky, D., Zhang, B., Kung, M., Kung, H. F., Trojanowski, J. Q., & Lee, V. M. ‐. (2000) · Proceedings of the National Academy of Sciences · doi:10.1073/pnas.97.13.7609 · Cited by 212
Chemical Fluorescent Probe for Detection of Aβ Oligomers
Teoh, C. L., Su, D., Sahu, S., Yun, S., Drummond, E., Prelli, F. C., Lim, S., Cho, S., Ham, S., Wısnıewskı, T., et al. (2015) · Journal of the American Chemical Society · doi:10.1021/jacs.5b06190 · Cited by 212
An ESIPT Probe for the Ratiometric Imaging of Peroxynitrite Facilitated by Binding to Aβ-Aggregates
Sedgwick, A. C., Dou, W., Jiao, J., Wu, L., Williams, G. T., Jenkins, A. T. A., Bull, S. D., Sessler, J. L., He, X., & James, T. D. (2018) · Journal of the American Chemical Society · doi:10.1021/jacs.8b08457 · Cited by 205
Hananya, N., & Shabat, D. (2017) · Angewandte Chemie International Edition · doi:10.1002/anie.201706969 · Cited by 191
A Craniotomy Surgery Procedure for Chronic Brain Imaging
Mostany, R., & Portera‐Cailliau, C. (2008) · Journal of Visualized Experiments · doi:10.3791/680 · Cited by 182
Li, P., Liu, L., Xiao, H., Zhang, W., Wang, L., & Tang, B. (2016) · Journal of the American Chemical Society · doi:10.1021/jacs.5b11784 · Cited by 176
Gandhi, J., Antonelli, A. C., Afridi, A., Vatsia, S. K., Joshi, G. S., Romanov, V., Murray, I. V. J., & Khan, S. A. (2019) · Reviews in the Neurosciences · doi:10.1515/revneuro-2016-0035 · Cited by 171
BODIPY-Based Molecular Probe for Imaging of Cerebral β-Amyloid Plaques
Ono, M., Watanabe, H., Kimura, H., & Saji, H. (2012) · ACS Chemical Neuroscience · doi:10.1021/cn3000058 · Cited by 164
Chemiluminescent Probe for the In Vitro and In Vivo Imaging of Cancers Over‐Expressing NQO1
Son, S., Won, M., Green, O., Hananya, N., Sharma, A. K., Jeon, Y., Kwak, J. H., Sessler, J. L., Shabat, D., & Kim, J. S. (2018) · Angewandte Chemie International Edition · doi:10.1002/anie.201813032 · Cited by 154
Zhang, N., Francis, K. P., Prakash, A., & Ansaldi, D. (2013) · Nature Medicine · doi:10.1038/nm.3110 · Cited by 144
Solid‐Phase Synthesis of Styryl Dyes and their Application as Amyloid Sensors
Li, Q., Lee, J., Ha, C., Park, C. B., Yang, G., Gan, W. B., & Chang, Y. (2004) · Angewandte Chemie International Edition · doi:10.1002/anie.200461600 · Cited by 142
Zhao, H. F., Doyle, T. C., Wong, R. J., Cao, Y., Stevenson, D. K., Piwnica-Worms, D. R., & Contag, C. H. (2004) · Molecular Imaging · doi:10.1162/153535004773861714 · Cited by 123
Roth, M. E., Green, O., Hupfeld, M., Fieseler, L., Heinrich, N., Ihssen, J., Vorberg, R., Wick, L., Spitz, U. P., & Shabat, D. (2019) · Angewandte Chemie International Edition · doi:10.1002/anie.201904719 · Cited by 120
Shin, J. W., Verwilst, P., Choi, H., Kang, S., Han, J., Kim, N. H., Choi, J. G., Oh, M. S., Hwang, J. S., Kim, D., et al. (2019) · Angewandte Chemie International Edition · doi:10.1002/anie.201900549 · Cited by 100
Lv, G., Sun, A., Wei, P., Zhang, N., Lan, H., & Yi, T. (2016) · Chemical Communications · doi:10.1039/c6cc02741e · Cited by 96
Cao, K., Farahi, M., Dakanali, M., Chang, W. M., Sigurdson, C. J., Theodorakis, E. A., & Yang, J. (2012) · Journal of the American Chemical Society · doi:10.1021/ja3063698 · Cited by 94
Self-citationLuminescence of imidazo[1,2-a]pyrazin-3(7H)-one compounds
Teranishi, K. (2006) · Bioorganic Chemistry · doi:10.1016/j.bioorg.2006.08.003 · Cited by 91
ANCA: A Family of Fluorescent Probes that Bind and Stain Amyloid Plaques in Human Tissue
Chang, W. M., Dakanali, M., Capule, C. C., Sigurdson, C. J., Yang, J., & Theodorakis, E. A. (2011) · ACS Chemical Neuroscience · doi:10.1021/cn200018v · Cited by 90
Self-citationBandara, N., Sharma, A. K., Krieger, S., Schultz, J. W., Han, B. H., Rogers, B. E., & Mirica, L. M. (2017) · Journal of the American Chemical Society · doi:10.1021/jacs.7b05937 · Cited by 82
Cui, M., Ono, M., Kimura, H., Liu, B., & Saji, H. (2011) · Journal of Medicinal Chemistry · doi:10.1021/jm101404k · Cited by 76
Zhou, K., Yuan, C., Dai, B., Wang, K., Chen, Y., Ma, D., Dai, J., Liang, Y., Tan, H., & Cui, M. (2019) · Journal of Medicinal Chemistry · doi:10.1021/acs.jmedchem.9b00672 · Cited by 73
Recent progress in expanding the chemiluminescent toolbox for bioimaging
Suzuki, K., & Nagai, T. (2017) · Current Opinion in Biotechnology · doi:10.1016/j.copbio.2017.04.001 · Cited by 60
Nordberg, A. K. (2011) · Alzheimer s Research & Therapy · doi:10.1186/alzrt96 · Cited by 58
Krzymiński, K., Ożóg, A., Malecha, P., Roshal, A. D., Wróblewska, A., Zadykowicz, B., & Błażejowski, J. (2011) · The Journal of Organic Chemistry · doi:10.1021/jo1020882 · Cited by 56
From Companion Diagnostics to Theranostics: A New Avenue for Alzheimer’s Disease?
Bolognesi, M. L., Gandini, A., Prati, F., & Uliassi, E. (2016) · Journal of Medicinal Chemistry · doi:10.1021/acs.jmedchem.6b00151 · Cited by 54
Ran, C., Zhao, W., Moir, R. D., & Moore, A. V. (2011) · PLoS ONE · doi:10.1371/journal.pone.0019362 · Cited by 49
Self-citationDetection of Hydrogen Peroxide in vitro and in vivo Using Peroxalate Chemiluminescent Micelles
Lee, I., Hwang, O., Yoo, D., Khang, G., & Lee, D. (2011) · Bulletin of the Korean Chemical Society · doi:10.5012/bkcs.2011.32.7.2187 · Cited by 44
Ran, C., & Moore, A. V. (2011) · Molecular Imaging and Biology · doi:10.1007/s11307-011-0501-7 · Cited by 42
Self-citationMaeztu, R., Tardajos, G., & González‐Gaitano, G. (2010) · The Journal of Physical Chemistry B · doi:10.1021/jp909707x · Cited by 41
Chemiluminescence Imaging of Superoxide Anion Detects Beta-Cell Function and Mass
Bronsart, L. L., Stokes, C., & Contag, C. H. (2016) · PLoS ONE · doi:10.1371/journal.pone.0146601 · Cited by 38
Near-infrared Fluorescence Ocular Imaging (NIRFOI) of Alzheimer’s Disease
Yang, J., Yang, J., Li, Y., Xu, Y., & Ran, C. (2018) · Molecular Imaging and Biology · doi:10.1007/s11307-018-1213-z · Cited by 38
Self-citationAmyloid beta in nasal secretions may be a potential biomarker of Alzheimer’s disease
Kim, Y. H., Lee, S.-M., Cho, S., Kang, J., Minn, Y., Park, H., & Choi, S. H. (2019) · Scientific Reports · doi:10.1038/s41598-019-41429-1 · Cited by 37
Rice, B. W., & Contag, C. H. (2009) · Nature Biotechnology · doi:10.1038/nbt0709-624 · Cited by 36
Zhao, H. F., Doyle, T. C., Wong, R. J., Cao, Y., Stevenson, D. K., Piwnica-Worms, D. R., & Contag, C. H. (2004) · Molecular Imaging · doi:10.1162/15353500200403181 · Cited by 33
Translational opportunities for amyloid-targeting fluorophores
Cao, K., & Yang, J. (2018) · Chemical Communications · doi:10.1039/c8cc03619e · Cited by 32
Self-citationSpectral Unmixing: Analysis of Performance in the Olfactory Bulb In Vivo
Ducros, M. G., Moreaux, L. C., Bradley, J., Tiret, P., Griesbeck, O., & Charpak, S. (2009) · PLoS ONE · doi:10.1371/journal.pone.0004418 · Cited by 31
Rotamer-Restricted Fluorogenicity of the Bis-Arsenical ReAsH
Walker, A. S., Rablen, P. R., & Schepartz, A. (2016) · Journal of the American Chemical Society · doi:10.1021/jacs.6b03422 · Cited by 29
Dual Functional Small Molecule Probes as Fluorophore and Ligand for Misfolding Proteins
Zhang, X., & Ran, C. (2013) · Current Organic Chemistry · doi:10.2174/1385272811317060004 · Cited by 26
Self-citationA Causal Relation between Bioluminescence and Oxygen to Quantify the Cell Niche
Lambrechts, D., Roeffaers, M. B. J., Goossens, K., Hofkens, J., de Putte, T. V., Schrooten, J., & Oosterwyck, H. V. (2014) · PLoS ONE · doi:10.1371/journal.pone.0097572 · Cited by 24
In vivo detection of amyloid plaques in a mouse model of Alzheimer's disease
Skovronsky, D., Zhang, B., Kung, M., Kung, H. F., Trojanowski, J. Q., & Lee, V. M. ‐. (2000) · Neurobiology of Aging · doi:10.1016/s0197-4580(00)82140-5 · Cited by 12
Su, W., Du, M., Lin, F., Zhang, C., & Chen, T. (2018) · Journal of Biophotonics · doi:10.1002/jbio.201800314 · Cited by 7
Self-citationLambrechts, D., Roeffaers, M. B. J., Goossens, K., Hofkens, J., Velde, G. V., de Putte, T. V., Schrooten, J., & Oosterwyck, H. V. (2015) · Cited by 3
Cited by
Sorted by citations
Huang, J., Jiang, Y., Li, J., Huang, J., & Pu, K. (2020) · Angewandte Chemie International Edition · doi:10.1002/anie.202013531 · Cited by 197
Zheng, M., Wang, X., Yue, O., Hou, M., Zhang, H., Beyer, S., Blocki, A. M., Wang, Q., Gong, G., Liu, X., et al. (2021) · Biomaterials · doi:10.1016/j.biomaterials.2021.121026 · Cited by 176
Blood–brain-barrier-crossing lipid nanoparticles for mRNA delivery to the central nervous system
Wang, C., Xue, Y., Markovic, T., Li, H., Wang, S., Zhong, Y., Du, S., Zhang, Y., Hou, X., Yu, Y., et al. (2025) · Nature Materials · doi:10.1038/s41563-024-02114-5 · Cited by 171
“Cinnamic derivatives can cross the BBB and insert into the beta sheet of amyloid β proteins 41 .”
Hou, X. H., Gao, S., Li, Q., Kang, Y., Chen, N., Chen, K., Rao, J., Ellenberg, J. S., & Patz, J. A. (2021) · Proceedings of the National Academy of Sciences · doi:10.1073/pnas.2020524118 · Cited by 142
An Activatable NIR‐II Fluorescent Reporter for In Vivo Imaging of Amyloid‐β Plaques
Miao, J., Miao, M., Jiang, Y., Zhao, M., Li, Q., Zhang, Y., An, Y., Pu, K., & Miao, Q. (2022) · Angewandte Chemie International Edition · doi:10.1002/anie.202216351 · Cited by 119
Metadata
- Authors
- Yang, J., Yin, W., Van, R., Yin, K., Wang, P., Zheng, C., Zhu, B., Ran, K., Zhang, C., Kumar, M., Shao, Y., & Ran, C.
- Affiliations
- Harvard University (US)
- University of Oklahoma (US)
- Massachusetts Institute of Technology (US)
- Corresponding author
- Ran, Chongzhao
- ORCID
- Venue
- Nature Communications
- Published
- 2020-08-13
- Volume
- 11
- Issue
- 1
- Pages
- 4052-4052
- ISSN
- 2041-1723 (ISSN-L)
- PMC
- PMC7426431
- OpenAlex
- W3048903908
- Cited by
- 123
- References
- 73
- Citations by year
- 2026: 16 · 2025: 16 · 2024: 24 · 2023: 24 · 2022: 13 · 2021: 27 · 2020: 3
- FWCI
- 10.07
- Type
- journal article
- Language
- en
- Open access
- gold
- doi.org
- Locations
- Nature Communications (publishedVersion, cc-by)
- ChemRxiv (acceptedVersion, cc-by-nc-nd)
- PubMed Central (publishedVersion, cc-by)
- PubMed (publishedVersion)
- RePEc: Research Papers in Economics (submittedVersion)
- DOAJ (DOAJ: Directory of Open Access Journals) (submittedVersion, cc-by-sa)
- Figshare (submittedVersion, cc-by-nc-nd)
- Funders
- U.S. Department of Health & Human Services | NIH | National Institute on Aging (R21AG059134, R01AG055413)
- Topics
- Life Sciences › Neuroscience › Cellular and Molecular Neuroscience › Alzheimer's disease research and treatments
- Physical Sciences › Chemistry › Spectroscopy › Molecular Sensors and Ion Detection
- Physical Sciences › Materials Science › Materials Chemistry › Luminescence and Fluorescent Materials
- Keywords
- chemiluminescence probe, amyloid-beta detection, chemiluminescence resonance energy transfer, two-photon imaging, blood-brain barrier penetration, cerebral amyloid angiopathy, amyloid plaques, 5xFAD mice, in vivo brain imaging
- MeSH terms
- Animals, Luminescent Measurements, Amyloid beta-Peptides, Luminescence, Mice, Molecular Imaging, Optical Imaging, Protein Aggregates
About these checks
Registry, retraction, Cites and statistics results are computed, not judged, with one exception: a printed reference that no index lists is read once by a model before it counts as a citation error. Claims are extracted by a model and kept only when their quote appears verbatim in the text; each cited source is then checked, with a model’s help, for whether it says what the claim relies on. Those verdicts can be wrong — read the claim’s quote and the cited source before relying on one.
Statistics and arithmetic are recomputed, not judged.
Confidence bands are shown only for fields calibrated on our annotated test set. None is calibrated yet, so no band is shown.
What counts as a claim ›How we measure confidence ›How we check this ›
Are you an author, or do you see a problem with this page? Request a review
