Student or educator? Sign up with your school email and get 6 months of Pro free.
Cited by 94

The DOI matches its Crossref record; 5 of the 5 references it cites were found in a registry or an index.

RNA-binding proteins Musashi and tau soluble aggregates initiate nuclear dysfunction

Montalbano, Mauro, McAllen, Salome, Puangmalai, Nicha, Sengupta, Urmi, Bhatt, Nemil, Johnson, Omar D., Kharas, Michael G., Kayed, Rakez·2020·Nature Communications

Abstract

Oligomeric assemblies of tau and the RNA-binding proteins (RBPs) Musashi (MSI) are reported in Alzheimer’s disease (AD). However, the role of MSI and tau interaction in their aggregation process and its effects are nor clearly known in neurodegenerative diseases. Here, we investigated the expression and cellular localization of MSI1 and MSI2 in the brains tissues of Alzheimer’s disease (AD), amyotrophic lateral sclerosis (ALS) and frontotemporal dementia (FTD) as well as in the wild-type mice and tau knock-out and P301L tau mouse models. We observed that formation of pathologically relevant protein inclusions was driven by the aberrant interactions between MSI and tau in the nuclei associated with age-dependent extracellular depositions of tau/MSI complexes. Furthermore, tau and MSI interactions induced impairment of nuclear/cytoplasm transport, chromatin remodeling and nuclear lamina formation. Our findings provide mechanistic insight for pathological accumulation of MSI/tau aggregates providing a potential basis for therapeutic interventions in neurodegenerative proteinopathies.

Overview

The claims and statistics of this paper haven’t been checked yet.

Run the check — free, no account needed. It reads the open-access text and checks the sources it cites.

A few free checks a day · papers already verified open instantly · results are public

Integrity signals

Registry

Crossref · 10.1038/s41467-020-18022-6

Cites

5 of 5 references verified0 citation errors · 0 not checkable

Statistics

Figures

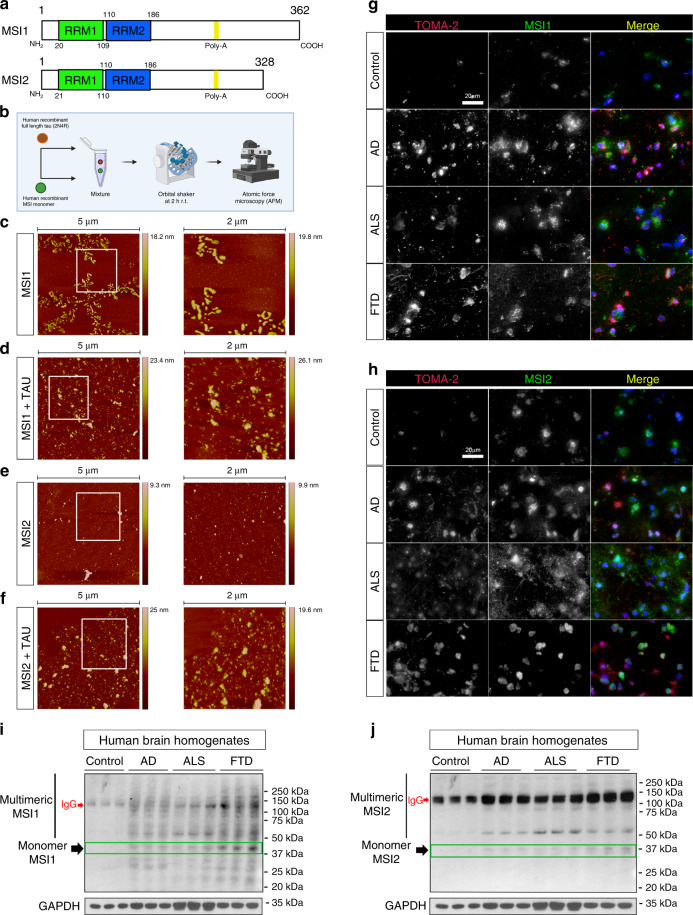
Fig. 1 MSI/tau aggregation in vitro and MSI proteins in AD, ALS, and FTD frontal cortex. a Schematic representation of MSI1 and MSI2 proteins (RRM; RNA Recognition Motif). b Diagram of experimental procedure to produce in vitro MSI and tau oligomers. c Representative 5 µm and 2 µm (white square in 5 µm image) AFM fields of MSI1 oligomers. d Representative 5 µm and 2 µm (white square in 5 µm image) AFM fields of MSI1/tau mixed oligomers. e Representative 5 µm and 2 µm (white square in 5 µm image) AFM fields of MSI2 oligomers. f Representative 5 µm and 2 µm (white square in 5 µm image) AFM fields of MSI2/tau mix oligomers. g Representative confocal images of Control, AD, ALS and FTD human brains. They were stained with TOMA-2 and MSI1 (showed in gray) and merge are presented in RGB (TOMA-2 red, MSI1/MSI2 green and DAPI blue; white scale bar: 20 µm). h Representative confocal images of Control, AD, ALS, and FTD human brains. Tissues were stained with TOMA-2 and MSI2 (shown in gray) and the merged channel is presented (TOMA-2-red, MSI2-green, DAPI-blue; white scale bar: 20 µm). i–j Western blot of MSI1 and MSI2 in control, AD, ALS, and FTD brain homogenates. GAPDH is also presented, and each sample is in triplicate (HMW: High Molecular Weight).
Fig. 1 MSI/tau aggregation in vitro and MSI proteins in AD, ALS, and FTD frontal cortex. a Schematic representation of MSI1 and MSI2 proteins (RRM; RNA Recognition Motif). b Diagram of experimental procedure to produce in vitro MSI and tau oligomers. c Representative 5 µm and 2 µm (white square in 5 µm image) AFM fields of MSI1 oligomers. d Representative 5 µm and 2 µm (white square in 5 µm image) AFM fields of MSI1/tau mixed oligomers. e Representative 5 µm and 2 µm (white square in 5 µm image) AFM fields of MSI2 oligomers. f Representative 5 µm and 2 µm (white square in 5 µm image) AFM fields of MSI2/tau mix oligomers. g Representative confocal images of Control, AD, ALS and FTD human brains. They were stained with TOMA-2 and MSI1 (showed in gray) and merge are presented in RGB (TOMA-2 red, MSI1/MSI2 green and DAPI blue; white scale bar: 20 µm). h Representative confocal images of Control, AD, ALS, and FTD human brains. Tissues were stained with TOMA-2 and MSI2 (shown in gray) and the merged channel is presented (TOMA-2-red, MSI2-green, DAPI-blue; white scale bar: 20 µm). i–j Western blot of MSI1 and MSI2 in control, AD, ALS, and FTD brain homogenates. GAPDH is also presented, and each sample is in triplicate (HMW: High Molecular Weight).CC BY · PubMed Central
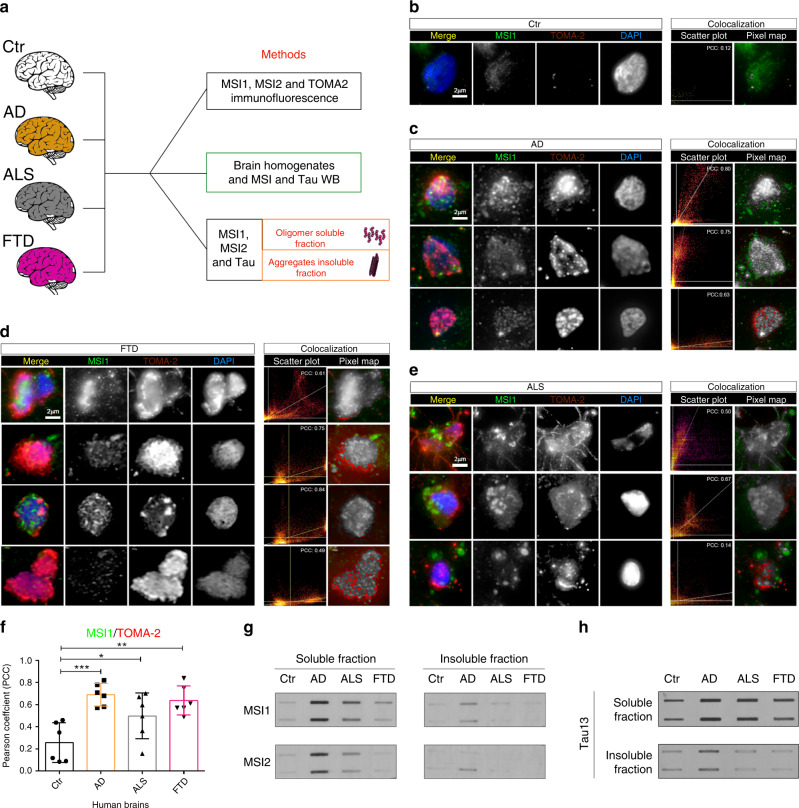
Fig. 2 Intra-subject variability of Musashi deposition in AD, ALS, and FTD frontal cortex. a Schematic approach to study MSI1, MSI2 and Tau deposition in human diseased brains. b Representative confocal image of nuclei stained with MSI1, TOMA-2 and DAPI in control (Ctr) brains. c Confocal images of cortical AD brain showed nuclei stained with MSI1, TOMA-2, and DAPI, three different nuclei are represented for each field the pixel distribution graph and colocalization pixel map has been reported. d Confocal images of cortical FTD brain showed nuclei stained with MSI1, TOMA-2 and DAPI, three different nuclei are represented for each field the pixel distribution graph and colocalization pixel map has been reported. e Confocal images of cortical ALS brain showed nuclei stained with MSI1, TOMA-2 and DAPI, three different nuclei are represented for each field the pixel distribution graph and colocalization pixel map has been reported. In all images merge is presented with MSI1 (green), TOMA-2 (red) and DAPI (blue) white scale bar: 2 µm. f PCC comparison between MSI1 and TOMA-2 intensities, significant co-localization has been observed between control and diseased brains. In particular, Ctr vs. AD ***, Ctr vs. ALS *, Ctr vs FTD **, Dunnett’s multiple comparisons test One-way ANOVA has been performed with a p-value=0.0006 between columns. N = 3 biologically independent cells (ROIs) examined over three independent experiments. Data are presented as mean ± SD. g MSI1 and MSI2 soluble and insoluble fraction from Ctr, AD, ALS, and FTD human brains, presented in duplicate. h Tau soluble and insoluble fractions from Ctr, AD, ALS, FTD human brains, presented in duplicate.
Fig. 2 Intra-subject variability of Musashi deposition in AD, ALS, and FTD frontal cortex. a Schematic approach to study MSI1, MSI2 and Tau deposition in human diseased brains. b Representative confocal image of nuclei stained with MSI1, TOMA-2 and DAPI in control (Ctr) brains. c Confocal images of cortical AD brain showed nuclei stained with MSI1, TOMA-2, and DAPI, three different nuclei are represented for each field the pixel distribution graph and colocalization pixel map has been reported. d Confocal images of cortical FTD brain showed nuclei stained with MSI1, TOMA-2 and DAPI, three different nuclei are represented for each field the pixel distribution graph and colocalization pixel map has been reported. e Confocal images of cortical ALS brain showed nuclei stained with MSI1, TOMA-2 and DAPI, three different nuclei are represented for each field the pixel distribution graph and colocalization pixel map has been reported. In all images merge is presented with MSI1 (green), TOMA-2 (red) and DAPI (blue) white scale bar: 2 µm. f PCC comparison between MSI1 and TOMA-2 intensities, significant co-localization has been observed between control and diseased brains. In particular, Ctr vs. AD ***, Ctr vs. ALS *, Ctr vs FTD **, Dunnett’s multiple comparisons test One-way ANOVA has been performed with a p-value=0.0006 between columns. N = 3 biologically independent cells (ROIs) examined over three independent experiments. Data are presented as mean ± SD. g MSI1 and MSI2 soluble and insoluble fraction from Ctr, AD, ALS, and FTD human brains, presented in duplicate. h Tau soluble and insoluble fractions from Ctr, AD, ALS, FTD human brains, presented in duplicate.CC BY · PubMed Central
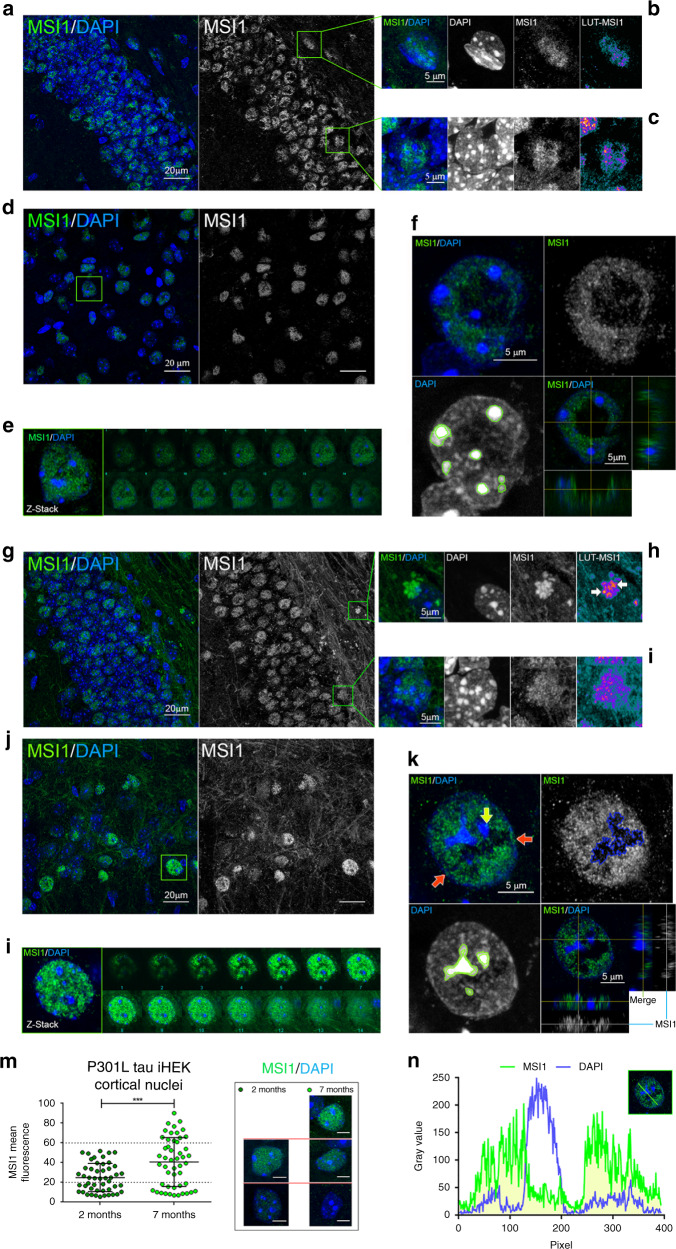
Fig. 3 MSI1 accumulate in the nuclei and axons of aged P301L mice. a Representative confocal image of 2-month-old P301L DG (MSI1—green, DAPI—blue), MSI1 channel is presented in gray, white scale bar: 20 µm. b Inset of subgranular zone (SGZ) nucleus enlarged from (a), merge MSI1. DAPI and Look-Up Table Fire (LUT)-MSI1 channels are represented, white scale bar: 5 µm. c Inset of DG nucleus enlarged from A. Merge, MSI1, DAPI and LUT-MSI1 channels are represented, white scale bar: 5 µm. d Representative confocal image of 2-month-old P301L cortex (MSI1—green, DAPI—blue), MSI1 channel is presented in gray, white scale bar: 20 µm. e Cortical nucleus (highlighted in D) and montage of Z-stack. f Merge (MSI1-green and DAPI—blue), MSI1 (gray) and DAPI channels are presented for cortical nuclei with orthogonal view (bottom right), white scale bar: 5 µm. g Representative confocal image of 7-month-old P301L DG (MSI1—green, DAPI—blue), MSI1 channel is presented in gray, white scale bar: 20 µm. h Inset of SGZ nuclei enlarged from (g), merge MSI1. DAPI and LUT-MSI1 channels are represented, white scale bar: 5 µm. i Inset of DG nucleus enlarged from (g). Merge, MSI1, DAPI, and LUT-MSI1 channels are represented, white scale bar: 5 µm. j Representative confocal image of 7-month-old P301L cortex (MSI1—green, DAPI—blue), MSI1 channel is presented in gray, white scale bar: 20 µm. k Merge (MSI1—green and DAPI—blue), MSI1 (gray) and DAPI channels are presented for 7-month cortical nuclei with orthogonal view (bottom right), white scale bar: 5 µm. l 7-month cortical nucleus (highlighted in (j)) and montage of Z-stack. m Quantification of cortical MSI1 mean fluorescence in 2- and 7-month-old P301L mice nuclei, significant increment of MSI1 has been observed (2 M vs 7 M p = 0.0002*** unpaired t-test), representative images from each group are shown (white scale bar: 5 µm). N = 50 biologically independent nuclei (ROIs) examined over three independent experiments. Data are presented as mean ± SD. n Nuclear MSI1 and DAPI fluorescence profiles revealed a not homogenous distribution of MSI1 in the nuclei and no overlap with nucleoli (white line profile: 10 µm).
Fig. 3 MSI1 accumulate in the nuclei and axons of aged P301L mice. a Representative confocal image of 2-month-old P301L DG (MSI1—green, DAPI—blue), MSI1 channel is presented in gray, white scale bar: 20 µm. b Inset of subgranular zone (SGZ) nucleus enlarged from (a), merge MSI1. DAPI and Look-Up Table Fire (LUT)-MSI1 channels are represented, white scale bar: 5 µm. c Inset of DG nucleus enlarged from A. Merge, MSI1, DAPI and LUT-MSI1 channels are represented, white scale bar: 5 µm. d Representative confocal image of 2-month-old P301L cortex (MSI1—green, DAPI—blue), MSI1 channel is presented in gray, white scale bar: 20 µm. e Cortical nucleus (highlighted in D) and montage of Z-stack. f Merge (MSI1-green and DAPI—blue), MSI1 (gray) and DAPI channels are presented for cortical nuclei with orthogonal view (bottom right), white scale bar: 5 µm. g Representative confocal image of 7-month-old P301L DG (MSI1—green, DAPI—blue), MSI1 channel is presented in gray, white scale bar: 20 µm. h Inset of SGZ nuclei enlarged from (g), merge MSI1. DAPI and LUT-MSI1 channels are represented, white scale bar: 5 µm. i Inset of DG nucleus enlarged from (g). Merge, MSI1, DAPI, and LUT-MSI1 channels are represented, white scale bar: 5 µm. j Representative confocal image of 7-month-old P301L cortex (MSI1—green, DAPI—blue), MSI1 channel is presented in gray, white scale bar: 20 µm. k Merge (MSI1—green and DAPI—blue), MSI1 (gray) and DAPI channels are presented for 7-month cortical nuclei with orthogonal view (bottom right), white scale bar: 5 µm. l 7-month cortical nucleus (highlighted in (j)) and montage of Z-stack. m Quantification of cortical MSI1 mean fluorescence in 2- and 7-month-old P301L mice nuclei, significant increment of MSI1 has been observed (2 M vs 7 M p = 0.0002*** unpaired t-test), representative images from each group are shown (white scale bar: 5 µm). N = 50 biologically independent nuclei (ROIs) examined over three independent experiments. Data are presented as mean ± SD. n Nuclear MSI1 and DAPI fluorescence profiles revealed a not homogenous distribution of MSI1 in the nuclei and no overlap with nucleoli (white line profile: 10 µm).CC BY · PubMed Central
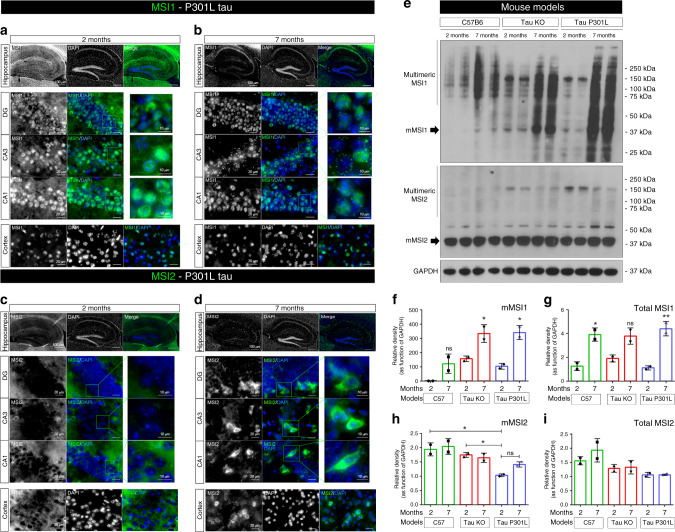
Fig. 4 MSI proteins in hippocampus and cortex of P301L tau mouse model. a Representative MSI1 (gray/green) immunofluorescence of 2-month P301L hippocampus (10X, white scale bar: 100 µm). High Magnification images (100X) of DG, CA3, CA1 and Cortex are presented (white scale bar: 20 µm). b Representative MSI1 (gray/green) immunofluorescence of 7-month P301L hippocampus (10X, white scale bar: 100 µm). High Magnification images (100X) of DG, CA3, CA1 and Cortex are presented (white scale bar: 20 µm). c Representative MSI2 gray/green) immunofluorescence of 2-month P301L hippocampus (10X, white scale bar: 100 µm). High Magnification images (100X) of DG, CA3, CA1, and Cortex are presented (white scale bar: 20 µm). d Representative MSI2 gray/green) immunofluorescence of 7-month P301L hippocampus (10X, white scale bar: 100 µm). High Magnification images (100X) of DG, CA3, CA1, and Cortex are presented (white scale bar: 20 µm). For all the images, MSI2 is presented in gray channel and in the merge MSI2 is presented (Nuclei are stained with DAPI, blue). All zoomed images of DG, CA3 and CA1 have a white scale bar of 10 µm (e) MSI1, MSI2, and GAPDH immunoblots in 2- and 7-month-old mouse brain homogenates (C57, tau KO, and tau P301L models). Immunoblot samples are presented in duplicate. f–g Relative density of monomeric and total MSI1, respectively is presented (Monomeric MSI1 One-way ANOVA, Tukey’s multiple comparisons test has been performed (p-value=0.0014 between the columns, for total MSI1 p = 0.0014). Data are presented as mean ± SD. h, i Relative density of monomeric and total MSI2 respectively is presented. All relative density are in function of GAPDH. One-way ANOVA, Tukey’s multiple comparisons test has been performed to compare MSI relative amounts among the ages and models (monomeric MSI2 p = 0.0084, for total MSI2 p = 0.0415). Sample size for data in (f–i) is n = 3 biologically independent samples examined over three independent experiments, two independent samples are shown in the WB. Data are presented as mean ± SD.
Fig. 4 MSI proteins in hippocampus and cortex of P301L tau mouse model. a Representative MSI1 (gray/green) immunofluorescence of 2-month P301L hippocampus (10X, white scale bar: 100 µm). High Magnification images (100X) of DG, CA3, CA1 and Cortex are presented (white scale bar: 20 µm). b Representative MSI1 (gray/green) immunofluorescence of 7-month P301L hippocampus (10X, white scale bar: 100 µm). High Magnification images (100X) of DG, CA3, CA1 and Cortex are presented (white scale bar: 20 µm). c Representative MSI2 gray/green) immunofluorescence of 2-month P301L hippocampus (10X, white scale bar: 100 µm). High Magnification images (100X) of DG, CA3, CA1, and Cortex are presented (white scale bar: 20 µm). d Representative MSI2 gray/green) immunofluorescence of 7-month P301L hippocampus (10X, white scale bar: 100 µm). High Magnification images (100X) of DG, CA3, CA1, and Cortex are presented (white scale bar: 20 µm). For all the images, MSI2 is presented in gray channel and in the merge MSI2 is presented (Nuclei are stained with DAPI, blue). All zoomed images of DG, CA3 and CA1 have a white scale bar of 10 µm (e) MSI1, MSI2, and GAPDH immunoblots in 2- and 7-month-old mouse brain homogenates (C57, tau KO, and tau P301L models). Immunoblot samples are presented in duplicate. f–g Relative density of monomeric and total MSI1, respectively is presented (Monomeric MSI1 One-way ANOVA, Tukey’s multiple comparisons test has been performed (p-value=0.0014 between the columns, for total MSI1 p = 0.0014). Data are presented as mean ± SD. h, i Relative density of monomeric and total MSI2 respectively is presented. All relative density are in function of GAPDH. One-way ANOVA, Tukey’s multiple comparisons test has been performed to compare MSI relative amounts among the ages and models (monomeric MSI2 p = 0.0084, for total MSI2 p = 0.0415). Sample size for data in (f–i) is n = 3 biologically independent samples examined over three independent experiments, two independent samples are shown in the WB. Data are presented as mean ± SD.CC BY · PubMed Central
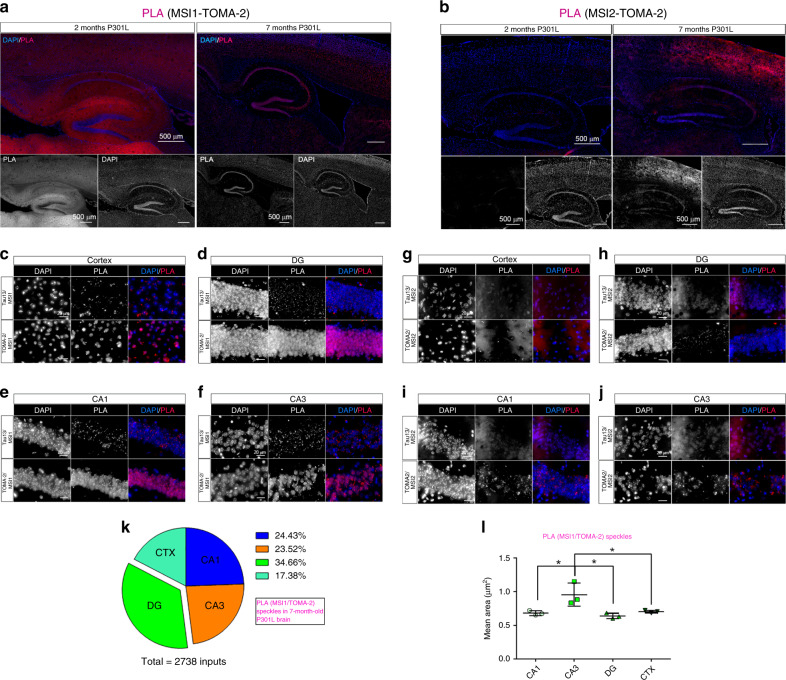
Fig. 5 MSI/tau complexes localize in P301L hippocampus and cortex nuclei in aged mice. a Representative hippocampus of 2- and 7-month-old P301L mice. PLA (MSI1-TOMA-2 combination) represented in red and DAPI (blue) stained nuclei. PLA and DAPI channels are represented in gray below the stitched panels. b Representative hippocampus of 2- and 7-month-old P301L mice. PLA (MSI2-TOMA-2 combination) represented in red and DAPI (blue) stained nuclei. PLA and DAPI channels are represented in gray below the stitched panels. 10x magnification and white scale bar: 500 µm. c Cortex 7-month PLA Tau13/MSI1 (top) and TOMA-2/MSI1 (bottom). d DG 7-month PLA Tau13/MSI1 (top) and TOMA-2/MSI1 (bottom). e CA1 7-month PLA Tau13/MSI1 (top) and TOMA-2/MSI1 (bottom). f CA3 7-month PLA Tau13/MSI1 (top) and TOMA-2/MSI1 (bottom). g Cortex 7-month PLA Tau13/MSI2 (top) and TOMA-2/MSI2 (bottom). h DG 7-month PLA Tau13/MSI2 (top) and TOMA-2/MSI2 (bottom). i CA1 7-month PLA Tau13/MSI2 (top) and TOMA-2/MSI2 (bottom). j CA3 7-month PLA Tau13/MSI2 (top) and TOMA-2/MSI2 (bottom). Magnification ×100 and white scale bar: 20 µm. k Percentage of MSI1/TOMA-2 foci in CTX, DG, CA1 and CA3 in brains from 7-month-old mice. Percentage is represented by a pie chart. l Mean Area quantification of MSI1/TOMA-2 foci in CTX, DG, CA1, and CA3 in brains from 7-month-old mice (one-way ANOVA, * p = 0.0106 between the columns). Three ROIs from n = 3 biologically independent examined over three independent experiments. Data are presented as mean ± SD.
Fig. 5 MSI/tau complexes localize in P301L hippocampus and cortex nuclei in aged mice. a Representative hippocampus of 2- and 7-month-old P301L mice. PLA (MSI1-TOMA-2 combination) represented in red and DAPI (blue) stained nuclei. PLA and DAPI channels are represented in gray below the stitched panels. b Representative hippocampus of 2- and 7-month-old P301L mice. PLA (MSI2-TOMA-2 combination) represented in red and DAPI (blue) stained nuclei. PLA and DAPI channels are represented in gray below the stitched panels. 10x magnification and white scale bar: 500 µm. c Cortex 7-month PLA Tau13/MSI1 (top) and TOMA-2/MSI1 (bottom). d DG 7-month PLA Tau13/MSI1 (top) and TOMA-2/MSI1 (bottom). e CA1 7-month PLA Tau13/MSI1 (top) and TOMA-2/MSI1 (bottom). f CA3 7-month PLA Tau13/MSI1 (top) and TOMA-2/MSI1 (bottom). g Cortex 7-month PLA Tau13/MSI2 (top) and TOMA-2/MSI2 (bottom). h DG 7-month PLA Tau13/MSI2 (top) and TOMA-2/MSI2 (bottom). i CA1 7-month PLA Tau13/MSI2 (top) and TOMA-2/MSI2 (bottom). j CA3 7-month PLA Tau13/MSI2 (top) and TOMA-2/MSI2 (bottom). Magnification ×100 and white scale bar: 20 µm. k Percentage of MSI1/TOMA-2 foci in CTX, DG, CA1 and CA3 in brains from 7-month-old mice. Percentage is represented by a pie chart. l Mean Area quantification of MSI1/TOMA-2 foci in CTX, DG, CA1, and CA3 in brains from 7-month-old mice (one-way ANOVA, * p = 0.0106 between the columns). Three ROIs from n = 3 biologically independent examined over three independent experiments. Data are presented as mean ± SD.CC BY · PubMed Central
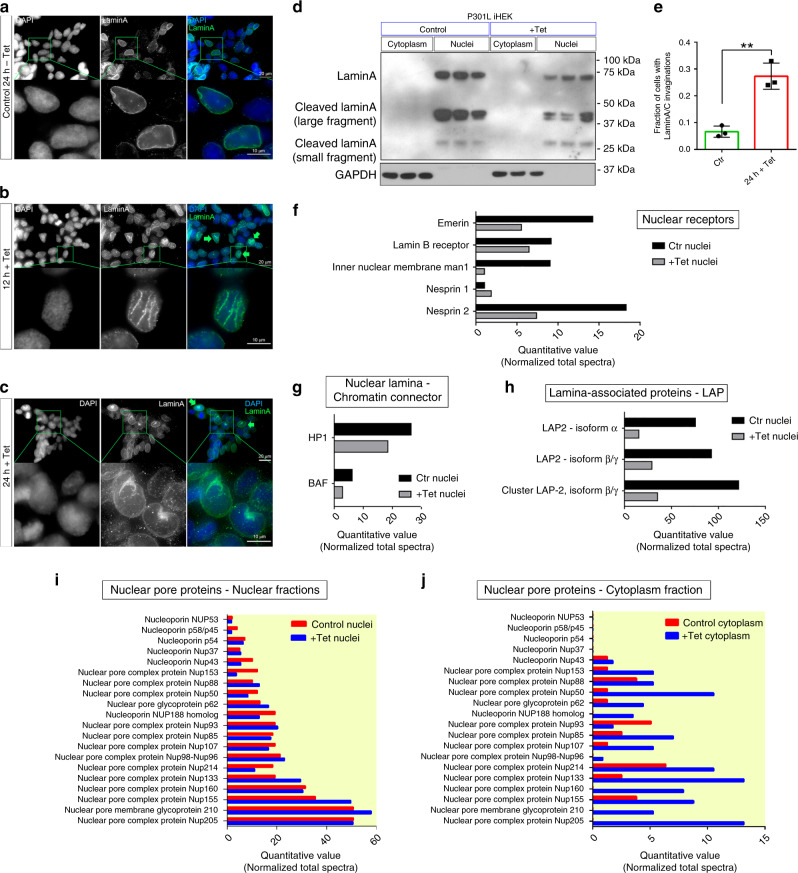
Fig. 6 P301L tau destabilizes nuclear morphology and transport. a–c Representative images of P301L tau iHEK at 0 h, 12 h, and 24 h after Tet induction, respectively. Cells are stained with LaminA (green) and DAPI (blue), magnification ×100 white scale bar: 20 µm, enlarged ROI white scale bar: 10 µm. d Western blot of LaminA in cell fractions (cytoplasm and nuclei) of P301L tau iHEK (Control and Tet). GAPDH has been used for cytoplasmic fractions purity. e Fraction of cells with LaminA invaginations, (two-tailed unpaired t-test **, p = 0.0026). N = 3 biologically independent (ROIs) examined over three independent experiments. Data are presented as mean ± SD. f MS quantitative value of nuclear receptor: Emerin, Lamin B receptor, Man1, Nesprin1, and Nesprin2. g MS quantitative value of nuclear lamina/chromatin connector: HP1 and BAF. h MS quantitative value of lamina-associated proteins. i MS quantitative value of nuclear fraction of NUPs. j MS quantitative value of cytoplasmic fraction of NUP.
Fig. 6 P301L tau destabilizes nuclear morphology and transport. a–c Representative images of P301L tau iHEK at 0 h, 12 h, and 24 h after Tet induction, respectively. Cells are stained with LaminA (green) and DAPI (blue), magnification ×100 white scale bar: 20 µm, enlarged ROI white scale bar: 10 µm. d Western blot of LaminA in cell fractions (cytoplasm and nuclei) of P301L tau iHEK (Control and Tet). GAPDH has been used for cytoplasmic fractions purity. e Fraction of cells with LaminA invaginations, (two-tailed unpaired t-test **, p = 0.0026). N = 3 biologically independent (ROIs) examined over three independent experiments. Data are presented as mean ± SD. f MS quantitative value of nuclear receptor: Emerin, Lamin B receptor, Man1, Nesprin1, and Nesprin2. g MS quantitative value of nuclear lamina/chromatin connector: HP1 and BAF. h MS quantitative value of lamina-associated proteins. i MS quantitative value of nuclear fraction of NUPs. j MS quantitative value of cytoplasmic fraction of NUP.CC BY · PubMed Central
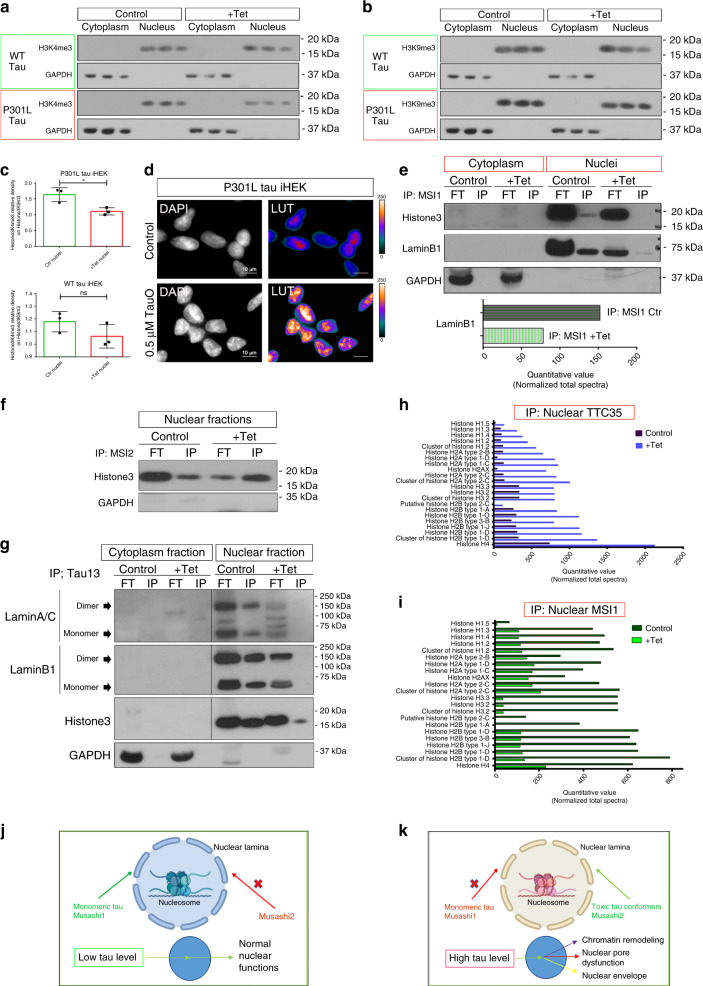
Fig. 7 MSI and tau bind Histone3 modulating chromatin state in the cells. a, b H3K4me3 and H3K9me3 WB in cytoplasmic and nuclear fractions of WT and P301L tau iHEK. c Relative density of H3K4m3 in P301L (two-tailed unpaired t-test; Ctr vs Tet, * p = 0.0217) and WT iHEK (two-tailed unpaired t-test; p = 0.1758; ns). N = 3 biologically independent cells (ROIs) examined over three independent experiments. Data are presented as mean ± SD. d DAPI staining of nuclei control and TauO 0.5 µM treated P301L tau iHEK. Gray channel and LUT Fire are represented. White scale bar: 10 µm. e IB of Histone3, LaminB1, and GAPDH of IP MSI1 cytoplasm and nuclear fractions of control and Tet P301L tau iHEK. f IB of Histone3 and GAPDH of IP MSI2 nuclear fractions of control and Tet P310L tau iHEK. g IB of LaminA, LaminB1, Histone3, and GAPDH of IP Tau13 cytosolic and nuclear fractions of control and Tet P301L tau iHEK. All IB present Input (FT) fractions. h MS of IP TTC35 nuclear fraction of Histone proteins. i MS of IP MSI1 nuclear fraction of Histone proteins. j, k Normal and pathological, respectively, effects of mutant P301L tau oligomers in the cell model. Folded Monomeric tau and nuclear MSI1 regulate nuclear activity, while toxic tau conformers and nuclear MSI2 unbalanced nuclear homeostasis modulating chromatin remodeling, nucleoporin localization and destabilizing nuclear envelope.
Fig. 7 MSI and tau bind Histone3 modulating chromatin state in the cells. a, b H3K4me3 and H3K9me3 WB in cytoplasmic and nuclear fractions of WT and P301L tau iHEK. c Relative density of H3K4m3 in P301L (two-tailed unpaired t-test; Ctr vs Tet, * p = 0.0217) and WT iHEK (two-tailed unpaired t-test; p = 0.1758; ns). N = 3 biologically independent cells (ROIs) examined over three independent experiments. Data are presented as mean ± SD. d DAPI staining of nuclei control and TauO 0.5 µM treated P301L tau iHEK. Gray channel and LUT Fire are represented. White scale bar: 10 µm. e IB of Histone3, LaminB1, and GAPDH of IP MSI1 cytoplasm and nuclear fractions of control and Tet P301L tau iHEK. f IB of Histone3 and GAPDH of IP MSI2 nuclear fractions of control and Tet P310L tau iHEK. g IB of LaminA, LaminB1, Histone3, and GAPDH of IP Tau13 cytosolic and nuclear fractions of control and Tet P301L tau iHEK. All IB present Input (FT) fractions. h MS of IP TTC35 nuclear fraction of Histone proteins. i MS of IP MSI1 nuclear fraction of Histone proteins. j, k Normal and pathological, respectively, effects of mutant P301L tau oligomers in the cell model. Folded Monomeric tau and nuclear MSI1 regulate nuclear activity, while toxic tau conformers and nuclear MSI2 unbalanced nuclear homeostasis modulating chromatin remodeling, nucleoporin localization and destabilizing nuclear envelope.CC BY · PubMed Central

Verification

Claims the paper makes

The claims and statistics of this paper haven’t been checked yet.

Run the check — free, no account needed. It reads the open-access text and checks the sources it cites.

A few free checks a day · papers already verified open instantly · results are public

Claims other papers make about this one

Each is checked against this paper’s own text: does it say what the citing paper says it does?

Self-check

Percentages, sums and reported differences re-computed from the paper’s own numbers.

The self-check needs the paper’s full text.

Citations

Cites

Research works printed but not linked: 37

  1. Lunde, B. M., Moore, C. & Varani, G. RNA-binding proteins: modular design for efficient function. Nat. Rev. Mol. Cell Biol. 8, 479–490 (2007). · DOI
  2. De Conti, L., Baralle, M., Buratti, E. Neurodegeneration and RNA-binding proteins. Wiley Interdiscip. Rev. RNA. 8, https://doi.org/10.1002/wrna.1394 (2017) · DOI
  3. Montalbano, M., et al. Tau oligomers mediate aggregation of RNA-binding proteins Musashi1 and Musashi2 inducing Lamin alteration. Aging Cell 18, e13035 (2019). · DOI
  4. Maziuk, B., Ballance, H. I. & Wolozin, B. Dysregulation of RNA binding protein aggregation in neurodegenerative disorders. Front Mol. Neurosci. 10, 89 (2017). · DOI
  5. Vanderweyde, T. et al. Interaction of tau with the RNA-Binding Protein TIA1 Regulates tau Pathophysiology and Toxicity. Cell Rep. 15, 1455–1466 (2016). · DOI · Paper page
  6. Bishof I., et al. RNA-binding proteins with basic-acidic dipeptide (BAD) domains self-assemble and aggregate in Alzheimer’s disease. J Biol Chem. https://doi.org/10.1074/jbc.RA118.001747 (2018). · DOI · Paper page
  7. Sengupta, U. et al. Formation of toxic oligomeric assemblies of RNA-binding protein: Musashi in Alzheimer’s disease. Acta Neuropathol. Commun. 6, 113 (2018). · DOI · Paper page
  8. Nakamura, M., Okano, H., Blendy, J. A. & Montell, C. Musashi, a neural RNA-binding protein required for Drosophila adult external sensory organ development. Neuron 13, 67–81 (1994). · DOI
  9. Good, P. et al. The human Musashi homolog 1 (MSI1) gene encoding the homologue of Musashi/Nrp-1, a neural RNA-binding protein putatively expressed in CNS stem cells and neural progenitor cells. Genomics 52, 382–384 (1998). · DOI
  10. Sakakibara, S., Nakamura, Y., Satoh, H. & Okano, H. Rna-binding protein Musashi2: developmentally regulated expression in neural precursor cells and subpopulations of neurons in mammalian CNS. J. Neurosci. 21, 8091–8107 (2001). · DOI
  11. Lovell, M. A. & Markesbery, W. R. Ectopic expression of Musashi-1 in Alzheimer disease and Pick disease. J. Neuropathol. Exp. Neurol. 64, 675–680 (2005). · DOI
  12. Irwin, D. J. et al. Frontotemporal lobar degeneration: defining phenotypic diversity through personalized medicine. Acta Neuropathol. 129, 469–491 (2015). · DOI
  13. Zhao, M., Kim, J. R., van Bruggen, R. & Park, J. RNA-binding proteins in amyotrophic lateral sclerosis. Mol. Cells 41, 818–829 (2018).
  14. Ashizawa, T., Öz, G. & Paulson, H. L. Spinocerebellar ataxias: prospects and challenges for therapy development. Nat. Rev. Neurol. 14, 590–605 (2018). · DOI
  15. Nussbacher, J. K., Tabet, R., Yeo, G. W. & Lagier-Tourenne, C. Disruption of RNA Metabolism in Neurological Diseases and Emerging Therapeutic Interventions. Neuron 102, 294–320 (2019). · DOI
  16. Castillo-Carranza, D. L. et al. Specific targeting of tau oligomers in Htau mice prevents cognitive impairment and tau toxicity following injection with brain-derived tau oligomeric seeds. J. Alzheimers Dis. 40(Suppl 1), S97–S111 (2014). · DOI
  17. Gerson, J. E., Mudher, A. & Kayed, R. Potential mechanisms and implications for the formation of tau oligomeric strains. Crit. Rev. Biochem Mol. Biol. 51, 482–496 (2016). · DOI
  18. Arrasate, M., Perez, M. & Avila, J. Tau dephosphorylation at tau-1 site correlates with its association to cell membrane. Neurochem. Res. 25, 43–50 (2000). · DOI
  19. Buee, L., Bussiere, T., Buee-Scherrer, V., Delacourte, A. & Hof, P. R. Tau protein isoforms, phosphorylation and role in neurodegenerative disorders. Brain Res. Brain Res. Rev. 33, 95–130 (2000). · DOI
  20. Nishikawa, T. et al. The identification of raft-derived tau-associated vesicles that are incorporated into immature tangles and paired helical filaments. Neuropathol. Appl. Neurobiol. 42, 639–653 (2016). · DOI
  21. Kawarabayashi, T. et al. Dimeric amyloid beta protein rapidly accumulates in lipid rafts followed by apolipoprotein E and phosphorylated tau accumulation in the Tg2576 mouse model of Alzheimer’s disease. J. Neurosci. 24, 3801–3809 (2004). · DOI · Paper page
  22. Collin, L. et al. Neuronal uptake of tau/pS422 antibody and reduced progression of tau pathology in a mouse model of Alzheimer’s disease. Brain 137(Pt 10), 2834–2846 (2014). · DOI
  23. Lester, E. & Parker, R. The Tau of Nuclear-Cytoplasmic Transport. Neuron 99, 869–871 (2018). · DOI
  24. Eftekharzadeh, B. et al. Tau protein disrupts nucleocytoplasmic transport in Alzheimer’s disease. Neuron 101, 349 (2019). · DOI
  25. Metuzals, J., Robitaille, Y., Houghton, S., Gauthier, S. & Leblanc, R. Paired helical filaments and the cytoplasmic-nuclear interface in Alzheimer’s disease. J. Neurocytol. 17, 827–833 (1988). · DOI
  26. Brady, R. M., Zinkowski, R. P. & Binder, L. I. Presence of tau in isolated nuclei from human brain. Neurobiol. Aging 16, 479–486 (1995). · DOI
  27. Frost, B., Bardai, F. H. & Feany, M. B. Lamin dysfunction mediates neurodegeneration in tauopathies. Curr. Biol. 26, 129–136 (2016). · DOI · Paper page
  28. Lutz, M. I., Schwaiger, C., Hochreiter, B., Kovacs, G. G. & Schmid, J. A. Novel approach for accurate tissue-based protein colocalization and proximity microscopy. Sci. Rep. 7, 2668 (2017). · DOI
  29. Sakakibara, S. et al. RNA-binding protein Musashi family: roles for CNS stem cells and a subpopulation of ependymal cells revealed by targeted disruption and antisense ablation. Proc. Natl Acad. Sci. USA 99, 15194–15199 (2002). · DOI
  30. Rodríguez, J. J. & Verkhratsky, A. Neurogenesis in Alzheimer’s disease. J. Anat. 219, 78–89 (2011). · DOI
  31. Fahrenkrog B., Harel A. Perturbations in Traffic: Aberrant Nucleocytoplasmic Transport at the Heart of Neurodegeneration. Cells. 7. https://doi.org/10.3390/cells7120232 (2018). · DOI
  32. Terwel, D. et al. Changed conformation of mutant Tau-P301L underlies the moribund tauopathy, absent in progressive, nonlethal axonopathy of Tau-4R/2N transgenic mice. J. Biol. Chem. 280, 3963–3973 (2005). · DOI
  33. Andorfer, C. et al. Hyperphosphorylation and aggregation of tau in mice expressing normal human tau isoforms. J. Neurochem. 86, 582–590 (2003). · DOI · Paper page
  34. Lasagna-Reeves, C. A. et al. Identification of oligomers at early stages of tau aggregation in Alzheimer’s disease. FASEB J. Publ. Fed. Am. Soc. Exp. Biol. 26, 1946–1959 (2012).
  35. Lo Cascio, F. et al. Toxic tau oligomers modulated by novel curcumin derivatives. Sci. Rep. 9, 19011 (2019). · DOI
  36. Nesvizhskii, A. I., Keller, A., Kolker, E. & Aebersold, R. A statistical model for identifying proteins by tandem mass spectrometry. Anal. Chem. 75, 4646–4658 (2003). · DOI
  37. Gerson, J. E., Sengupta, U. & Kayed, R. Tau oligomers as pathogenic seeds: preparation and propagation in vitro and in vivo. Methods Mol. Biol. 1523, 141–157 (2017). · DOI

Cited by

See all 94

Metadata

Authors
Montalbano, M., McAllen, S., Puangmalai, N., Sengupta, U., Bhatt, N., Johnson, O. D., Kharas, M. G., & Kayed, R.
Venue
Nature Communications
Published
2020-08-27
Volume
11
Issue
1
ISSN
2041-1723
Cited by
94
References
5
Language
en
Funders
  • American Heart Association (17CSA33620007)
  • The Gilson Longenbaugh Foundation

About these checks

Registry, retraction, Cites and statistics results are computed, not judged, with one exception: a printed reference that no index lists is read once by a model before it counts as a citation error. Claims are extracted by a model and kept only when their quote appears verbatim in the text; each cited source is then checked, with a model’s help, for whether it says what the claim relies on. Those verdicts can be wrong — read the claim’s quote and the cited source before relying on one.

Statistics and arithmetic are recomputed, not judged.

Confidence bands are shown only for fields calibrated on our annotated test set. None is calibrated yet, so no band is shown.

What counts as a claim ›How we measure confidence ›How we check this ›

Are you an author, or do you see a problem with this page? Request a review

Data sources

Bibliographic data: Semantic Scholar, OpenAlex, Crossref.

Contains information from the Semantic Scholar Academic Graph Datasets, made available under the ODC Attribution License (ODC-BY 1.0).

Semantic Scholar’s data is described in: Kinney, R., et al. (2023). The Semantic Scholar Open Data Platform. arXiv:2301.10140.