

The DOI matches its Crossref record; 60 of the 61 references it cites were found in a registry or an index.
A computational reward learning account of social media engagement
Open accessAbstract
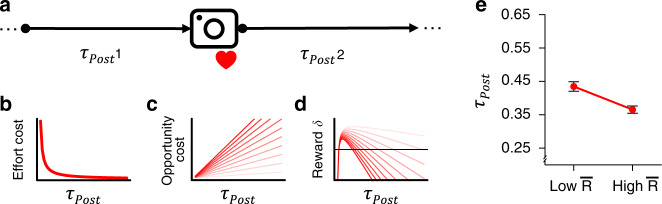
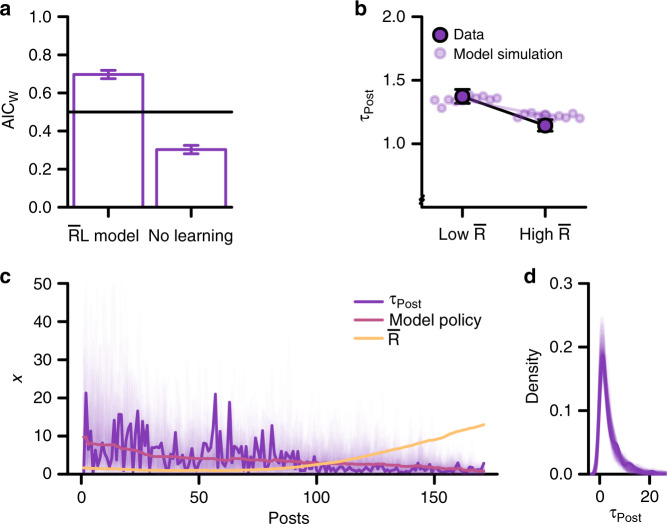
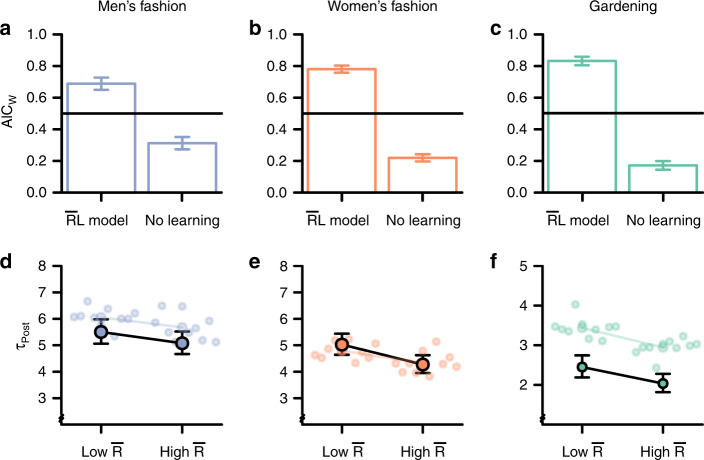
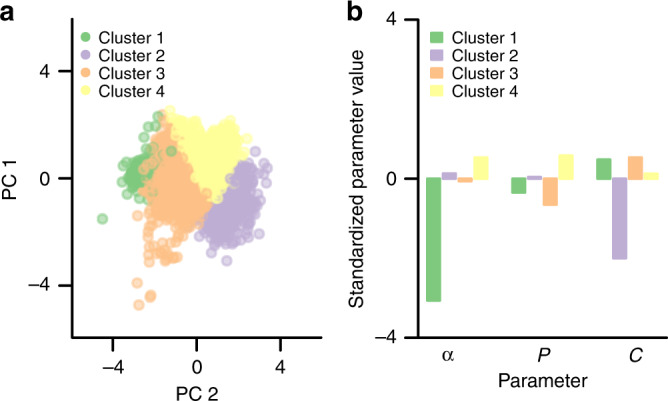
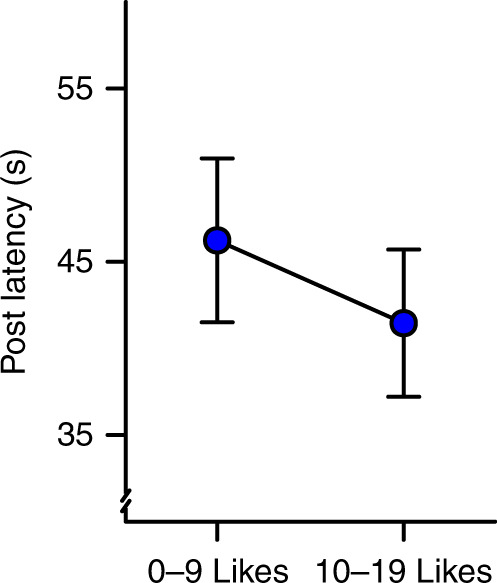
Social media has become a modern arena for human life, with billions of daily users worldwide. The intense popularity of social media is often attributed to a psychological need for social rewards (likes), portraying the online world as a Skinner Box for the modern human. Yet despite such portrayals, empirical evidence for social media engagement as reward-based behavior remains scant. Here, we apply a computational approach to directly test whether reward learning mechanisms contribute to social media behavior. We analyze over one million posts from over 4000 individuals on multiple social media platforms, using computational models based on reinforcement learning theory. Our results consistently show that human behavior on social media conforms qualitatively and quantitatively to the principles of reward learning. Specifically, social media users spaced their posts to maximize the average rate of accrued social rewards, in a manner subject to both the effort cost of posting and the opportunity cost of inaction. Results further reveal meaningful individual difference profiles in social reward learning on social media. Finally, an online experiment (n = 176), mimicking key aspects of social media, verifies that social rewards causally influence behavior as posited by our computational account. Together, these findings support a reward learning account of social media engagement and offer new insights into this emergent mode of modern human behavior.
Overview
The claims and statistics of this paper haven’t been checked yet.
Run the check — free, no account needed. It reads the open-access text and checks the sources it cites.
Integrity signals
Registry
Cites
Statistics
Figures
Verification
Claims the paper makes
The claims and statistics of this paper haven’t been checked yet.
Run the check — free, no account needed. It reads the open-access text and checks the sources it cites.
Claims other papers make about this one
Each is checked against this paper’s own text: does it say what the citing paper says it does?
The source backs part of the claim, not all of it — or backs it for a different population, condition or comparison.
In the citing paper
“Furthermore, the interval at which an algorithm rewards behavior influences how quickly it is repeated (Lindström et al., 2021).”
From Social Drivers and Algorithmic Mechanisms on Digital Media. (2024) · cites this paper as Lindström et al., 2021
Experimental — accuracy not yet measuredThe cited source says what the claim attributes to it.
In the citing paper
“Studies show that humans are susceptible to social feedback on digital media: Likes influence how quickly people post again (Lindström et al., 2021), whether or not they consider a post successful (Carr et al., 2018), and how happy, self-assured, and popular they feel after posting status updates (Rosenthal-von der Pütten et al., 2019; Zell & Moeller, 2018).”
From Social Drivers and Algorithmic Mechanisms on Digital Media. (2024) · cites this paper as Lindström et al., 2021
Self-check
Percentages, sums and reported differences re-computed from the paper’s own numbers.
The self-check needs the paper’s full text.
Citations
Cites
Reinforcement Learning: An Introduction
Sutton, R. S., & Barto, A. G. (1998) · IEEE Transactions on Neural Networks · doi:10.1109/tnn.1998.712192 · Cited by 27,225 · cited 3×
“As in Study 1, the estimated effect of R on posting latencies was stronger for individuals for whom the (cid:1) RL model provided a better fi t (see Supplementary Note 7).”
BackgroundMethodResultInfluentialReinforcement Learning: An Introduction
Sutton, R. S., & Barto, A. (2005) · IEEE Transactions on Neural Networks · doi:10.1109/tnn.2004.842673 · Cited by 25,268
lmerTest Package: Tests in Linear Mixed Effects Models
Kuznetsova, A., Brockhoff, P. B., & Christensen, R. H. B. (2017) · Journal of Statistical Software · doi:10.18637/jss.v082.i13 · Cited by 24,346
Advances in neural information processing systems 7
Cios, K. J., & Shields, M. E. (1997) · Neurocomputing · doi:10.1016/s0925-2312(97)90018-7 · Cited by 22,093
A theory of social comparison processes
Festinger, L. (1954) · Human Relations · doi:10.1177/001872675400700202 · Cited by 20,926
(1999) · Cited by 5,147
Centering predictor variables in cross-sectional multilevel models: A new look at an old issue.
Enders, C. K., & Tofighi, D. (2007) · Psychological Methods · doi:10.1037/1082-989x.12.2.121 · Cited by 4,462
NbClust : An R Package for Determining the Relevant Number of Clusters in a Data Set
Charrad, M., Ghazzali, N., Boiteau, V., & Niknafs, A. (2014) · Journal of Statistical Software · doi:10.18637/jss.v061.i06 · Cited by 3,396
AIC model selection using Akaike weights
Wagenmakers, E.-J., & Farrell, S. (2004) · Psychonomic Bulletin & Review · doi:10.3758/bf03206482 · Cited by 2,684
Herrnstein, R. J. (1970) · Journal of the Experimental Analysis of Behavior · doi:10.1901/jeab.1970.13-243 · Cited by 2,611
Cited by
Sorted by citations
Citizens Versus the Internet: Confronting Digital Challenges With Cognitive Tools
Kozyreva, A., Lewandowsky, S., & Hertwig, R. (2020) · Psychological Science in the Public Interest · doi:10.1177/1529100620946707 · Cited by 479
Mechanisms linking social media use to adolescent mental health vulnerability
Orben, A., Meier, A., Dalgleish, T., & Blakemore, S.-J. (2024) · Nature Reviews Psychology · doi:10.1038/s44159-024-00307-y · Cited by 220
“This result aligns with a reinforcement learning modelling study of Instagram data, which found that the likes a user receives on their own posts become less valuable and less predictive of future posting behaviour if others in their network receive more likes on their posts 160 .”
Social Drivers and Algorithmic Mechanisms on Digital Media.
Metzler, H., & Garcia, D. (2024) · Perspectives on Psychological Science · doi:10.1177/17456916231185057 · Cited by 204
“Studies show that humans are susceptible to social feedback on digital media: Likes influence how quickly people post again (Lindström et al., 2021), whether or not they consider a post successful (Carr et al., 2018), and how happy, self-assured, and popular they feel after posting status updates…”
BackgroundAlgorithm-mediated social learning in online social networks
Brady, W. J., Jackson, J. C., Lindström, B., & Crockett, M. J. (2023) · Trends in Cognitive Sciences · doi:10.1016/j.tics.2023.06.008 · Cited by 132
Self-citationSocial media and well-being: A methodological perspective
Parry, D. A., Fisher, J. T., Mieczkowski, H., Sewall, C. J. R., & Davidson, B. I. (2021) · Current Opinion in Psychology · doi:10.1016/j.copsyc.2021.11.005 · Cited by 138
Metadata
- Authors
- Lindström, B., Bellander, M., Schultner, D. T., Chang, A., Tobler, P. N., & Amodio, D. M.
- Affiliations
- University of Amsterdam (NL)
- Karolinska Institutet (SE)
- Boston University (US)
- University of Zurich (CH)
- New York University (US)
- Corresponding author
- Lindström, Björn
- ORCID
- Venue
- Nature Communications
- Published
- 2021-02-26
- Volume
- 12
- Issue
- 1
- Pages
- 1311-1311
- ISSN
- 2041-1723 (ISSN-L)
- PMC
- PMC7910435
- OpenAlex
- W3130507978
- Cited by
- 185
- References
- 61
- Citations by year
- 2026: 49 · 2025: 43 · 2024: 33 · 2023: 33 · 2022: 18 · 2021: 8
- FWCI
- 31.88
- Type
- journal article
- Language
- en
- Update notices
- correction (2021-03-16)
- Open access
- gold
- doi.org
- Locations
- Nature Communications (publishedVersion, cc-by)
- PubMed Central (publishedVersion, cc-by)
- PubMed (publishedVersion)
- VU Research Portal (publishedVersion, other-oa)
- UvA-DARE (University of Amsterdam) (acceptedVersion, cc-by)
- DOAJ (DOAJ: Directory of Open Access Journals) (submittedVersion, cc-by-sa)
- Zurich Open Repository and Archive (University of Zurich) (submittedVersion, cc-by)
- Data Archiving and Networked Services (DANS) (submittedVersion, other-oa)
- Funders
- National Science Foundation
- Schweizerischer Nationalfonds zur Förderung der Wissenschaftlichen Forschung (100019, 176016)
- Nederlandse Organisatie voor Wetenschappelijk Onderzoek (016.Vici.185.058)
- Topics
- Social Sciences › Sociology and Political Science › Impact of Technology on Adolescents
- Social Sciences › Decision Sciences › General Decision Sciences › Decision-Making and Behavioral Economics
- Social Sciences › Communication › Digital Media and Philosophy
- Keywords
- social media engagement, reward learning, reinforcement learning, social reward, likes, posting behavior, effort cost, opportunity cost, individual differences, computational modeling, online experiments
- MeSH terms
- Female, Humans, Learning, Male, Reinforcement, Psychology, Reward, Social Behavior, Social Media
About these checks
Registry, retraction, Cites and statistics results are computed, not judged, with one exception: a printed reference that no index lists is read once by a model before it counts as a citation error. Claims are extracted by a model and kept only when their quote appears verbatim in the text; each cited source is then checked, with a model’s help, for whether it says what the claim relies on. Those verdicts can be wrong — read the claim’s quote and the cited source before relying on one.
Statistics and arithmetic are recomputed, not judged.
Confidence bands are shown only for fields calibrated on our annotated test set. None is calibrated yet, so no band is shown.
What counts as a claim ›How we measure confidence ›How we check this ›
Are you an author, or do you see a problem with this page? Request a review
