

The DOI matches its Crossref record; 81 of the 81 references it cites were found in a registry or an index.
muscat detects subpopulation-specific state transitions from multi-sample multi-condition single-cell transcriptomics data
Open accessPublished version of a preprint
Abstract
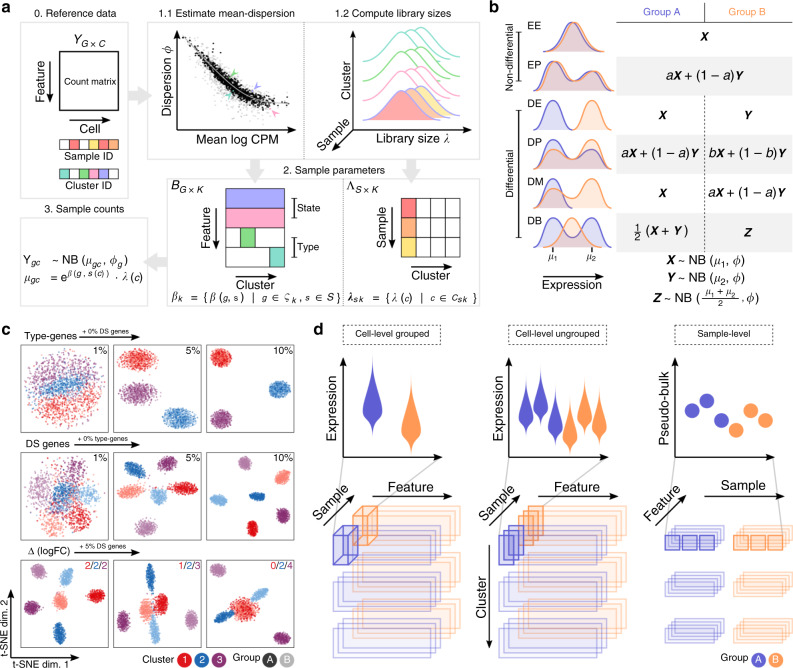
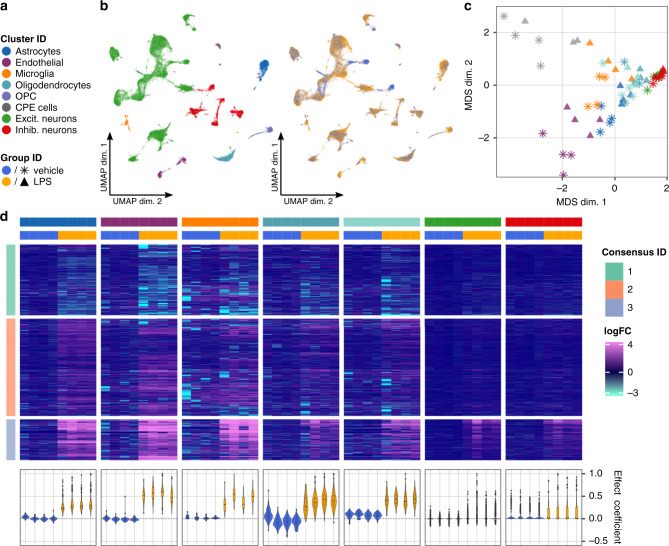
Single-cell RNA sequencing (scRNA-seq) has become an empowering technology to profile the transcriptomes of individual cells on a large scale. Early analyses of differential expression have aimed at identifying differences between subpopulations to identify subpopulation markers. More generally, such methods compare expression levels across sets of cells, thus leading to cross-condition analyses. Given the emergence of replicated multi-condition scRNA-seq datasets, an area of increasing focus is making sample-level inferences, termed here as differential state analysis; however, it is not clear which statistical framework best handles this situation. Here, we surveyed methods to perform cross-condition differential state analyses, including cell-level mixed models and methods based on aggregated pseudobulk data. To evaluate method performance, we developed a flexible simulation that mimics multi-sample scRNA-seq data. We analyzed scRNA-seq data from mouse cortex cells to uncover subpopulation-specific responses to lipopolysaccharide treatment, and provide robust tools for multi-condition analysis within the muscat R package.
Overview
The claims and statistics of this paper haven’t been checked yet.
Free: it reads the open-access text and checks the first 5 claims that cite a source we can check. Create a free account to check every claim.
Integrity signals
Registry
Cites
Statistics
Figures



Verification
Claims the paper makes
The claims and statistics of this paper haven’t been checked yet.
Free: it reads the open-access text and checks the first 5 claims that cite a source we can check. Create a free account to check every claim.
Claims other papers make about this one
Each is checked against this paper’s own text: does it say what the citing paper says it does?
The source backs part of the claim, not all of it — or backs it for a different population, condition or comparison.
In the citing paper
“Previous benchmarks of DE analysis methods for single-cell transcriptomics have relied heavily on simulated data, or else have compared the results of different methods in scenarios where no ground truth was available 10 , 17 .”
From Confronting false discoveries in single-cell differential expression (2021) · cites this paper as [10]
Experimental — accuracy not yet measuredThe source backs part of the claim, not all of it — or backs it for a different population, condition or comparison.
In the citing paper
“Two benchmarking studies, one applying the aforementioned simulation tool and one using different example data sets, demonstrated that the “pseudobulk” approach in combination with classical differential gene expression methods such as edgeR44 and limma-voom45 outperforms single cell specific methods and mixed models in multi sample DE analysis43,46.”
From scPower accelerates and optimizes the design of multi-sample single cell transcriptomic studies (2021) · cites this paper as [43]
Experimental — accuracy not yet measuredThe source backs part of the claim, not all of it — or backs it for a different population, condition or comparison.
In the citing paper
“A recent comparative analysis found that pseudobulk analysis methods are among the best-performing methods for differential state analysis and for making sample-level comparisons from single-cell data, and help to overcome some of the inherent sparsity in scRNA-seq data19,89.”
From Dissection of artifactual and confounding glial signatures by single-cell sequencing of mouse and human brain (2022) · cites this paper as [19]
Experimental — accuracy not yet measuredThe cited source says what the claim attributes to it.
In the citing paper
“Scatter plots demonstrating the strong correlation between the calculated effect sizes of two differential gene expression analysis methods (MAST55 (used here) and pseudobulk74,75) across cell types in the human medial frontal cortex (a) and choroid plexus (b).”
From Dysregulation of brain and choroid plexus cell types in severe COVID-19 (2021) · cites this paper as [74]
The cited source says what the claim attributes to it.
In the citing paper
“These simulations allow for assessing complex single cell multi-sample data, including scenarios of cell to cell heterogeneities other than differential gene expression.”
From scPower accelerates and optimizes the design of multi-sample single cell transcriptomic studies (2021) · cites this paper as [43]
7 more claims about this paper
Create a free account to see every claim other papers make about this one.
Self-check
Percentages, sums and reported differences re-computed from the paper’s own numbers.
The self-check needs the paper’s full text.
Citations
Cites
Moderated estimation of fold change and dispersion for RNA-seq data with DESeq2
Love, M. I., Huber, W., & Anders, S. (2014) · Genome Biology · doi:10.1186/s13059-014-0550-8 · Cited by 95,106
Fitting Linear Mixed-Effects Models Using lme4
Bates, D., Mächler, M., Bolker, B., & Walker, S. (2015) · Journal of Statistical Software · doi:10.18637/jss.v067.i01 · Cited by 86,835
Robinson, M. D., McCarthy, D. J., & Smyth, G. K. (2010) · Bioinformatics · doi:10.1093/bioinformatics/btp616 · Cited by 41,364
Self-citationlimma powers differential expression analyses for RNA-sequencing and microarray studies
Ritchie, M. E., Phipson, B., Wu, D., Hu, Y., Law, C. W., Shi, W., & Smyth, G. K. (2015) · Nucleic Acids Research · doi:10.1093/nar/gkv007 · Cited by 40,458
Wickham, H. (2016) · Use R! · doi:10.1007/978-3-319-24277-4 · Cited by 33,115
(2008) · Journal of Machine Learning Research · Cited by 33,051
Fast unfolding of communities in large networks
Blondel, V. D., Guillaume, J.-L., Lambiotte, R., & Lefebvre, E. (2008) · Journal of Statistical Mechanics: Theory and Experiment · doi:10.1088/1742-5468/2008/10/p10008 · Cited by 21,424
Comprehensive Integration of Single-Cell Data
Stuart, T., Butler, A., Hoffman, P., Hafemeister, C., Papalexi, E., Mauck, W. M., Hao, Y., Stoeckius, M., Smibert, P., & Satija, R. (2019) · Cell · doi:10.1016/j.cell.2019.05.031 · Cited by 15,453
ggplot2: Elegant Graphics for Data Analysis
Wickham, H. (2009) · doi:10.1007/978-0-387-98141-3 · Cited by 14,447
Integrating single-cell transcriptomic data across different conditions, technologies, and species
Butler, A., Hoffman, P., Smibert, P., Papalexi, E., & Satija, R. (2018) · Nature Biotechnology · doi:10.1038/nbt.4096 · Cited by 13,174
Cited by
Eleven grand challenges in single-cell data science
Lähnemann, D., Köster, J., Szczurek, E., McCarthy, D. J., Hicks, S. C., Robinson, M. D., Vallejos, C. A., Campbell, K. R., Beerenwinkel, N., Mahfouz, A., et al. (2020) · Genome Biology · doi:10.1186/s13059-020-1926-6 · Cited by 1,327
Self-citationTranscriptome-scale spatial gene expression in the human dorsolateral prefrontal cortex
Maynard, K. R., Collado-Torres, L., Weber, L. M., Uytingco, C., Barry, B. K., Williams, S. R., Catallini, J. L., Tran, M. N., Besich, Z., Tippani, M., et al. (2021) · Nature Neuroscience · doi:10.1038/s41593-020-00787-0 · Cited by 1,222
Confronting false discoveries in single-cell differential expression
Squair, J. W., Gautier, M., Kathe, C., Anderson, M. A., James, N. D., Hutson, T. H., Hudelle, R., Qaiser, T., Matson, K. J. E., Barraud, Q., et al. (2021) · doi:10.1101/2021.03.12.435024 · Cited by 1,086
Orchestrating single-cell analysis with Bioconductor
Amezquita, R. A., Lun, A. T. L., Becht, E., Carey, V. J., Carpp, L. N., Geistlinger, L., Marini, F., Rue-Albrecht, K., Risso, D., Soneson, C., et al. (2020) · Nature Methods · doi:10.1038/s41592-019-0654-x · Cited by 945
Self-citationAn integrated cell atlas of the lung in health and disease
Sikkema, L., Ramírez-Suástegui, C., Strobl, D. C., Gillett, T. E., Zappia, L., Madissoon, E., Markov, N. S., Zaragosi, L.-E., Ji, Y., Ansari, M., et al. (2023) · Nature Medicine · doi:10.1038/s41591-023-02327-2 · Cited by 854
Metadata
- Authors
- Crowell, H. L., Soneson, C., Germain, P.-L., Calini, D., Collin, L., Raposo, C., Malhotra, D., & Robinson, M. D.
- Affiliations
- SIB Swiss Institute of Bioinformatics (CH)
- University of Zurich (CH)
- F. Hoffmann-La Roche AG (CH)
- Corresponding author
- Robinson, Mark D.
- ORCID
- Venue
- Nature Communications
- Published
- 2020-11-30
- Volume
- 11
- Issue
- 1
- Pages
- 6077-6077
- ISSN
- 2041-1723 (ISSN-L)
- PMC
- PMC7705760
- OpenAlex
- W3108941787
- Cited by
- 515
- References
- 75
- Citations by year
- 2026: 109 · 2025: 99 · 2024: 80 · 2023: 84 · 2022: 54 · 2021: 61 · 2020: 26
- FWCI
- 18.90
- Type
- journal article
- Language
- en
- Open access
- gold
- doi.org
- Licence
- cc-by
- creativecommons.org/licenses/by/4.0 (tdm)
- creativecommons.org/licenses/by/4.0 (vor)
- Locations
- Nature Communications (publishedVersion, cc-by)
- bioRxiv (Cold Spring Harbor Laboratory) (acceptedVersion, cc-by)
- PubMed Central (publishedVersion, cc-by)
- PubMed (publishedVersion)
- Zurich Open Repository and Archive (University of Zurich) (acceptedVersion, cc-by)
- RePEc: Research Papers in Economics (submittedVersion)
- DOAJ (DOAJ: Directory of Open Access Journals) (submittedVersion, cc-by-sa)
- Repository for Publications and Research Data (ETH Zurich) (submittedVersion, cc-by)
- Zurich Open Repository and Archive (University of Zurich) (submittedVersion, cc-by)
- ETH Zürich Research Collection (cc-by)
- Zurich Open Repository and Archive (University of Zurich)
- Funders
- Schweizerischer Nationalfonds zur Förderung der Wissenschaftlichen Forschung (310030_175841, CRSII5_177208)
- Silicon Valley Community Foundation (2018-182828)
- Topics
- Life Sciences › Biochemistry, Genetics and Molecular Biology › Molecular Biology › Single-cell and spatial transcriptomics
- Life Sciences › Biochemistry, Genetics and Molecular Biology › Molecular Biology › Gene expression and cancer classification
- Life Sciences › Biochemistry, Genetics and Molecular Biology › Molecular Biology › Genomics and Phylogenetic Studies
- Keywords
- mouse cortex, lipopolysaccharide response
- MeSH terms
- Animals, Cerebellar Cortex, Computer Simulation, Lipopolysaccharides, Male, Software, Models, Statistical, Signal Transduction, Cluster Analysis, Sequence Analysis, RNA, Computational Biology, RNA, Small Cytoplasmic, Gene Expression Profiling, Mice, Single-Cell Analysis, Transcriptome
About these checks
Registry, retraction, Cites and statistics results are computed, not judged, with one exception: a printed reference that no index lists is read once by a model before it counts as a citation error. Claims are extracted by a model and kept only when their quote appears verbatim in the text; each cited source is then checked, with a model’s help, for whether it says what the claim relies on. Those verdicts can be wrong — read the claim’s quote and the cited source before relying on one.
Statistics and arithmetic are recomputed, not judged.
Confidence bands are shown only for fields calibrated on our annotated test set. None is calibrated yet, so no band is shown.
What counts as a claim ›How we measure confidence ›How we check this ›
Are you an author, or do you see a problem with this page? Request a review
How to cite
Cite CoChat for the checks on this page, and the paper for its own findings.
- This page
- CoChat. (2026). Citation check: muscat detects subpopulation-specific state transitions from multi-sample multi-condition single-cell transcriptomics data. https://app.cochat.ai/papers/10.1038/s41467-020-19894-4
- The paper
- Crowell, H. L., Soneson, C., Germain, P.-L., Calini, D., Collin, L., Raposo, C., Malhotra, D., & Robinson, M. D. (2020). muscat detects subpopulation-specific state transitions from multi-sample multi-condition single-cell transcriptomics data. Nature Communications. https://doi.org/10.1038/s41467-020-19894-4
Data sources
Bibliographic data: Semantic Scholar, OpenAlex, Crossref.
Contains information from the Semantic Scholar Academic Graph Datasets, made available under the ODC Attribution License (ODC-BY 1.0).
Semantic Scholar’s data is described in: Kinney, R., et al. (2023). The Semantic Scholar Open Data Platform. arXiv:2301.10140.
