Cited by 101Alzheimer's disease research and treatmentsNeuroinflammation and Neurodegeneration MechanismsCell Adhesion Molecules Research

The DOI matches its Crossref record; 75 of the 75 references it cites were found in a registry or an index.

Filamentous recombinant human Tau activates primary astrocytes via an integrin receptor complex

Open access
Wang, Peng, Ye, Yihong·2021·Nature Communications

Published version of a preprint

Abstract

Microtubule-associated protein Tau can form protein aggregates transmissible within the brain, correlating with the progression of tauopathies in humans. The transmission of aggregates requires neuron-released Tau to interact with surface receptors on target cells. However, the underlying molecular mechanisms in astrocytes and downstream effects are unclear. Here, using a spatially resolved proteomic mapping strategy, we show that integrin αV/β1 receptor binds recombinant human Tau, mediating the entry of Tau fibrils in astrocytes. The binding of distinct Tau species to the astrocytic αV/β1 receptor differentially activate integrin signaling. Furthermore, Tau-mediated activation of integrin signaling results in NFκB activation, causing upregulation of pro-inflammatory cytokines and chemokines, induction of a sub-group of neurotoxic astrocytic markers, and release of neurotoxic factors. Our findings suggest that filamentous recombinant human Tau-mediated activation of integrin signaling induces astrocyte conversion towards a neurotoxic state, providing a mechanistic insight into tauopathies.

Overview

The claims and statistics of this paper haven’t been checked yet.

Run the check — free, no account needed. It reads the open-access text and checks the sources it cites.

A few free checks a day · papers already verified open instantly · results are public

Integrity signals

Registry

Crossref · 10.1038/s41467-020-20322-w

Cites

75 of 75 references verified0 citation errors · 0 not checkable

Statistics

Figures

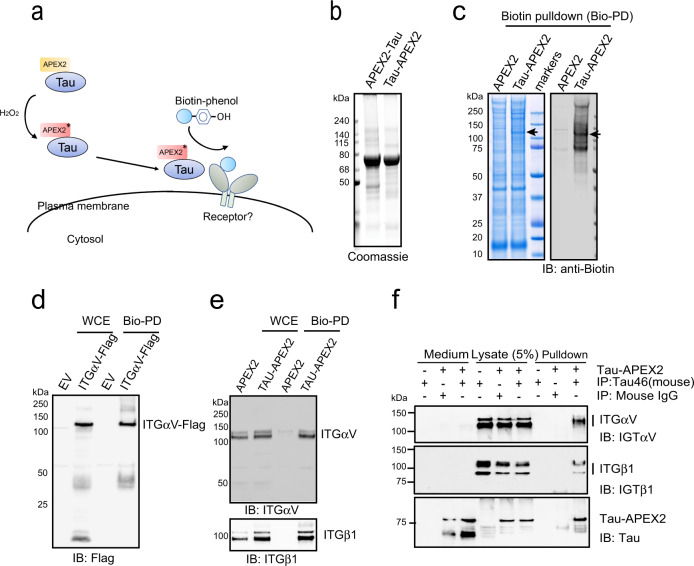
Fig. 1 Identification of integrin αV/β1 as a Tau interactor in primary astrocytes. a Schematic overview of the proximity-based proteomic mapping strategy. Tau-APEX2 (200 nM) is bound to the cell surface. Biotinylation was initiated by incubating cells with biotin-phenol (BP) in the presence of H2O2 for 4 min. Biotinylated proteins were then purified by affinity chromatography using streptavidin resin. b Coomassie blue staining of purified Tau proteins. c Coomassie blue staining (left) and immunoblotting (IB) (right) of biotinylated proteins from primary astrocytes incubated with APEX2 or Tau-APEX2. The arrow indicates a 120 kDa protein detected in Tau-APEX2-treated cells. d, e Validation of Tau-APEX2-mediated biotinylation of ITGαV/β1. d Tau-APEX2 was incubated with HEK293T cells transfected with either an empty vector (EV) or ITGαV-Flag. Whole cell extracts (WCE) were either directly analyzed by immunoblotting or first subjected to biotin pulldown (Bio-PD) before immunoblotting. e Whole cell extracts (WCE) from primary astrocytes treated with either APEX2 or Tau-APEX2 were analyzed directly by immunoblotting or first subjected to biotin pulldown before immunoblotting. f Co-immunoprecipitation of Tau-APEX2 with ITGαVβ1. Astrocytes were treated with Tau-APEX2 (200 nM) or PBS as a control for 30 min on ice. Cells were lysed in an NP40-containing lysis buffer. Cell lysates were subjected to immunoprecipitation with either a control IgG or a Tau specific antibody (Tau-46). Both cell lysates and precipitated proteins were analyzed by immunoblotting. Where indicated, a fraction of the remaining medium was also analyzed by immunoblotting to show input.
Fig. 1 Identification of integrin αV/β1 as a Tau interactor in primary astrocytes. a Schematic overview of the proximity-based proteomic mapping strategy. Tau-APEX2 (200 nM) is bound to the cell surface. Biotinylation was initiated by incubating cells with biotin-phenol (BP) in the presence of H2O2 for 4 min. Biotinylated proteins were then purified by affinity chromatography using streptavidin resin. b Coomassie blue staining of purified Tau proteins. c Coomassie blue staining (left) and immunoblotting (IB) (right) of biotinylated proteins from primary astrocytes incubated with APEX2 or Tau-APEX2. The arrow indicates a 120 kDa protein detected in Tau-APEX2-treated cells. d, e Validation of Tau-APEX2-mediated biotinylation of ITGαV/β1. d Tau-APEX2 was incubated with HEK293T cells transfected with either an empty vector (EV) or ITGαV-Flag. Whole cell extracts (WCE) were either directly analyzed by immunoblotting or first subjected to biotin pulldown (Bio-PD) before immunoblotting. e Whole cell extracts (WCE) from primary astrocytes treated with either APEX2 or Tau-APEX2 were analyzed directly by immunoblotting or first subjected to biotin pulldown before immunoblotting. f Co-immunoprecipitation of Tau-APEX2 with ITGαVβ1. Astrocytes were treated with Tau-APEX2 (200 nM) or PBS as a control for 30 min on ice. Cells were lysed in an NP40-containing lysis buffer. Cell lysates were subjected to immunoprecipitation with either a control IgG or a Tau specific antibody (Tau-46). Both cell lysates and precipitated proteins were analyzed by immunoblotting. Where indicated, a fraction of the remaining medium was also analyzed by immunoblotting to show input.CC BY · PubMed Central
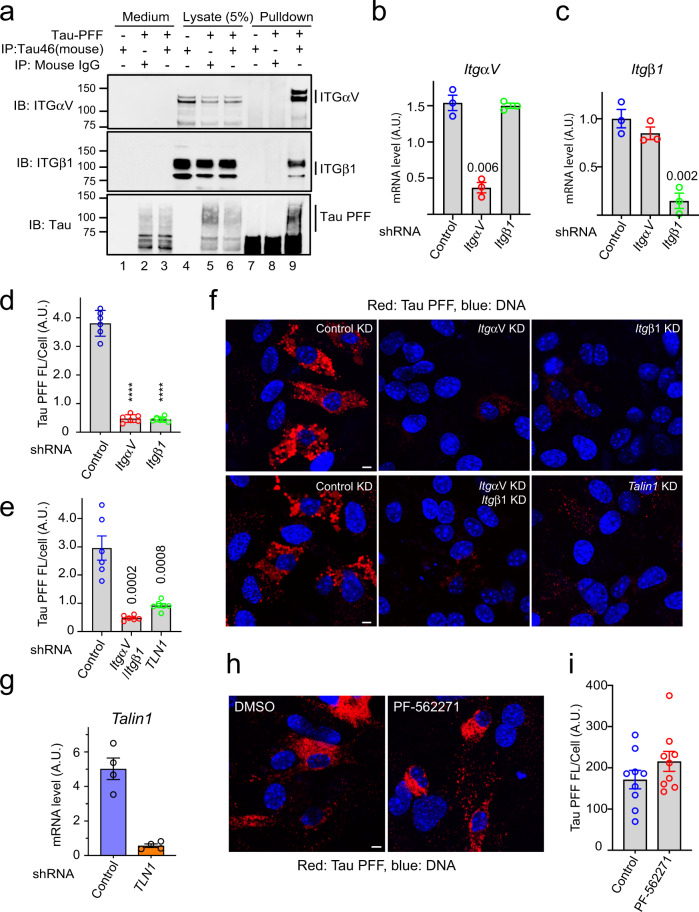
Fig. 2 Integrin αV/β1 and Talin1 are required for Tau PFF uptake in astrocytes. a Co-immunoprecipitation of Tau PFF and ITGαV/β1. Astrocytes were treated with Tau PFFs or PBS as a control. Cell lysates were subjected to immunoprecipitation with either a control IgG or a Tau specific antibody (Tau-46). Both lysates and precipitated proteins were analyzed by immunoblotting. Where indicated, a fraction of the medium collected after the binding was also analyzed by immunoblotting. b, c Quantification (mean ± SEM) of mRNA expression by qRT-PCR performed 72 h postlentiviral infection confirmed the knockdown efficiency of ITGαV (b), β1 (c). A.U. arbitrary unit. n = 3 biologically independent experiments. The numbers above indicate p values determined by two-tailed unpaired t-test. d–g Astrocytic uptake of Tau PFF is dependent on ITGαV/β1 and Talin1. f Representative images of lentivirus-treated astrocytes incubated with Alexa594 (Red)-labeled Tau-PFF (200 nM) for 2 h. Cells were stained with Hoechst to label the nuclei (blue). Scale bar, 5 μm. d, e Quantification of the relative Tau PFF fluorescence intensity/cell. Mean ± SEM, n = 3 biologically independent experiments. The numbers and asterisks above indicate p values (****p < 0.0001) determined by two-tailed unpaired t-test. Dots represent the average fluorescence intensity/cell from images (>20 cells/image) acquired. g As in b, except that Talin1 mRNA expression was determined after Talin1 knockdown. Mean ± SEM, n = 4 biologically independent samples. h, i FAK is not required for Tau PFF uptake. h Representative images of DMSO or PF-562271-treated astrocytes (10 µM) incubated with labeled Tau-PFF (200 nM) after 2 h. Scale bar, 5 μm. i Quantification of Tau PFF uptake in h. Mean ± SEM, n = 3 biologically independent experiments. Dots represent average fluorescence intensity/cell from images acquired.
Fig. 2 Integrin αV/β1 and Talin1 are required for Tau PFF uptake in astrocytes. a Co-immunoprecipitation of Tau PFF and ITGαV/β1. Astrocytes were treated with Tau PFFs or PBS as a control. Cell lysates were subjected to immunoprecipitation with either a control IgG or a Tau specific antibody (Tau-46). Both lysates and precipitated proteins were analyzed by immunoblotting. Where indicated, a fraction of the medium collected after the binding was also analyzed by immunoblotting. b, c Quantification (mean ± SEM) of mRNA expression by qRT-PCR performed 72 h postlentiviral infection confirmed the knockdown efficiency of ITGαV (b), β1 (c). A.U. arbitrary unit. n = 3 biologically independent experiments. The numbers above indicate p values determined by two-tailed unpaired t-test. d–g Astrocytic uptake of Tau PFF is dependent on ITGαV/β1 and Talin1. f Representative images of lentivirus-treated astrocytes incubated with Alexa594 (Red)-labeled Tau-PFF (200 nM) for 2 h. Cells were stained with Hoechst to label the nuclei (blue). Scale bar, 5 μm. d, e Quantification of the relative Tau PFF fluorescence intensity/cell. Mean ± SEM, n = 3 biologically independent experiments. The numbers and asterisks above indicate p values (****p < 0.0001) determined by two-tailed unpaired t-test. Dots represent the average fluorescence intensity/cell from images (>20 cells/image) acquired. g As in b, except that Talin1 mRNA expression was determined after Talin1 knockdown. Mean ± SEM, n = 4 biologically independent samples. h, i FAK is not required for Tau PFF uptake. h Representative images of DMSO or PF-562271-treated astrocytes (10 µM) incubated with labeled Tau-PFF (200 nM) after 2 h. Scale bar, 5 μm. i Quantification of Tau PFF uptake in h. Mean ± SEM, n = 3 biologically independent experiments. Dots represent average fluorescence intensity/cell from images acquired.CC BY · PubMed Central
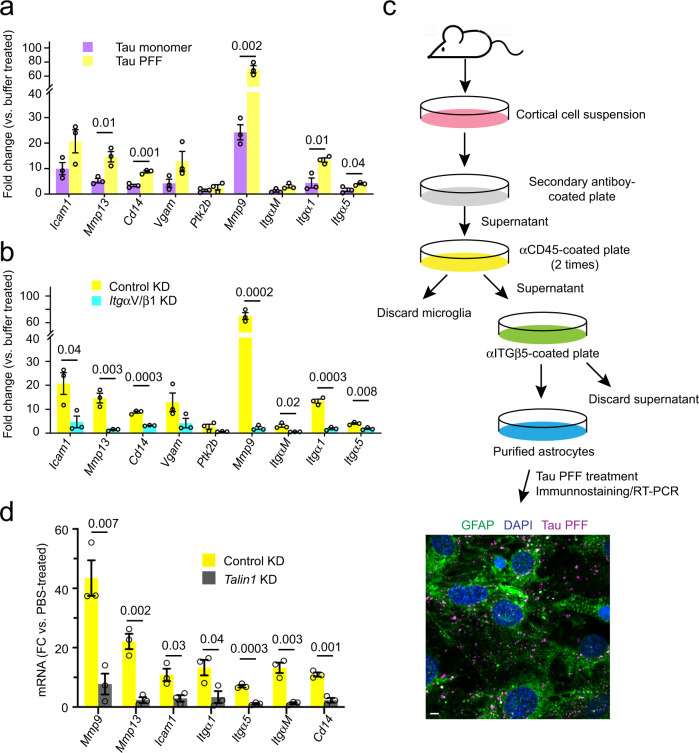
Fig. 3 Monomeric and filamentous Tau differentially activate integrin signaling. a, b Tau PFF activates integrin signaling in an ITGαV/β1 dependent manner. qRT-PCR analyses of the expression of a collection of integrin target genes in primary astrocytes. Cells were first infected with either control or ITGαV/β1 shRNA for 72 h and then treated with PBS, monomeric Tau, or Tau PFFs (200 nM) for 6 h. Shown are fold changes (FC) normalized to PBS-treated samples. a A comparison between Tau monomer and PFF. b A comparison of Tau PFF treatment in control vs. ITGαV/β1 knockdown cells. Mean ± SEM, n = 3 independent experiments, each with two technical repeats. c A schematic overview of the immuno-panning strategy for purification of astrocytes using anti-ITGβ5 antibodies. Briefly, cortical cell suspensions were passed successively over secondary antibody-coated and anti-CD45-coated plates to remove macrophages and microglia, and then plated in a positive selection panning plate for astrocytes (anti-ITGβ5 coated). The lower panel shows a representative immunofluorescence image of purified astrocytes treated with Tau PFF Alexa594 (200 nM) (Magenta) 1 h and then stained with anti-GFAP antibodies (Green) and Hoechst (Blue). Scale bar, 5 μm. d Talin1 is required for Tau PFF-induced integrin signaling. As in b, except that immunopurified astrocytes were first infected with either control- or Talin1 shRNA-expressing lentivirus and then treated with Tau PFF. Mean ± SEM n = 3 independent experiments, each with two technical repeats. The numbers and asterisks above indicate p value (****p < 0.0001) determined by two-tailed unpaired t-test.
Fig. 3 Monomeric and filamentous Tau differentially activate integrin signaling. a, b Tau PFF activates integrin signaling in an ITGαV/β1 dependent manner. qRT-PCR analyses of the expression of a collection of integrin target genes in primary astrocytes. Cells were first infected with either control or ITGαV/β1 shRNA for 72 h and then treated with PBS, monomeric Tau, or Tau PFFs (200 nM) for 6 h. Shown are fold changes (FC) normalized to PBS-treated samples. a A comparison between Tau monomer and PFF. b A comparison of Tau PFF treatment in control vs. ITGαV/β1 knockdown cells. Mean ± SEM, n = 3 independent experiments, each with two technical repeats. c A schematic overview of the immuno-panning strategy for purification of astrocytes using anti-ITGβ5 antibodies. Briefly, cortical cell suspensions were passed successively over secondary antibody-coated and anti-CD45-coated plates to remove macrophages and microglia, and then plated in a positive selection panning plate for astrocytes (anti-ITGβ5 coated). The lower panel shows a representative immunofluorescence image of purified astrocytes treated with Tau PFF Alexa594 (200 nM) (Magenta) 1 h and then stained with anti-GFAP antibodies (Green) and Hoechst (Blue). Scale bar, 5 μm. d Talin1 is required for Tau PFF-induced integrin signaling. As in b, except that immunopurified astrocytes were first infected with either control- or Talin1 shRNA-expressing lentivirus and then treated with Tau PFF. Mean ± SEM n = 3 independent experiments, each with two technical repeats. The numbers and asterisks above indicate p value (****p < 0.0001) determined by two-tailed unpaired t-test.CC BY · PubMed Central
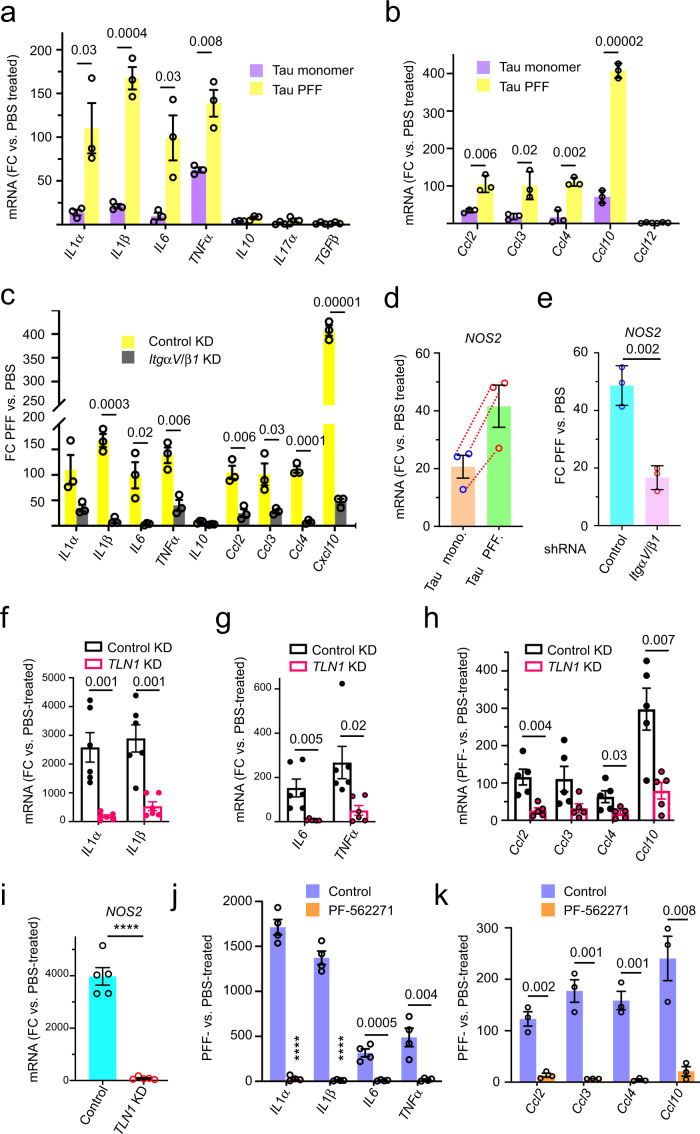
Fig. 4 Tau PFF induces inflammation in astrocytes via the integrin pathway. a–c Tau PFF induces astrocytic inflammation in an ITGαV/β1 dependent manner. qRT-PCR analyses of the expression of inflammation-associated cytokine and chemokine genes in primary astrocytes. Cells were first infected with either control shRNA (a, b) or control and ITGαV/β1 shRNA (c) for 72 h and then incubated with PBS, monomeric Tau or Tau PFFs (200 nM) for 6 h. Shown are fold changes (FC) normalized to PBS-treated cells. Mean ± SEM, n = 3 independent experiments, each with two technical repeats. d, e Tau PFF induces NOS2 expression in an ITGαV/β1 dependent manner. d As in a, except that NOS2 mRNA was analyzed. Mean ± SEM, n = 3. Dashed lines indicate individual experiment. e As in c, except that NOS2 mRNA was analyzed. The number indicates p value determined by two-tailed unpaired t-test. f–h qRT-PCR analyses of the expression of pro-inflammation-related cytokines (f, g) and chemokines (h) in immunopurified astrocytes. Cells were infected with either a control or Talin1 (TLN1)-specific shRNA prior to the treatment with either PBS or Tau PFFs (200 nM) for 6 h. Fold changes (FC) were normalized to PBS-treated samples. Mean ± SEM, n = 6 (f, g) or n = 5 (h) independent experiments, each with two technical duplicates. i As in f, except that NOS2 mRNA was analyzed. Mean ± SEM, n = 5 independent experiments. j, k qRT-PCR analyses of the expression of the indicated pro-inflammation cytokines (j) or chemokines (k) in immunopurified astrocytes that were treated with DMSO or PF-562271 (1 μM) for 1 h before incubation with PBS or Tau PFF (200 nM) for 6 h. Fold changes (FC) were normalized to PBS-treated samples. Mean ± SEM, n = 4 (j) or 3 (k) independent experiments each with two technical duplicates. The numbers and asterisks above indicate p value (****p < 0.0001) determined by two-tailed unpaired t-test.
Fig. 4 Tau PFF induces inflammation in astrocytes via the integrin pathway. a–c Tau PFF induces astrocytic inflammation in an ITGαV/β1 dependent manner. qRT-PCR analyses of the expression of inflammation-associated cytokine and chemokine genes in primary astrocytes. Cells were first infected with either control shRNA (a, b) or control and ITGαV/β1 shRNA (c) for 72 h and then incubated with PBS, monomeric Tau or Tau PFFs (200 nM) for 6 h. Shown are fold changes (FC) normalized to PBS-treated cells. Mean ± SEM, n = 3 independent experiments, each with two technical repeats. d, e Tau PFF induces NOS2 expression in an ITGαV/β1 dependent manner. d As in a, except that NOS2 mRNA was analyzed. Mean ± SEM, n = 3. Dashed lines indicate individual experiment. e As in c, except that NOS2 mRNA was analyzed. The number indicates p value determined by two-tailed unpaired t-test. f–h qRT-PCR analyses of the expression of pro-inflammation-related cytokines (f, g) and chemokines (h) in immunopurified astrocytes. Cells were infected with either a control or Talin1 (TLN1)-specific shRNA prior to the treatment with either PBS or Tau PFFs (200 nM) for 6 h. Fold changes (FC) were normalized to PBS-treated samples. Mean ± SEM, n = 6 (f, g) or n = 5 (h) independent experiments, each with two technical duplicates. i As in f, except that NOS2 mRNA was analyzed. Mean ± SEM, n = 5 independent experiments. j, k qRT-PCR analyses of the expression of the indicated pro-inflammation cytokines (j) or chemokines (k) in immunopurified astrocytes that were treated with DMSO or PF-562271 (1 μM) for 1 h before incubation with PBS or Tau PFF (200 nM) for 6 h. Fold changes (FC) were normalized to PBS-treated samples. Mean ± SEM, n = 4 (j) or 3 (k) independent experiments each with two technical duplicates. The numbers and asterisks above indicate p value (****p < 0.0001) determined by two-tailed unpaired t-test.CC BY · PubMed Central
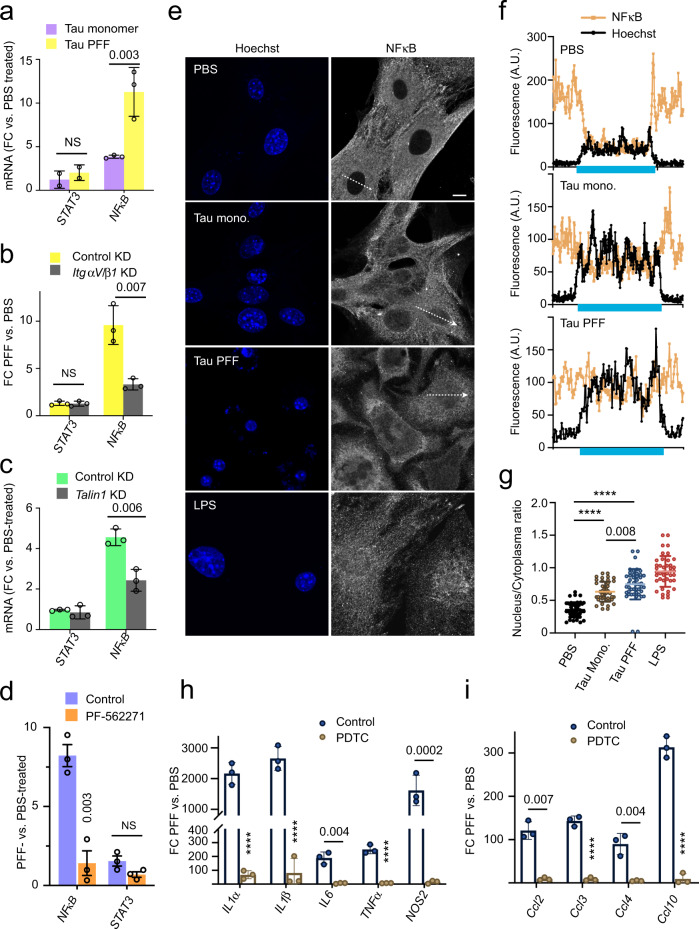
Fig. 5 Tau PFF-induced inflammation is dependent on NFκB activation. a qRT-PCR analyses of the expression of NFκB and STAT3 in primary astrocytes exposed to PBS, monomeric Tau or Tau PFFs (200 nM) for 6 h. Shown are fold changes (FC) normalized to PBS-treated cells. Mean ± SEM, n = 3 independent experiments each with two technical repeats. b, c As in a, except that cells were first infected with control or ITGαV/β1 shRNA (b), or Talin1 shRNA (c) for 72 h and then incubated with PBS or Tau PFFs (200 nM) for 6 h. Mean ± SEM, n = 3 independent experiments. d As in b, except that control-treated or PF-562271-treated astrocytes were used. Mean ± SEM, n = 3 independent experiments. e–g Tau PFF increases NFκB nuclear translocation. e Representative confocal images of astrocytes treated with either PBS, Tau monomer, PFFs (200 nM) for 4 h or LPS as a positive control (5 μM) for 30 min. Cell were fixed and stained with a NFκB antibody and Hoechst (blue). The graphs in f show the fluorescence intensity profile along the lines indicated in e. The blue bars indicate nuclear regions. g Quantification of the nuclear/cytoplasmic NFκB ratio in randomly selected cells. Mean ± SEM, n = 3 biologically independent experiments. h, i Tau PFF-induced inflammation is suppressed by a NFκB inhibitor. As in d, except that cells were pre-treated with PDTC (90 μM) for 1 h before Tau PFF and PBS treatment and that the indicated genes were analyzed. Mean ± SEM, n = 3 independent experiments. The numbers and asterisks above indicate p value (****p < 0.0001) determined by two-tailed unpaired t-test.
Fig. 5 Tau PFF-induced inflammation is dependent on NFκB activation. a qRT-PCR analyses of the expression of NFκB and STAT3 in primary astrocytes exposed to PBS, monomeric Tau or Tau PFFs (200 nM) for 6 h. Shown are fold changes (FC) normalized to PBS-treated cells. Mean ± SEM, n = 3 independent experiments each with two technical repeats. b, c As in a, except that cells were first infected with control or ITGαV/β1 shRNA (b), or Talin1 shRNA (c) for 72 h and then incubated with PBS or Tau PFFs (200 nM) for 6 h. Mean ± SEM, n = 3 independent experiments. d As in b, except that control-treated or PF-562271-treated astrocytes were used. Mean ± SEM, n = 3 independent experiments. e–g Tau PFF increases NFκB nuclear translocation. e Representative confocal images of astrocytes treated with either PBS, Tau monomer, PFFs (200 nM) for 4 h or LPS as a positive control (5 μM) for 30 min. Cell were fixed and stained with a NFκB antibody and Hoechst (blue). The graphs in f show the fluorescence intensity profile along the lines indicated in e. The blue bars indicate nuclear regions. g Quantification of the nuclear/cytoplasmic NFκB ratio in randomly selected cells. Mean ± SEM, n = 3 biologically independent experiments. h, i Tau PFF-induced inflammation is suppressed by a NFκB inhibitor. As in d, except that cells were pre-treated with PDTC (90 μM) for 1 h before Tau PFF and PBS treatment and that the indicated genes were analyzed. Mean ± SEM, n = 3 independent experiments. The numbers and asterisks above indicate p value (****p < 0.0001) determined by two-tailed unpaired t-test.CC BY · PubMed Central
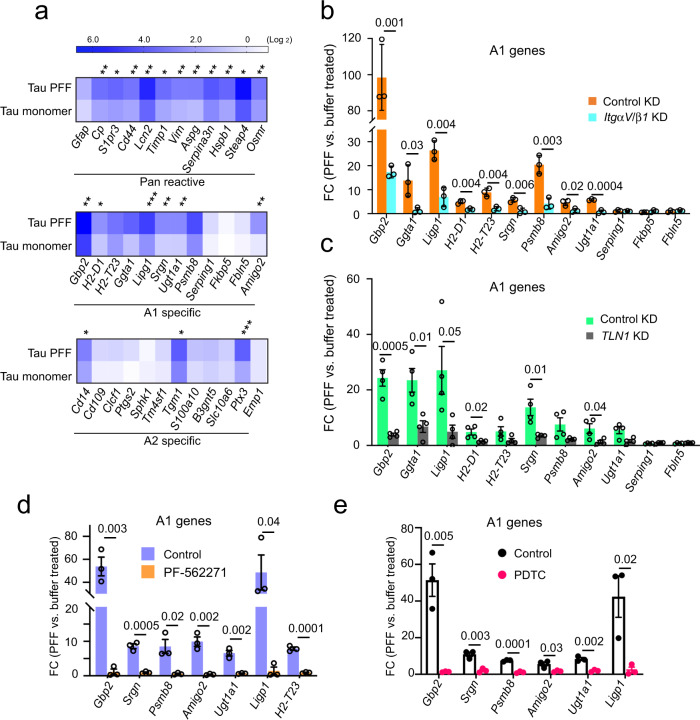
Fig. 6 Tau PFF converts astrocytes to a neurotoxic state in an integrin-dependent manner. a A heat map shows the expression of pan-reactive, A1 and A2 signature genes in Tau monomer- and PFF-treated primary astrocytes (200 nM, 6 h), which is normalized to PBS-treated cells. Shown is the average of three independent experiments. Asterisks indicate p value (*p < 0.05; **p < 0.01; ***p < 0.001) from two-tailed unpaired t-test. b The expression of the indicated A1 genes were analyzed by qRT-PCR from PBS- or Tau PFF-treated (200 nM, 6 h) astrocytes, which had been infected with lentiviruses (72 h) expressing control or ITGαV/β1 shRNAs. Fold changes (FC) were normalized to PBS-treated samples. Mean ± SEM, n = 3 independent experiments each with two technical duplicates. c As in b, except that immunopurified astrocytes infected with control-expressing or Talin1 (TLN1) shRNA-expressing lentiviruses were used. Mean ± SEM, n = 4 biologically independent samples. d As in c, except that cells were treated with DMSO or PF-562271 (1 μM, 1 h) instead of lentivirus prior to PBS or Tau PFF treatment. Mean ± SEM, n = 3 biologically independent samples, each with two technical duplicates. e Tau PFF-induced A1 genes is suppressed by a NFκB inhibitor. As in d, except that cells were treated with PDTC (90 μM) for 1 h before Tau PFF and PBS treatment. Mean ± SEM, n = 3 biologically independent samples. The numbers above indicate p value determined by two-tailed unpaired t-test.
Fig. 6 Tau PFF converts astrocytes to a neurotoxic state in an integrin-dependent manner. a A heat map shows the expression of pan-reactive, A1 and A2 signature genes in Tau monomer- and PFF-treated primary astrocytes (200 nM, 6 h), which is normalized to PBS-treated cells. Shown is the average of three independent experiments. Asterisks indicate p value (*p < 0.05; **p < 0.01; ***p < 0.001) from two-tailed unpaired t-test. b The expression of the indicated A1 genes were analyzed by qRT-PCR from PBS- or Tau PFF-treated (200 nM, 6 h) astrocytes, which had been infected with lentiviruses (72 h) expressing control or ITGαV/β1 shRNAs. Fold changes (FC) were normalized to PBS-treated samples. Mean ± SEM, n = 3 independent experiments each with two technical duplicates. c As in b, except that immunopurified astrocytes infected with control-expressing or Talin1 (TLN1) shRNA-expressing lentiviruses were used. Mean ± SEM, n = 4 biologically independent samples. d As in c, except that cells were treated with DMSO or PF-562271 (1 μM, 1 h) instead of lentivirus prior to PBS or Tau PFF treatment. Mean ± SEM, n = 3 biologically independent samples, each with two technical duplicates. e Tau PFF-induced A1 genes is suppressed by a NFκB inhibitor. As in d, except that cells were treated with PDTC (90 μM) for 1 h before Tau PFF and PBS treatment. Mean ± SEM, n = 3 biologically independent samples. The numbers above indicate p value determined by two-tailed unpaired t-test.CC BY · PubMed Central
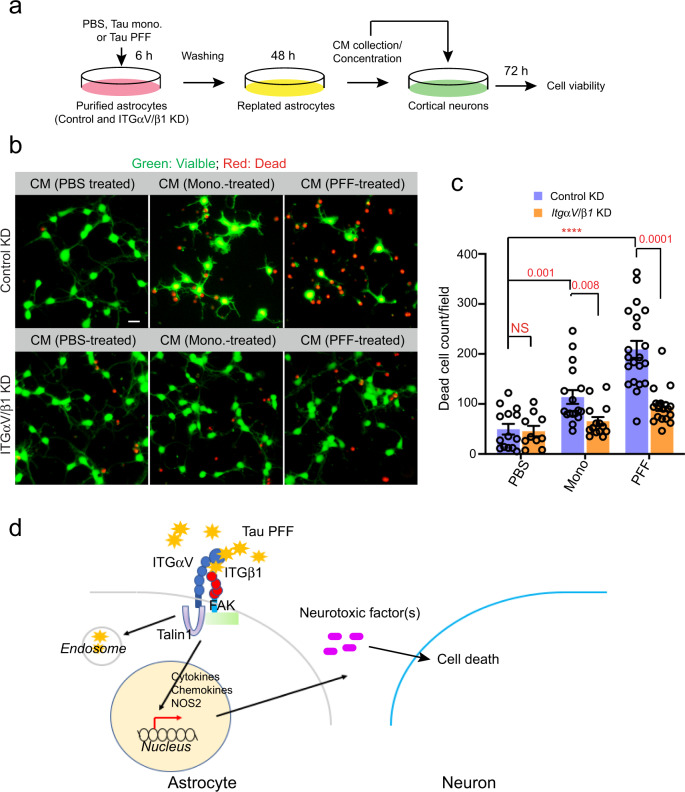
Fig. 7 Tau PFF-treated astrocytes release a neurotoxic factor(s) via ITGαV/β1 activation. a Scheme of the cell toxicity assay. b, c Primary cortical neurons at DIV 10 were treated with the indicated condition medium (CM) for 72 h and stained with a green-fluorescent dye calcein-AM to label viable cells and a red-fluorescent dye ethidium homodimer-1 to label dead cells. b Representative images. Scale bar, 10 μm. c Quantification of dead cells labeled by ethidium homodimer-1 in randomly selected fields. Mean ± SEM, n = 3 biologically independent samples. The numbers and asterisks above indicate p value (****p < 0.0001) determined by two-tailed unpaired t-test. d A working model showing the interplays between Tau-PFF, astrocytes and neurons.
Fig. 7 Tau PFF-treated astrocytes release a neurotoxic factor(s) via ITGαV/β1 activation. a Scheme of the cell toxicity assay. b, c Primary cortical neurons at DIV 10 were treated with the indicated condition medium (CM) for 72 h and stained with a green-fluorescent dye calcein-AM to label viable cells and a red-fluorescent dye ethidium homodimer-1 to label dead cells. b Representative images. Scale bar, 10 μm. c Quantification of dead cells labeled by ethidium homodimer-1 in randomly selected fields. Mean ± SEM, n = 3 biologically independent samples. The numbers and asterisks above indicate p value (****p < 0.0001) determined by two-tailed unpaired t-test. d A working model showing the interplays between Tau-PFF, astrocytes and neurons.CC BY · PubMed Central

Verification

Claims the paper makes

The claims and statistics of this paper haven’t been checked yet.

Run the check — free, no account needed. It reads the open-access text and checks the sources it cites.

A few free checks a day · papers already verified open instantly · results are public

Claims other papers make about this one

Each is checked against this paper’s own text: does it say what the citing paper says it does?

Self-check

Percentages, sums and reported differences re-computed from the paper’s own numbers.

The self-check needs the paper’s full text.

Citations

Cites

Show all 75 references

Cited by

Sorted by citations

See all 101

Metadata

Authors
Wang, P., & Ye, Y.
Affiliations
National Institutes of Health (US)
Corresponding author
Ye, Yihong
Venue
Nature Communications
Published
2021-01-04
Volume
12
Issue
1
Pages
95-95
ISSN
2041-1723 (ISSN-L)
OpenAlex
W3118652952
Cited by
93
References
75
Citations by year
2026: 11 · 2025: 19 · 2024: 17 · 2023: 15 · 2022: 20 · 2021: 10
FWCI
10.98
Type
journal article
Language
en
Open access
Locations
  • Nature Communications (publishedVersion, cc-by)
  • bioRxiv (Cold Spring Harbor Laboratory) (acceptedVersion, cc-by-nc-nd)
  • Europe PMC (PubMed Central) (publishedVersion, other-oa)
  • PubMed Central (publishedVersion, cc-by)
  • PubMed (publishedVersion)
  • RePEc: Research Papers in Economics (submittedVersion)
  • DOAJ (DOAJ: Directory of Open Access Journals) (submittedVersion, cc-by-sa)
Funders
National Institute of Diabetes and Digestive and Kidney Diseases
Topics
  • Life Sciences › Neuroscience › Cellular and Molecular Neuroscience › Alzheimer's disease research and treatments
  • Life Sciences › Neuroscience › Neurology › Neuroinflammation and Neurodegeneration Mechanisms
  • Health Sciences › Medicine › Immunology and Allergy › Cell Adhesion Molecules Research
Keywords
tau protein, tauopathy, astrocytes, integrin αvβ1, integrin signaling, tau fibrils, NF-κB activation, inflammatory cytokines, chemokines, neuroinflammation
MeSH terms
Animals, Astrocytes, Cells, Cultured, Humans, Inflammation, Mice, Inbred C57BL, Neurons, Protein Binding, Recombinant Proteins, Signal Transduction, NF-kappa B, Talin, tau Proteins, Receptors, Vitronectin, Heparan Sulfate Proteoglycans, STAT3 Transcription Factor, Mice, Focal Adhesion Protein-Tyrosine Kinases, HEK293 Cells

About these checks

Registry, retraction, Cites and statistics results are computed, not judged, with one exception: a printed reference that no index lists is read once by a model before it counts as a citation error. Claims are extracted by a model and kept only when their quote appears verbatim in the text; each cited source is then checked, with a model’s help, for whether it says what the claim relies on. Those verdicts can be wrong — read the claim’s quote and the cited source before relying on one.

Statistics and arithmetic are recomputed, not judged.

Confidence bands are shown only for fields calibrated on our annotated test set. None is calibrated yet, so no band is shown.

What counts as a claim ›How we measure confidence ›How we check this ›

Are you an author, or do you see a problem with this page? Request a review