Cited by 230RNA Research and SplicingSingle-cell and spatial transcriptomicsGenomics and Phylogenetic Studies

The DOI matches its Crossref record; 93 of the 94 references it cites were found in a registry or an index, and 1 are not checked yet.

A spatially resolved brain region- and cell type-specific isoform atlas of the postnatal mouse brain

Open access

Published version of a preprint

Abstract

Splicing varies across brain regions, but the single-cell resolution of regional variation is unclear. We present a single-cell investigation of differential isoform expression (DIE) between brain regions using single-cell long-read sequencing in mouse hippocampus and prefrontal cortex in 45 cell types at postnatal day 7 ( www.isoformAtlas.com ). Isoform tests for DIE show better performance than exon tests. We detect hundreds of DIE events traceable to cell types, often corresponding to functionally distinct protein isoforms. Mostly, one cell type is responsible for brain-region specific DIE. However, for fewer genes, multiple cell types influence DIE. Thus, regional identity can, although rarely, override cell-type specificity. Cell types indigenous to one anatomic structure display distinctive DIE, e.g. the choroid plexus epithelium manifests distinct transcription-start-site usage. Spatial transcriptomics and long-read sequencing yield a spatially resolved splicing map. Our methods quantify isoform expression with cell-type and spatial resolution and it contributes to further our understanding of how the brain integrates molecular and cellular complexity.

Overview

The claims and statistics of this paper haven’t been checked yet.

Run the check — free, no account needed. It reads the open-access text and checks the sources it cites.

A few free checks a day · papers already verified open instantly · results are public

Integrity signals

Registry

Crossref · 10.1038/s41467-020-20343-5

Cites

93 of 94 references verified0 citation errors · 0 not checkable

Statistics

Figures

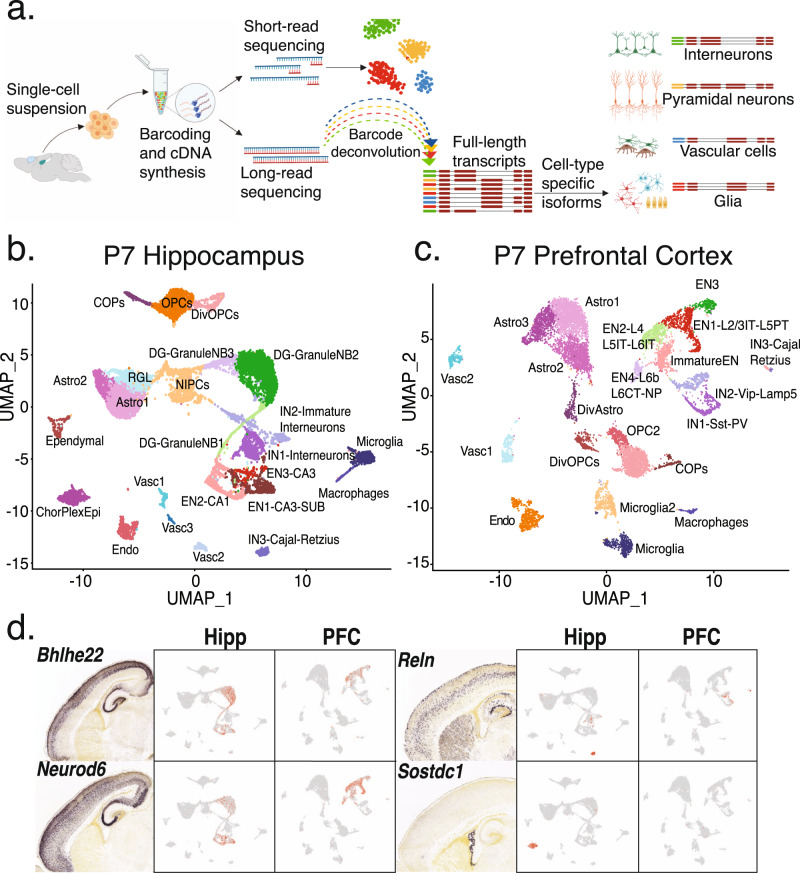
Fig. 1 Short read clustering of P7 hippocampus and prefrontal cortex tissue recovers precursors to known adult cell-types. a Schematic of the ScISOrSeq workflow (created with BioRender.com). b UMAP of P7 hippocampus (HIPP) data. Cell-types identified by marker genes, RNA velocity analysis, and alignment to published data shown in S1. c UMAP of P7 prefrontal cortex (PFC) data. Cell-types identified by marker genes, RNA velocity analysis, and alignment to published data shown in S2. d In situ hybridization (ISH) images from Allen developing mouse brain atlas for marker genes and corresponding projections on UMAP plots from HIPP and PFC.
Fig. 1 Short read clustering of P7 hippocampus and prefrontal cortex tissue recovers precursors to known adult cell-types. a Schematic of the ScISOrSeq workflow (created with BioRender.com). b UMAP of P7 hippocampus (HIPP) data. Cell-types identified by marker genes, RNA velocity analysis, and alignment to published data shown in S1. c UMAP of P7 prefrontal cortex (PFC) data. Cell-types identified by marker genes, RNA velocity analysis, and alignment to published data shown in S2. d In situ hybridization (ISH) images from Allen developing mouse brain atlas for marker genes and corresponding projections on UMAP plots from HIPP and PFC.CC BY · PubMed Central
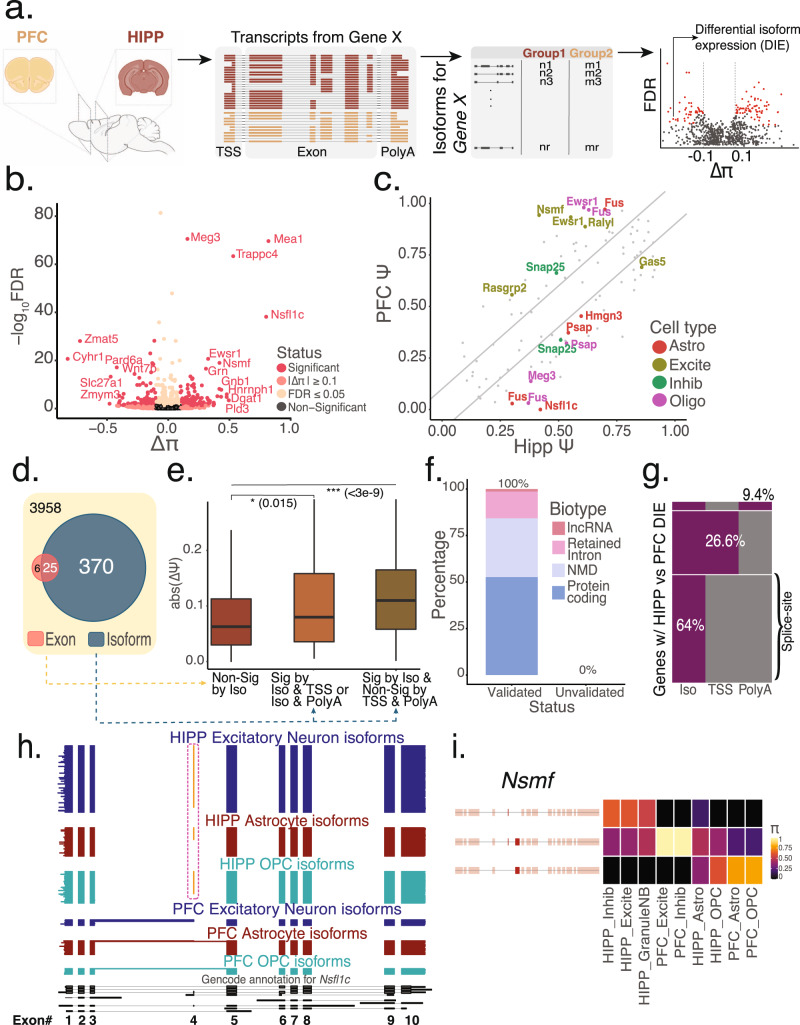
Fig. 2 A gene-wise test for differential isoform expression (DIE) is more sensitive than an exon-wise test at detecting splicing changes. a Schematic of the scisorseqR approach—Barcode deconvolution, filtering, pairwise comparison, and reporting of significant results based on FDR and ΔΠ cutoffs (created with BioRender.com). b Volcano plot of bulk HIPP vs. bulk PFC differential abundance analysis, with the effect size (ΔΠ) on the X-axis. P-values derived from a χ2 test and corrected for multiple testing using the Benjamini–Hochberg correction are plotted on the Y-axis. Points are colored according to the levels of significance based on FDR and ΔΠ value. Genes considered significant (pink) when FDR ≤ 0.05 and |ΔΠ| ≥ 0.1. c Scatter plot showing the ΔΨ of all exons for genes that show significant DIE between HIPP and PFC. Gray points represent non-significant exons. Points are colored according to the cell-type in which an exon is considered significant by a BY corrected p-value and a ΔΠ ≥ 0.1. Diagonal lines indicate cutoff of 0.1 ΔΨ. d Venn diagram showing the overlap of genes significant by DIE (BH correction) with genes significant by exon tests (BY correction). e Boxplot showing the maximum absolute value of ΔΨ per gene in three different categories: genes that are not significant by DIE tests (n = 1395), genes that are significant by DIE tests and also exhibit differential TSS or polyA-site usage (n = 38), and genes that are significant by DIE and do not exhibit differential TSS or polyA-site usage (n = 128). P-values were calculated using a two-sided Wilcoxon rank sum test. Data are represented as boxplots where the middle line is the median, the lower and upper hinges correspond to the first and third quartiles, the upper whisker extends from the hinge to the largest value no further than 1.5× IQR from the hinge (where IQR is the inter-quartile range) and the lower whisker extends from the hinge to the smallest value at most 1.5× IQR of the hinge. Please see function geom_boxplot in R (ggplot2). f Percentage of novel transcripts by scisorseqR that were manually validated as being novel by Gencode team, and breakdown of predicted function. g Heatmap of significant DIE genes (n = 395, BH correction) according to entire isoform between bulk HIPP and bulk PFC that also exhibit differential usage of transcription start site (TSS) and polyA-site (PolyA). Each row is a single gene. Gray represents genes that are non-significant by category (Iso/TSS/PolyA) whereas purple represents significant by category. h Isoform expression of Nsfl1c gene. Each horizontal line in the plot represents a single transcript colored according to the cell-type it is represented in. Therefore, blocks represent exons and whitespace represents intronic space (not drawn to scale). Orange exon represents alternative inclusion. i Isoform expression for the Nsmf gene. Each row represents an isoform colored by Π and each column represents a cell-type in HIPP or PFC.
Fig. 2 A gene-wise test for differential isoform expression (DIE) is more sensitive than an exon-wise test at detecting splicing changes. a Schematic of the scisorseqR approach—Barcode deconvolution, filtering, pairwise comparison, and reporting of significant results based on FDR and ΔΠ cutoffs (created with BioRender.com). b Volcano plot of bulk HIPP vs. bulk PFC differential abundance analysis, with the effect size (ΔΠ) on the X-axis. P-values derived from a χ2 test and corrected for multiple testing using the Benjamini–Hochberg correction are plotted on the Y-axis. Points are colored according to the levels of significance based on FDR and ΔΠ value. Genes considered significant (pink) when FDR ≤ 0.05 and |ΔΠ| ≥ 0.1. c Scatter plot showing the ΔΨ of all exons for genes that show significant DIE between HIPP and PFC. Gray points represent non-significant exons. Points are colored according to the cell-type in which an exon is considered significant by a BY corrected p-value and a ΔΠ ≥ 0.1. Diagonal lines indicate cutoff of 0.1 ΔΨ. d Venn diagram showing the overlap of genes significant by DIE (BH correction) with genes significant by exon tests (BY correction). e Boxplot showing the maximum absolute value of ΔΨ per gene in three different categories: genes that are not significant by DIE tests (n = 1395), genes that are significant by DIE tests and also exhibit differential TSS or polyA-site usage (n = 38), and genes that are significant by DIE and do not exhibit differential TSS or polyA-site usage (n = 128). P-values were calculated using a two-sided Wilcoxon rank sum test. Data are represented as boxplots where the middle line is the median, the lower and upper hinges correspond to the first and third quartiles, the upper whisker extends from the hinge to the largest value no further than 1.5× IQR from the hinge (where IQR is the inter-quartile range) and the lower whisker extends from the hinge to the smallest value at most 1.5× IQR of the hinge. Please see function geom_boxplot in R (ggplot2). f Percentage of novel transcripts by scisorseqR that were manually validated as being novel by Gencode team, and breakdown of predicted function. g Heatmap of significant DIE genes (n = 395, BH correction) according to entire isoform between bulk HIPP and bulk PFC that also exhibit differential usage of transcription start site (TSS) and polyA-site (PolyA). Each row is a single gene. Gray represents genes that are non-significant by category (Iso/TSS/PolyA) whereas purple represents significant by category. h Isoform expression of Nsfl1c gene. Each horizontal line in the plot represents a single transcript colored according to the cell-type it is represented in. Therefore, blocks represent exons and whitespace represents intronic space (not drawn to scale). Orange exon represents alternative inclusion. i Isoform expression for the Nsmf gene. Each row represents an isoform colored by Π and each column represents a cell-type in HIPP or PFC.CC BY · PubMed Central
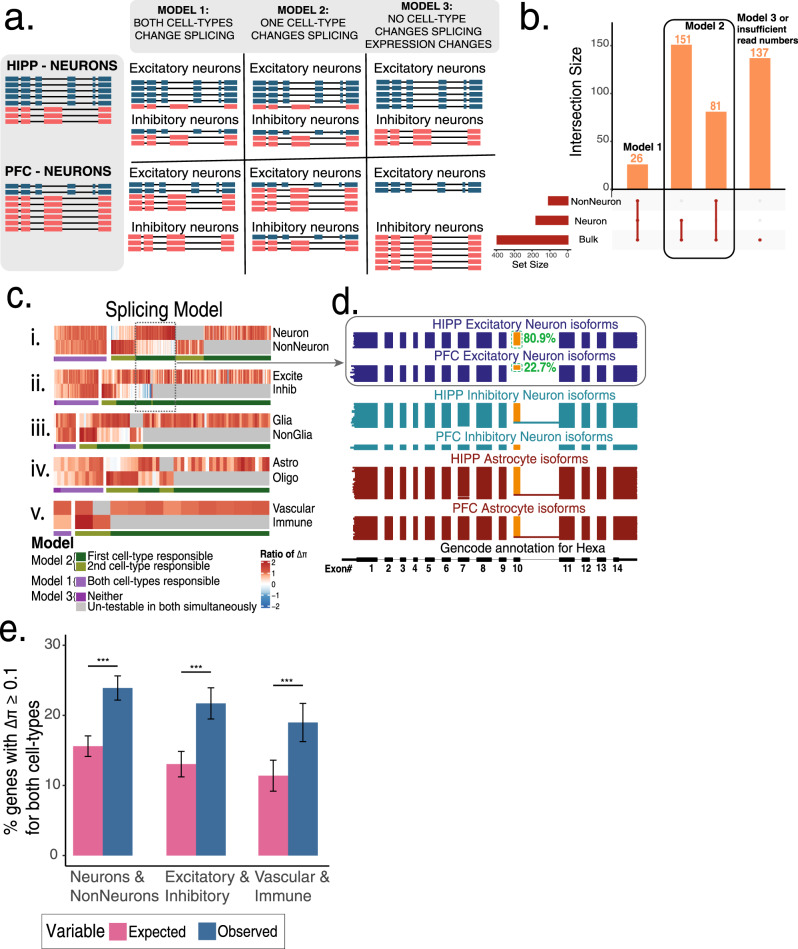
Fig. 3 Three models of alternative splicing followed by differentially spliced genes across brain regions. a Schematic of three models that explain splicing changes between any two categories (e.g., HIPP neurons versus PFC neurons). b Upset plot of DIE genes in bulk, neuron, and non-neuron. c Five gene × celltype heatmaps clustered by the ratio of ΔΠ of an individual cell-subtype to a parent cell-type i.e., value for Neuron = ΔΠNeuron/ΔΠBulk. Each vertical line indicates the ratio of ΔΠ for a single gene. Gray lines indicate lack of sufficient depth or lack of expression. Clusters of genes are colored by whether both cell-types show similar relative ΔΠ to the parent (purple, Model I, Model III) or whether one cell-type explains most of the splicing changes (Model II). d Hexa gene representing an example of Model II. Each horizontal line in the plot represents a single transcript colored according to the cell-type it is represented in. Therefore, blocks represent exons and whitespace represents intronic space (not drawn to scale). Orange exon represents alternative inclusion. e Barplots indicating percent of genes with |ΔΠ| ≥ 0.1 for two concurrently assessed cell-types. Pink bar indicates expected levels assuming independence, while blue bars represent observed levels (n = 2351,1320,785). Error bars indicate 95% confidence interval of proportion. P-values calculated using Fisher’s two-sided exact test.
Fig. 3 Three models of alternative splicing followed by differentially spliced genes across brain regions. a Schematic of three models that explain splicing changes between any two categories (e.g., HIPP neurons versus PFC neurons). b Upset plot of DIE genes in bulk, neuron, and non-neuron. c Five gene × celltype heatmaps clustered by the ratio of ΔΠ of an individual cell-subtype to a parent cell-type i.e., value for Neuron = ΔΠNeuron/ΔΠBulk. Each vertical line indicates the ratio of ΔΠ for a single gene. Gray lines indicate lack of sufficient depth or lack of expression. Clusters of genes are colored by whether both cell-types show similar relative ΔΠ to the parent (purple, Model I, Model III) or whether one cell-type explains most of the splicing changes (Model II). d Hexa gene representing an example of Model II. Each horizontal line in the plot represents a single transcript colored according to the cell-type it is represented in. Therefore, blocks represent exons and whitespace represents intronic space (not drawn to scale). Orange exon represents alternative inclusion. e Barplots indicating percent of genes with |ΔΠ| ≥ 0.1 for two concurrently assessed cell-types. Pink bar indicates expected levels assuming independence, while blue bars represent observed levels (n = 2351,1320,785). Error bars indicate 95% confidence interval of proportion. P-values calculated using Fisher’s two-sided exact test.CC BY · PubMed Central
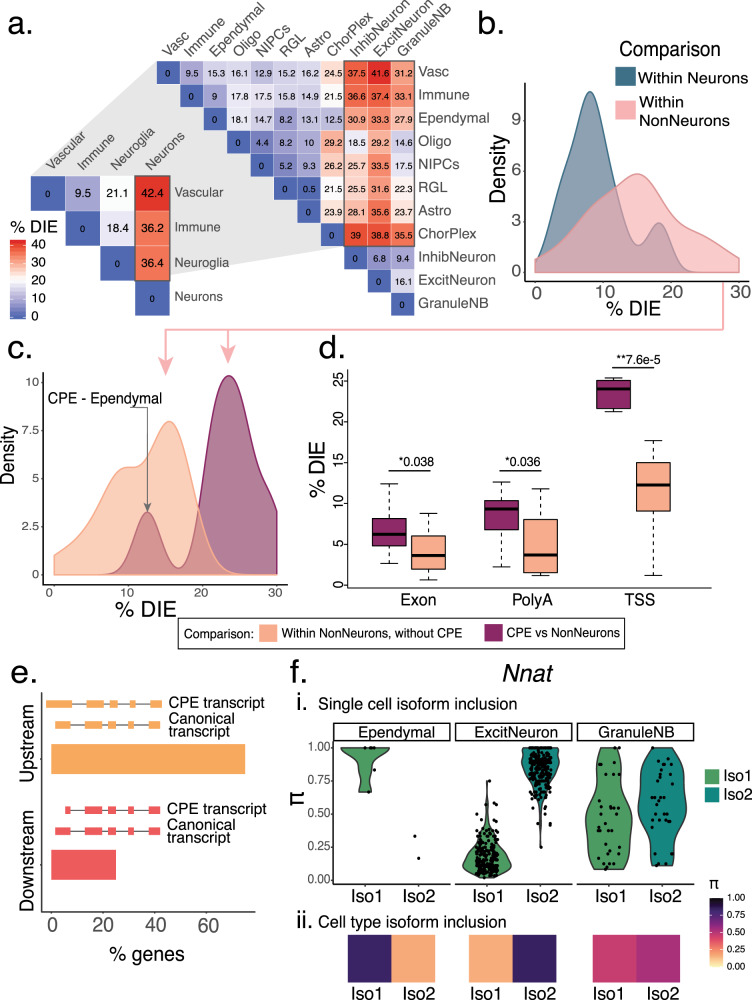
Fig. 4 Choroid plexus epithelial cells (CPEs) generate distinct isoforms predominantly through alternative TSS. a Triangular heatmap representing percentage of significant DIE in pairwise comparisons at two levels of granularity. At the broad level: pairwise comparisons of neurons, non-neurons, immune cells, and vascular cells. Zooming in, at the narrow level: neuronal and non-neuronal categories are broken up into their constitutive cell-subtypes. b Density plot of percentage of significant DIE in pairwise comparisons from 4A, broken down by two categories: within neurons and within non-neurons. c Density plot showing DIE within non-neurons (pink region, Fig. 4b) broken up further by comparisons that either include (purple) or exclude (orange) choroid plexus epithelial (CPE) cells. d Boxplots of percentage significant genes in non-neuronal comparisons including and excluding the CPE, broken down by part of the transcript (TSS/splice-site/PolyA) responsible for splicing changes. X-axis indicates the part of the transcript assessed. P-values were calculated using a two-sided Wilcoxon rank sum test (***p < 10−15, **p < 0.001, *p < 0.05). Data are represented as boxplots where the middle line is the median, the lower and upper hinges correspond to the first and third quartiles, the upper whisker extends from the hinge to the largest value no further than 1.5 × IQR from the hinge (where IQR is the inter-quartile range) and the lower whisker extends from the hinge to the smallest value at most 1.5 × IQR of the hinge. Please see function geom_boxplot in R (ggplot2). e Barplot showing the percentage of genes (n-90) for which the CPE transcripts are either upstream or downstream of non-CPE transcripts. f Percent inclusion (Π) of two Nnat isoforms across three cell-types: ependymal cells, excitatory neurons, and granule neuroblasts i. Violin plots of Π values of each isoform per single cell ii. Π values per isoform across all single cells.
Fig. 4 Choroid plexus epithelial cells (CPEs) generate distinct isoforms predominantly through alternative TSS. a Triangular heatmap representing percentage of significant DIE in pairwise comparisons at two levels of granularity. At the broad level: pairwise comparisons of neurons, non-neurons, immune cells, and vascular cells. Zooming in, at the narrow level: neuronal and non-neuronal categories are broken up into their constitutive cell-subtypes. b Density plot of percentage of significant DIE in pairwise comparisons from 4A, broken down by two categories: within neurons and within non-neurons. c Density plot showing DIE within non-neurons (pink region, Fig. 4b) broken up further by comparisons that either include (purple) or exclude (orange) choroid plexus epithelial (CPE) cells. d Boxplots of percentage significant genes in non-neuronal comparisons including and excluding the CPE, broken down by part of the transcript (TSS/splice-site/PolyA) responsible for splicing changes. X-axis indicates the part of the transcript assessed. P-values were calculated using a two-sided Wilcoxon rank sum test (***p < 10−15, **p < 0.001, *p < 0.05). Data are represented as boxplots where the middle line is the median, the lower and upper hinges correspond to the first and third quartiles, the upper whisker extends from the hinge to the largest value no further than 1.5 × IQR from the hinge (where IQR is the inter-quartile range) and the lower whisker extends from the hinge to the smallest value at most 1.5 × IQR of the hinge. Please see function geom_boxplot in R (ggplot2). e Barplot showing the percentage of genes (n-90) for which the CPE transcripts are either upstream or downstream of non-CPE transcripts. f Percent inclusion (Π) of two Nnat isoforms across three cell-types: ependymal cells, excitatory neurons, and granule neuroblasts i. Violin plots of Π values of each isoform per single cell ii. Π values per isoform across all single cells.CC BY · PubMed Central
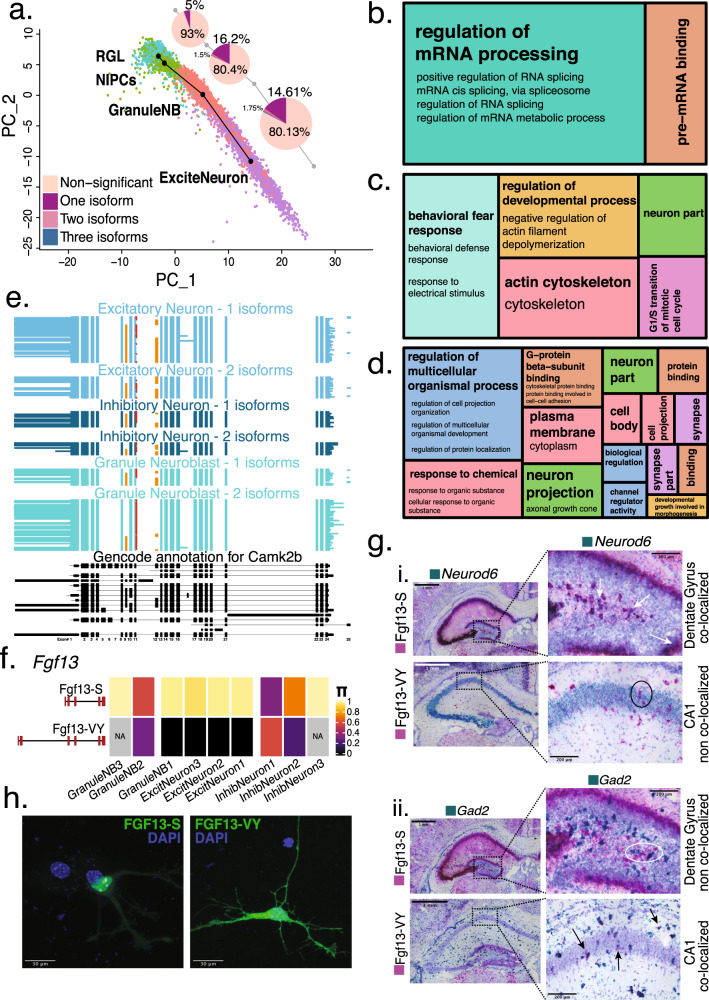
Fig. 5 Relative isoform expression differences during development reflect dynamic changes in function. a Splicing changes seen at every transition step of neuronal differentiation trajectory. Pie chart indicates the number of isoforms needed to be considered in order to reach the |ΔΠ| ≥ 0.1 threshold for a gene to be considered significantly DIE. b Treemap of condensed gene ontology (GO) terms for the transition from RGL to NIPCs in the neuronal differentiation trajectory, with size of boxes corresponding to number of significant terms associated with the GO category. c Treemap of condensed GO terms for the transition from NIPCs to GranuleNB (GNB1, GNB2, GNB3). d Treemap of condensed GO terms for the transition from NIPCs to Excitatory Neurons (EN1, EN2, EN3). e Hippocampal cell-type specific isoform expression in Camk2b gene. Each horizontal line in the plot represents a single transcript colored according to the cell-type it is represented in. Orange exons represent alternative inclusion, red extension of exon 11 represents a 3nt addition. f Π value of the S and VY isoforms for Fgf13 gene across hippocampal neuronal cell types. g Basescope (in situ hybridization) images (N = 1, repeated for 2 technical replicates). Data showing Fgf13-S and Fgf13-VY isoform expression (pink stain) in the hippocampus, with simultaneous staining for excitatory neurons (Neurod6—green) and inhibitory neurons (Gad2 - green). Scale bar, 1 mm. Each plot features enlargements of the dentate gyrus for the S isoform, and CA1 region for the VY isoform with arrows indicating co-localization while circles indicate lack of co-localization. Scale bar, 200 μm. h Representative images of subcellular localization of overexpressed GFP-tagged Fgf13-S isoform in nucleolus and GFP-tagged Fgf13-VY isoform in cytoplasm. (N = 3, 20–30 GFP + neurons examined per transfection). Scale bar, 30 μm.
Fig. 5 Relative isoform expression differences during development reflect dynamic changes in function. a Splicing changes seen at every transition step of neuronal differentiation trajectory. Pie chart indicates the number of isoforms needed to be considered in order to reach the |ΔΠ| ≥ 0.1 threshold for a gene to be considered significantly DIE. b Treemap of condensed gene ontology (GO) terms for the transition from RGL to NIPCs in the neuronal differentiation trajectory, with size of boxes corresponding to number of significant terms associated with the GO category. c Treemap of condensed GO terms for the transition from NIPCs to GranuleNB (GNB1, GNB2, GNB3). d Treemap of condensed GO terms for the transition from NIPCs to Excitatory Neurons (EN1, EN2, EN3). e Hippocampal cell-type specific isoform expression in Camk2b gene. Each horizontal line in the plot represents a single transcript colored according to the cell-type it is represented in. Orange exons represent alternative inclusion, red extension of exon 11 represents a 3nt addition. f Π value of the S and VY isoforms for Fgf13 gene across hippocampal neuronal cell types. g Basescope (in situ hybridization) images (N = 1, repeated for 2 technical replicates). Data showing Fgf13-S and Fgf13-VY isoform expression (pink stain) in the hippocampus, with simultaneous staining for excitatory neurons (Neurod6—green) and inhibitory neurons (Gad2 - green). Scale bar, 1 mm. Each plot features enlargements of the dentate gyrus for the S isoform, and CA1 region for the VY isoform with arrows indicating co-localization while circles indicate lack of co-localization. Scale bar, 200 μm. h Representative images of subcellular localization of overexpressed GFP-tagged Fgf13-S isoform in nucleolus and GFP-tagged Fgf13-VY isoform in cytoplasm. (N = 3, 20–30 GFP + neurons examined per transfection). Scale bar, 30 μm.CC BY · PubMed Central
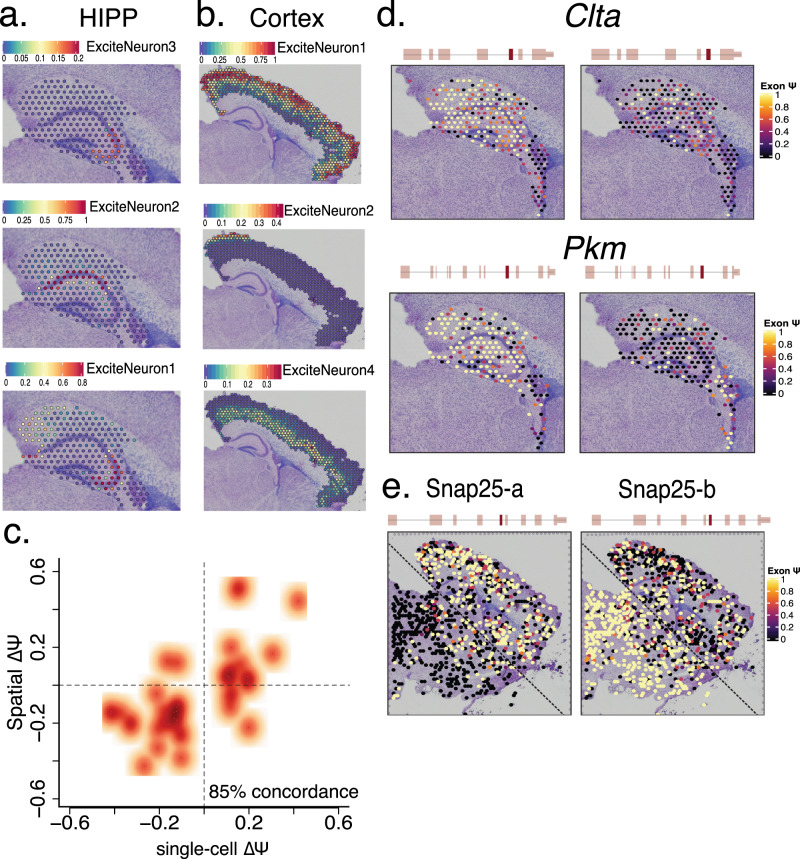
Fig. 6 Slide isoform sequencing (sl-ISO-Seq) confirms spatial localization of splicing changes. a Spatial localization of hippocampal single-cell excitatory neuron subtypes using gene-expression similarities to HIPP short reads. Color of spot indicates percentage of transcripts corresponding to indicated cell type. b Spatial localization of cortical excitatory neuron subtypes using gene-expression similarities to PFC short reads. Color of spot indicates percentage of transcripts corresponding to indicated cell type. c Scatter plot of the ΔΨ between HIPP and PFC from the single-cell data, and the ΔΨ between HIPP and cortex from 10X Visium spatial data (r2 = 0.6). d Spatial distribution of alternatively spliced exons in Clta and Pkm genes in the hippocampal and choroid plexus regions. Color of spot indicates Ψ values for each exon. e Spatial distribution of two mutually exclusive, alternatively spliced exons in Snap25 gene across the whole slide. Color of spot indicates Ψ values for each exon.
Fig. 6 Slide isoform sequencing (sl-ISO-Seq) confirms spatial localization of splicing changes. a Spatial localization of hippocampal single-cell excitatory neuron subtypes using gene-expression similarities to HIPP short reads. Color of spot indicates percentage of transcripts corresponding to indicated cell type. b Spatial localization of cortical excitatory neuron subtypes using gene-expression similarities to PFC short reads. Color of spot indicates percentage of transcripts corresponding to indicated cell type. c Scatter plot of the ΔΨ between HIPP and PFC from the single-cell data, and the ΔΨ between HIPP and cortex from 10X Visium spatial data (r2 = 0.6). d Spatial distribution of alternatively spliced exons in Clta and Pkm genes in the hippocampal and choroid plexus regions. Color of spot indicates Ψ values for each exon. e Spatial distribution of two mutually exclusive, alternatively spliced exons in Snap25 gene across the whole slide. Color of spot indicates Ψ values for each exon.CC BY · PubMed Central

Verification

Claims the paper makes

The claims and statistics of this paper haven’t been checked yet.

Run the check — free, no account needed. It reads the open-access text and checks the sources it cites.

A few free checks a day · papers already verified open instantly · results are public

Claims other papers make about this one

Each is checked against this paper’s own text: does it say what the citing paper says it does?

Self-check

Percentages, sums and reported differences re-computed from the paper’s own numbers.

The self-check needs the paper’s full text.

Citations

Cites

Show all 94 references

Research works printed but not linked: 6

  1. Zeisel, A. et al. Molecular architecture of the mouse nervous system. Cell 174, 999–1014.e22 (2018). · DOI · Paper page
  2. The Mouse Brain in Stereotaxic Coordinates, Compact - 3rd Edition. https://www.elsevier.com/books/the-mouse-brain-in-stereotaxic-coordinates-compact/franklin/978-0-12-374244-5 (2020).
  3. Pablo, J. L., Wang, C., Presby, M. M. & Pitt, G. S. Polarized localization of voltage-gated Na+ channels is regulated by concerted FGF13 and FGF14 action. Proc. Natl Acad. Sci. U.S.A 113, E2665–E2674 (2016). · DOI
  4. Stuart, T. et al. Comprehensive integration of single-cell data. Cell 177, 1888–1902.e21 (2019). · DOI · Paper page
  5. Benjamini, Y. & Yekutieli, D. The control of the false discovery rate in multiple testing under dependency. Ann. Stat. 29, 1165–1188 (2001). · DOI · Paper page
  6. Forrest, A. R. R. et al. A promoter-level mammalian expression atlas. Nature 507, 462–470 (2014). · DOI · Paper page

Cited by

Sorted by citations

See all 230

Metadata

Authors
Joglekar, A., Prjibelski, A., Mahfouz, A., Collier, P., Lin, S., Schlusche, A. K., Marrocco, J., Williams, S. R., Haase, B., Hayes, A., Chew, J. G., Weisenfeld, N. I., Wong, M. Y., Stein, A. N., Hardwick, S. A., Hunt, T., Wang, Q., Dieterich, C., Bent, Z., Fedrigo, O., Sloan, S. A., Risso, D., Jarvis, E. D., Flicek, P., Luo, W., Pitt, G. S., Frankish, A., Smit, A. B., Ross, M. E., & Tilgner, H. U.
Affiliations
  • Weill Cornell Medicine (US)
  • St Petersburg University (RU)
  • Leiden University Medical Center (NL)
  • Rockefeller University (US)
  • 10X Genomics (United States) (US)
  • Columbia University (US)
  • Garvan Institute of Medical Research (AU)
  • European Bioinformatics Institute (GB)
  • University Hospital Heidelberg (DE)
  • Emory University (US)
  • University of Padua (IT)
  • Howard Hughes Medical Institute (US)
  • Amsterdam Neuroscience (NL)
Corresponding author
Tilgner, Hagen U.
Venue
Nature Communications
Published
2021-01-19
Volume
12
Issue
1
Pages
463-463
ISSN
2041-1723 (ISSN-L)
OpenAlex
W3122762933
Cited by
229
References
94
Citations by year
2026: 22 · 2025: 39 · 2024: 52 · 2023: 45 · 2022: 30 · 2021: 39
FWCI
13.26
Type
journal article
Language
en
Open access
Locations
  • Nature Communications (publishedVersion, cc-by)
  • bioRxiv (Cold Spring Harbor Laboratory) (acceptedVersion, cc-by)
  • Europe PMC (PubMed Central) (publishedVersion, other-oa)
  • PubMed Central (publishedVersion, cc-by)
  • PubMed (publishedVersion)
  • VU Research Portal (publishedVersion, other-oa)
  • Data Archiving and Networked Services (DANS) (submittedVersion, cc-by)
  • RePEc: Research Papers in Economics (submittedVersion)
  • Leiden Repository (Leiden University) (submittedVersion, cc-by)
  • DOAJ (DOAJ: Directory of Open Access Journals) (submittedVersion, cc-by-sa)
  • Research Repository (Delft University of Technology) (submittedVersion)
  • Padua Research Archive (University of Padova) (submittedVersion, cc-by)
  • Data Archiving and Networked Services (DANS) (submittedVersion, other-oa)
Funders
  • Russian Foundation for Basic Research (19-04-01074)
  • U.S. Department of Health & Human Services | NIH | National Institute on Drug Abuse (T32DA03980)
  • Silicon Valley Community Foundation (CZF2019-002443)
  • U.S. Department of Health & Human Services | NIH | National Cancer Institute (2U24CA180996)
  • Wellcome Trust (WT108749/Z/15/Z)
  • U.S. Department of Health & Human Services | NIH | National Human Genome Research Institute (2U41HG007234)
  • U.S. Department of Health & Human Services | NIH | National Institute of Mental Health (R01MH118934)
Topics
  • Life Sciences › Biochemistry, Genetics and Molecular Biology › Molecular Biology › RNA Research and Splicing
  • Life Sciences › Biochemistry, Genetics and Molecular Biology › Molecular Biology › Single-cell and spatial transcriptomics
  • Life Sciences › Biochemistry, Genetics and Molecular Biology › Molecular Biology › Genomics and Phylogenetic Studies
Keywords
differential isoform expression, alternative splicing, brain region specificity, cell type specificity, hippocampus, prefrontal cortex, postnatal mouse brain, spatial transcriptomics, choroid plexus epithelium
MeSH terms
Animals, Animals, Newborn, Female, Hippocampus, Prefrontal Cortex, Alternative Splicing, Gene Expression Regulation, Developmental, Computational Biology, Protein Isoforms, Models, Animal, Mice, Single-Cell Analysis, Spatial Analysis

About these checks

Registry, retraction, Cites and statistics results are computed, not judged, with one exception: a printed reference that no index lists is read once by a model before it counts as a citation error. Claims are extracted by a model and kept only when their quote appears verbatim in the text; each cited source is then checked, with a model’s help, for whether it says what the claim relies on. Those verdicts can be wrong — read the claim’s quote and the cited source before relying on one.

Statistics and arithmetic are recomputed, not judged.

Confidence bands are shown only for fields calibrated on our annotated test set. None is calibrated yet, so no band is shown.

What counts as a claim ›How we measure confidence ›How we check this ›

Are you an author, or do you see a problem with this page? Request a review