

The DOI matches its Crossref record; 53 of the 53 references it cites were found in a registry or an index; 27 of the 47 sources its claims cite were checked for support.
A practical solution to pseudoreplication bias in single-cell studies
Open accessPublished version of a preprint
Abstract
Cells from the same individual share common genetic and environmental backgrounds and are not statistically independent; therefore, they are subsamples or pseudoreplicates. Thus, single-cell data have a hierarchical structure that many current single-cell methods do not address, leading to biased inference, highly inflated type 1 error rates, and reduced robustness and reproducibility. This includes methods that use a batch effect correction for individual as a means of accounting for within-sample correlation. Here, we document this dependence across a range of cell types and show that pseudo-bulk aggregation methods are conservative and underpowered relative to mixed models. To compute differential expression within a specific cell type across treatment groups, we propose applying generalized linear mixed models with a random effect for individual, to properly account for both zero inflation and the correlation structure among measures from cells within an individual. Finally, we provide power estimates across a range of experimental conditions to assist researchers in designing appropriately powered studies.
Overview
CoChat Summary
TL;DR
Single-cell differential expression analyses that treat cells from the same individual as independent suffer pseudoreplication, inflating type 1 error rates and reducing reproducibility. The authors recommend generalized linear mixed models with a random effect for individual, especially the two-part hurdle model as implemented in MAST with random effects, and provide power estimates to guide study design.
Key findings
- Cells from the same individual are positively correlated across cell types: intra-individual Spearman correlations were always higher than inter-individual correlations, based on n = 40,775 cells from 43 individuals over four independent experiments.
- In simulations, methods ignoring within-individual correlation had highly inflated type 1 error rates: MAST without random effects ranged from 0.561 to 0.888, and ComBat batch-corrected MAST ranged from 0.602 to 0.856, while MAST with a random effect ranged from 0.041 to 0.069 and Tweedie GLMM from 0.053 to 0.084.
- Pseudo-bulk aggregation controlled type 1 error but was conservative: pseudo-bulk mean ranged from 0.021 to 0.026 and pseudo-bulk sum from 0.008 to 0.035 across conditions.
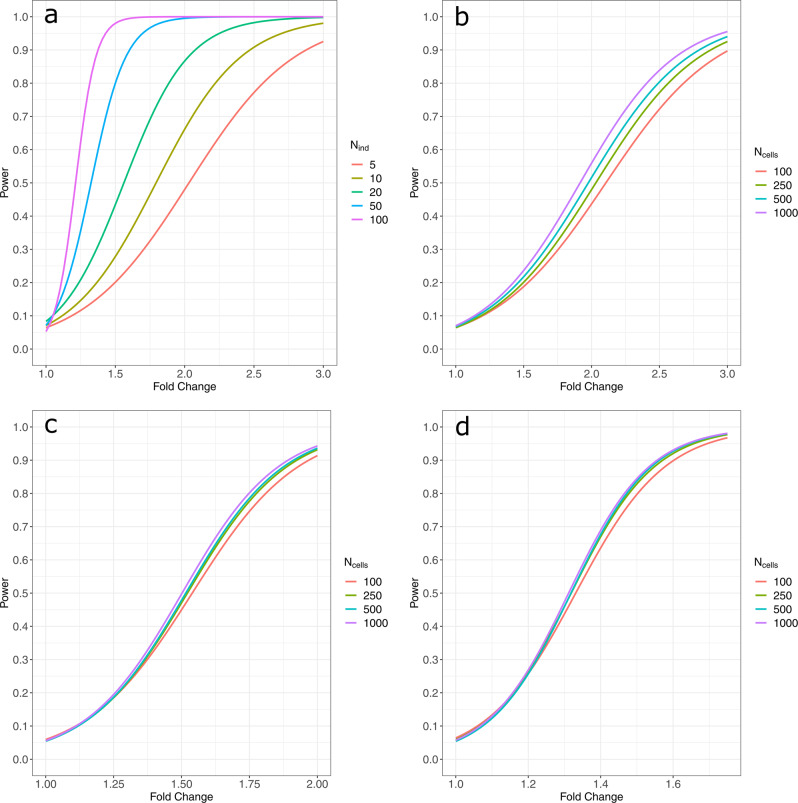
- Power analyses showed increasing the number of independent experimental units is the best way to increase power; after sample sizes exceed 20, there were only marginal gains from sampling more than 100 cells per individual, and pseudo-bulk methods were only slightly underpowered when balanced but less well powered under increasing imbalance.
Methods
- Literature review: PubMed search in January 2019 for “single-cell differential expression” returned 251 articles; 76 were deemed appropriate, including 10 reviews, 36 methods papers, and 30 implementation papers.
- Correlation analyses: pairwise intra- and inter-individual Spearman correlations were computed across ten pancreatic cell types and a random sample of cell types, using publicly available datasets GSE81861, GSE72056, E-MTAB-5061, and EGAS00001004082.
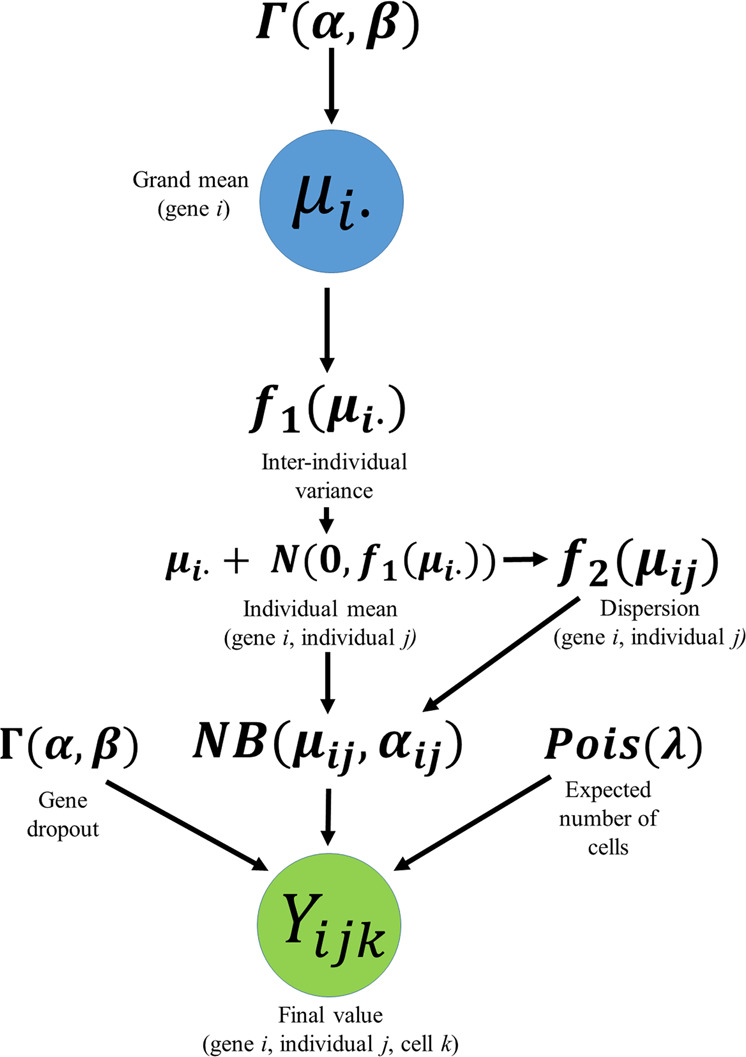
- Simulation and evaluation: a simulation engine reproduced hierarchical single-cell expression structure using TPM parameters from six cell types across three studies; type 1 error was evaluated over 250,000 iterations per condition with 5, 10, 20, 30, or 40 individuals per group and Poisson cell counts with λ = 50, 100, 250, or 500, comparing ten differential expression methods; power was computed over 1,000 simulations per fold-change increment of 0.01 between 1 and 5.
Limitations
- Stated: the simulation engine was modeled using plate-based data, although droplet-based single-cell data also showed hierarchical correlation structure.
- Stated: random-effects models are computationally expensive, with run times significantly higher than other tools, and estimating power with more than 1,000 cells per individual is computationally costly; mixed models may fail due to complete separation when only two individuals per treatment group are used, especially with fewer than 50 cells per individual.
- Stated: inflated type 1 error rates at lower numbers of individuals per group are a consequence of the two-part hurdle model simultaneously testing two hypotheses and overabundance of subsampling with small sample sizes; evident from the text: the evaluation focuses on simulated data and differential expression within a specific cell type across treatment groups, rather than a broad empirical benchmark across all single-cell modalities.
Model-written summary. Check it against the paper before relying on it.
Integrity signals
Registry
Cites
Statistics
Figures

Verification
Claims the paper makes
14 Valid · 3 Not valid · 7 Not checked · 61 Own results and interpretations
The cited sources support only part of this claim — read each source’s verdict below.
In the paper
“The result is reduced reproducibility with real data, leading to the conclusion that tools built specifically to handle single-cell data do not appear to perform better than tools created for bulk data analysis22–24.”
§ A practical solution to pseudoreplication bias in single-cell studies > Discussion
What the sources say
- Not checked — no full text of the sourcecites [22] Soneson, C. & Robinson, M. D. Bias, robustness and scalability in single-cell differential expression analysis. Nat. Methods 15, 255–261 (2018). source
- Supportedcites [23] Dal Molin, A., Baruzzo, G. & Di Camillo, B. Single-cell RNA-sequencing: assessment of differential expression analysis methods. Front. Genet. 8, 62 (2017). source
In the Discussion’s concluding remarks (page unavailable), the paper says bulk methods performed comparably to tools designed for single-cell data. Its limitations section adds that this held in the tested real dataset, while cautioning that the results are preliminary. (LLM, conf=0.92)
- Partly supportedcites [24] Jaakkola, M. K., Seyednasrollah, F., Mehmood, A. & Elo, L. L. Comparison of methods to detect differentially expressed genes between single-cell populations. Brief. Bioinform. 18, 735–743 (2017). sourceExperimental — accuracy not yet measured
The Conclusions say the comparison found no systematic benefit for single-cell-specific methods overall. But they also say the two methods originally developed for bulk RNA-seq, DESeq and Limma, were unsuitable for unmodified single-cell analysis; the general-purpose method ROTS performed well. The claim therefore overstates the finding as a comparison specifically against bulk-data tools. (LLM, conf=0.87)
hedged- Asserted: passes — The authors put it forward as true.
- Checkable: passes — It can be checked against evidence.
- Load-bearing: passes — The paper’s conclusions depend on it.
- Based: passes — The paper gives a reason why it holds.
Every source the paper cites for this claim was checked and supports it.
In the paper
“This model explicitly accounts for the common problem of zero inflation in scRNA-seq data by simultaneously modeling the rate of expression and the positive expression mean10.”
§ A practical solution to pseudoreplication bias in single-cell studies > Introduction
What the sources say
- Supportedcites [10] Finak, G. et al. MAST: a flexible statistical framework for assessing transcriptional changes and characterizing heterogeneity in single-cell RNA sequencing data. Genome Biol. 16, 278 (2015). source
The Background describes MAST as a two-part model that simultaneously models the rate of expression and the positive expression mean. The Methods specify a logistic model for whether expression is zero or positive and a Gaussian model for expression conditional on being positive, supporting the claim that it accounts for excess zeros. (LLM, conf=0.93)
plainstates a cause- Asserted: passes — The authors put it forward as true.
- Checkable: passes — It can be checked against evidence.
- Load-bearing: passes — The paper’s conclusions depend on it.
- Based: passes — The paper gives a reason why it holds.
- Supported
The cited sources support only part of this claim — read each source’s verdict below.
In the paper
“Furthermore, papers evaluating the performance of single-cell-specific tools all compute the simulations as if cells were independent15–21.”
§ A practical solution to pseudoreplication bias in single-cell studies > Discussion
What the sources say
- Supportedcites [15] Vieth, B., Parekh, S., Ziegenhain, C., Enard, W. & Hellmann, I. A systematic evaluation of single cell RNA-seq analysis pipelines. Nat. Commun. 10, 1–11 (2019). source
The Methods > Simulations section describes evaluating single-cell analysis pipelines using simulated groups defined by numbers of cells, with a separate size factor drawn for each cell. This supports citing the paper as one example of a tool evaluation that simulates cells as independent units; it does not, by itself, establish what every paper in the cited range does. (LLM, conf=0.84)
- Could not verifycites [16] Zappia, L., Phipson, B. & Oshlack, A. Splatter: simulation of single-cell RNA sequencing data. Genome Biol. 18, 174 (2017). sourceExperimental — accuracy not yet measured
The Background (page unavailable) says many single-cell analysis packages use simulations to evaluate their performance, but does not say those simulations treat cells as independent. The Results sections on simulation models and differentiation paths describe Splatter’s own simulations, not a survey establishing that all tool-evaluation papers make that assumption. Searches for independent cells and intercellular dependence found no passage supporting the universal claim. (LLM, conf=0.72)
- Partly supportedcites [17] Kharchenko, P. V., Silberstein, L. & Scadden, D. T. Bayesian approach to single-cell differential expression analysis. Nat. Methods 11, 740–742 (2014). sourceExperimental — accuracy not yet measured
The Online Methods sections on similarity measures and differential-expression performance describe evaluations of single-cell tools, including random resampling of cells and benchmarking against measured expression data. They do not establish that this paper computed simulations as if cells were independent, or support the claim that all such papers did so. No page numbers are available in our copy. (LLM, conf=0.78)
- Supportedcites [18] Korthauer, K. D. et al. A statistical approach for identifying differential distributions in single-cell RNA-seq experiments. Genome Biol. 17, 222 (2016). source
The Results and discussion section (‘Simulated data’; page not provided) describes evaluating the tool with simulated cells drawn from gene-level negative-binomial distributions for each condition. That simulation setup treats cells as separate draws, supporting the claim as applied to this paper; this source alone cannot establish what every other cited paper did. (LLM, conf=0.82)
- Supportedcites [19] Van den Berge, K. et al. Observation weights unlock bulk RNA-seq tools for zero inflation and single-cell applications. Genome Biol. 19, 24 (2018). source
The Methods section (‘scRNA-seq data simulation’; page unavailable) describes simulating counts from gene-level negative-binomial parameters and cell-specific library sizes, then randomly adding excess zeros for each gene and cell. It describes no dependence between simulated cells, so this paper supports its use as an example in the cited group; it does not establish what every other paper did. (LLM, conf=0.83)
- Supportedcites [20] Vu, T. N. et al. Beta-Poisson model for single-cell RNA-seq data analyses. Bioinformatics 32, 2128–2135 (2016). source
Section 5.2 (page unavailable) describes this paper’s single-cell simulation for evaluating differential-expression tools. It generates expression across cell samples from a beta-Poisson model and randomly samples cell library sizes, with no dependence between cells specified. This supports citing the paper as an example of a tool evaluation that simulates cells as independent; the citation alone does not establish the sentence’s claim about all such papers. (LLM, conf=0.85)
- Supportedcites [21] Vallejos, C. A., Marioni, J. C. & Richardson, S. BASiCS: Bayesian analysis of single-cell sequencing data. PLoS Comput. Biol. 11, e1004333 (2015). source
Materials and Methods (“Alternative method presented in Brennecke et al (2013)”; page unavailable) says the paper simulated datasets using the BASiCS model to compare tool performance. Materials and Methods (“The BASiCS model”; page unavailable) describes its cell-specific random effects as mutually independent. This supports the claim for this cited paper, though it does not establish what every other paper in the citation range did. (LLM, conf=0.85)
plain- Asserted: passes — The authors put it forward as true.
- Checkable: passes — It can be checked against evidence.
- Load-bearing: passes — The paper’s conclusions depend on it.
- Based: passes — The paper gives a reason why it holds.
- Supported
The cited sources support only part of this claim — read each source’s verdict below.
In the paper
“We demonstrate that this implementation performs exceptionally well when adjusting for individual as a random effect10.”
§ A practical solution to pseudoreplication bias in single-cell studies > Discussion
What the sources say
- Partly supportedcites [10] Finak, G. et al. MAST: a flexible statistical framework for assessing transcriptional changes and characterizing heterogeneity in single-cell RNA sequencing data. Genome Biol. 16, 278 (2015). sourceExperimental — accuracy not yet measured
The Background says MAST can be extended to accommodate random effects for studies involving multiple subjects. The Results and discussion report good performance when adjusting for cellular detection rate, but do not evaluate performance when adjusting for individual as a random effect. No page numbers were available in our copy. (LLM, conf=0.83)
boosted- Asserted: passes — The authors put it forward as true.
- Checkable: passes — It can be checked against evidence.
- Load-bearing: passes — The paper’s conclusions depend on it.
- Based: passes — The paper gives a reason why it holds.
- Partly supported
The cited sources support only part of this claim — read each source’s verdict below.
In the paper
“This is due to an overestimation of the mean-square error relative to mixed-effects models, particularly when imbalance exists and the intra-individual variance is larger than the inter-individual variance, as appears to be typical with scRNA-seq data25,26.”
§ A practical solution to pseudoreplication bias in single-cell studies > Discussion
What the sources say
- Not matchedcites [25] G. W. Snedecor & W. G. Cochran. Statistical Methods (Oxford & IBH Publishing Co., 1994).
Couldn’t be matched to a paper in Crossref, so it can’t be checked.
- Partly supportedcites [26] Tirrell, T. F., Rademaker, A. W. & Lieber, R. L. Analysis of hierarchical biomechanical data structures using mixed-effects models. J. Biomech. 69, 34–39 (2018). sourceExperimental — accuracy not yet measured
The Discussion reports that within-subject variance exceeded between-subject variance in the paper’s biomechanical fiber and bundle data (page not provided). It does not establish that this pattern is typical of scRNA-seq data. Its Results discuss overestimation of the standard error under unequal subject sample sizes, not overestimation of mean-square error. (LLM, conf=0.88)
hedgedstates an association- Asserted: passes — The authors put it forward as true.
- Checkable: passes — It can be checked against evidence.
- Load-bearing: passes — The paper’s conclusions depend on it.
- Based: passes — The paper gives a reason why it holds.
- Not matched
47 more claims · 4 with their cited sources checked
Create a free account to see all 85 claims and every source verdict.
- Probably not a substantial claim. 15
- It may state two separate claims as one. 22
- The quote only partly states this claim. 1
Claims other papers make about this one
Each is checked against this paper’s own text: does it say what the citing paper says it does?
The source backs part of the claim, not all of it — or backs it for a different population, condition or comparison.
In the citing paper
“However, these studies relied almost entirely on synthetic data, supplemented by a few illustrative case studies.”
From Confronting false discoveries in single-cell differential expression (2021) · cites this paper as [34]
Experimental — accuracy not yet measuredThe source backs part of the claim, not all of it — or backs it for a different population, condition or comparison.
In the citing paper
“Previous benchmarks of DE analysis methods for single-cell transcriptomics have relied heavily on simulated data, or else have compared the results of different methods in scenarios where no ground truth was available10,17.”
From Confronting false discoveries in single-cell differential expression (2021) · cites this paper as [10]
Experimental — accuracy not yet measuredThe source backs part of the claim, not all of it — or backs it for a different population, condition or comparison.
In the citing paper
“Demultiplexing of pooled scRNA-seq is required to associate metadata with individual samples to account for between sample variation, replicate strengthened differential expression analysis, and confirmation of sample representation across scRNA-seq datasets and cell clusters (Squair et al, 2021; Zimmerman et al, 2021).”
From Evaluation of genetic demultiplexing of single-cell sequencing data from model species (2023) · cites this paper as Zimmerman et al, 2021
Experimental — accuracy not yet measuredThe cited source says what the claim attributes to it.
In the citing paper
“The possibility that conflating variability between replicates with the biological effect of interest can lead to spurious findings has previously been recognized 18 , 34 .”
From Confronting false discoveries in single-cell differential expression (2021) · cites this paper as [34]
The check wasn’t confident either way, so it gives no verdict — never disputed.
In the citing paper
“Differences in the specification of this model have led investigators to contrasting conclusions9,10.”
From Confronting false discoveries in single-cell differential expression (2021) · cites this paper as [10]
Experimental — accuracy not yet measured
1 more claim about this paper
Create a free account to see every claim other papers make about this one.
Self-check
Percentages, sums and reported differences re-computed from the paper’s own numbers.
Each contradiction between two passages listed here was confirmed by an independent check.
Rated minor: it would not touch a result — a value no result rests on, a p-value that stays on the same side of the significance level, or a conflict that is clerical, resolved elsewhere in the paper, or outside its own findings.
In the paper
§ A practical solution to pseudoreplication bias in single-cell studies > Results > Simulation
“Within-sample dispersion was simulated as a logarithmic function of the inter-individual mean, f2(μij).”
§ A practical solution to pseudoreplication bias in single-cell studies > Methods > Simulation engine
“a dispersion parameter, αij, computed by the logarithmic function of the grand mean f2(μi).”
Rated minor: it would not touch a result — a value no result rests on, a p-value that stays on the same side of the significance level, or a conflict that is clerical, resolved elsewhere in the paper, or outside its own findings.
In the paper
§ A practical solution to pseudoreplication bias in single-cell studies > Results > Intra-individual correlation
“Intra- and inter-individual Spearman’s correlations for gene expression values across ten different pancreatic cell types and a random sample of different cell types.”
§ A practical solution to pseudoreplication bias in single-cell studies > Methods > Intra- and inter-correlation analyses
“Here, only data from 886 alpha cells, 270 beta cells, and 336 ductal cells were used.”
Citations
Cites
Moderated estimation of fold change and dispersion for RNA-seq data with DESeq2
Love, M. I., Huber, W., & Anders, S. (2014) · Genome Biology · doi:10.1186/s13059-014-0550-8 · Cited by 95,106
Brooks, M., Kristensen, K., Benthem, K., Magnusson, A., Berg, C., Nielsen, A., Skaug, H., Mächler, M., & Bolker, B. (2017) · The R Journal · doi:10.32614/rj-2017-066 · Cited by 12,915
Adjusting batch effects in microarray expression data using empirical Bayes methods
Johnson, W. E., Li, C., & Rabinovic, A. (2007) · Biostatistics · doi:10.1093/biostatistics/kxj037 · Cited by 8,658
Pseudoreplication and the Design of Ecological Field Experiments
Hurlbert, S. H. (1984) · Ecological Monographs · doi:10.2307/1942661 · Cited by 8,377
Trapnell, C., Cacchiarelli, D., Grimsby, J., Pokharel, P., Li, S., Morse, M., Lennon, N. J., Livak, K. J., Mikkelsen, T. S., & Rinn, J. L. (2014) · Nature Biotechnology · doi:10.1038/nbt.2859 · Cited by 7,314
Dissecting the multicellular ecosystem of metastatic melanoma by single-cell RNA-seq
Tirosh, I., Izar, B., Prakadan, S. M., Wadsworth, M. H., Treacy, D., Trombetta, J. J., Rotem, A., Rodman, C., Lian, C., Murphy, G., et al. (2016) · Science · doi:10.1126/science.aad0501 · Cited by 4,944
Sufficient Sample Sizes for Multilevel Modeling
Maas, C. J. M., & Hox, J. J. (2005) · Methodology · doi:10.1027/1614-2241.1.3.86 · Cited by 3,582
Finak, G., McDavid, A., Yajima, M., Deng, J., Gersuk, V., Shalek, A. K., Slichter, C. K., Miller, H. W., McElrath, M. J., Prlic, M., et al. (2015) · Genome Biology · doi:10.1186/s13059-015-0844-5 · Cited by 3,159
Dhamu Kp Ramamoorthy, K. (2016) · Cited by 2,962
HCA Lung Biological Network, Sungnak, W., Huang, N., Bécavin, C., Berg, M., Queen, R., Litvinukova, M., Talavera-López, C., Maatz, H., Reichart, D., et al. (2020) · Nature Medicine · doi:10.1038/s41591-020-0868-6 · Cited by 2,501
Cited by
Best practices for single-cell analysis across modalities
Heumos, L., Schaar, A. C., Lance, C., Litinetskaya, A., Drost, F., Zappia, L., Lücken, M. D., Strobl, D. C., Henao, J., Curion, F., et al. (2023) · Nature Reviews Genetics · doi:10.1038/s41576-023-00586-w · Cited by 1,051
“3).”
Confronting false discoveries in single-cell differential expression
Squair, J. W., Gautier, M., Kathe, C., Anderson, M. A., James, N. D., Hutson, T. H., Hudelle, R., Qaiser, T., Matson, K. J. E., Barraud, Q., et al. (2021) · doi:10.1101/2021.03.12.435024 · Cited by 1,086
Human microglial state dynamics in Alzheimer’s disease progression
Sun, N., Victor, M. B., Park, Y. P., Xiong, X., Scannail, A. N., Leary, N., Prosper, S., Viswanathan, S., Luna, X., Boix, C. A., et al. (2023) · Cell · doi:10.1016/j.cell.2023.08.037 · Cited by 462
Chan, J. M., Quintanal-Villalonga, Á., Gao, V. R., Xie, Y., Allaj, V., Chaudhary, O., Masilionis, I., Egger, J., Chow, A., Walle, T., et al. (2021) · Cancer Cell · doi:10.1016/j.ccell.2021.09.008 · Cited by 434
Profiling cell identity and tissue architecture with single-cell and spatial transcriptomics
Gulati, G. S., D’Silva, J. P., Liu, Y., Wang, L., & Newman, A. M. (2025) · Nature Reviews Molecular Cell Biology · doi:10.1038/s41580-024-00768-2 · Cited by 293
Metadata
- Authors
- Zimmerman, K. D., Espeland, M. A., & Langefeld, C. D.
- Affiliations
- Wake Forest University Health Sciences (US)
- Atrium Health Wake Forest Baptist (US)
- Corresponding author
- Zimmerman, Kip D.
- Langefeld, Carl D.
- Venue
- Nature Communications
- Published
- 2021-02-02
- Volume
- 12
- Issue
- 1
- Pages
- 738-738
- ISSN
- 2041-1723 (ISSN-L)
- PMC
- PMC7854630
- OpenAlex
- W3126641974
- Cited by
- 356
- References
- 51
- Citations by year
- 2026: 148 · 2025: 46 · 2024: 67 · 2023: 46 · 2022: 30 · 2021: 19
- FWCI
- 11.70
- Type
- journal article
- Language
- en
- Open access
- gold
- doi.org
- Licence
- cc-by
- creativecommons.org/licenses/by/4.0 (tdm)
- creativecommons.org/licenses/by/4.0 (vor)
- Locations
- Nature Communications (publishedVersion, cc-by)
- bioRxiv (Cold Spring Harbor Laboratory) (submittedVersion, cc-by)
- PubMed Central (publishedVersion, cc-by)
- PubMed (publishedVersion)
- RePEc: Research Papers in Economics (submittedVersion)
- DOAJ (DOAJ: Directory of Open Access Journals) (submittedVersion, cc-by-sa)
- Funders
- U.S. Department of Health & Human Services | National Institutes of Health (U01 NS036695)
- U.S. Department of Health & Human Services | NIH | National Cancer Institute (P30CA012197)
- Topics
- Life Sciences › Biochemistry, Genetics and Molecular Biology › Molecular Biology › Single-cell and spatial transcriptomics
- Life Sciences › Biochemistry, Genetics and Molecular Biology › Molecular Biology › Gene expression and cancer classification
- Physical Sciences › Mathematics › Statistics and Probability › Statistical Methods and Bayesian Inference
- Keywords
- pseudoreplication, single-cell data, generalized linear mixed models, differential gene expression, excess zeros, type I error rate, statistical power, research design, batch effect correction, hierarchical data structures
- MeSH terms
- Computer Simulation, Quality Control, Sequence Analysis, RNA, Transcriptome
About these checks
Registry, retraction, Cites and statistics results are computed, not judged, with one exception: a printed reference that no index lists is read once by a model before it counts as a citation error. Claims are extracted by a model and kept only when their quote appears verbatim in the text; each cited source is then checked, with a model’s help, for whether it says what the claim relies on. Those verdicts can be wrong — read the claim’s quote and the cited source before relying on one.
The claim verdicts this report counts are experimental: their accuracy is not yet measured.
A language model drew the claims from the paper on 2026-10-11, under version 3 of the claim definition (model deepseek-v4.1-flash, prompt extract-v3).
A second model labelled each claim on 2026-10-11 (model jev-1.13-20260917, definition revision gold-guideline-v0.2).
Cited sources are checked with a language model’s help (gpt-6-sol).
Statistics and arithmetic are recomputed, not judged.
Confidence bands are shown only for fields calibrated on our annotated test set. None is calibrated yet, so no band is shown.
What counts as a claim ›How we measure confidence ›How we check this ›
Are you an author, or do you see a problem with this page? Request a review
How to cite
Cite CoChat for the checks on this page, and the paper for its own findings.
- This page
- CoChat. (2026). Citation check: A practical solution to pseudoreplication bias in single-cell studies. https://app.cochat.ai/papers/10.1038/s41467-021-21038-1
- The paper
- Zimmerman, K. D., Espeland, M. A., & Langefeld, C. D. (2021). A practical solution to pseudoreplication bias in single-cell studies. Nature Communications. https://doi.org/10.1038/s41467-021-21038-1
Data sources
Bibliographic data: Semantic Scholar, OpenAlex, Crossref.
Contains information from the Semantic Scholar Academic Graph Datasets, made available under the ODC Attribution License (ODC-BY 1.0).
Semantic Scholar’s data is described in: Kinney, R., et al. (2023). The Semantic Scholar Open Data Platform. arXiv:2301.10140.
