The DOI matches its Crossref record; 92 of the 92 references it cites were found in a registry or an index.
Acetylated tau inhibits chaperone-mediated autophagy and promotes tau pathology propagation in mice
Open accessAbstract
Disrupted homeostasis of the microtubule binding protein tau is a shared feature of a set of neurodegenerative disorders known as tauopathies. Acetylation of soluble tau is an early pathological event in neurodegeneration. In this work, we find that a large fraction of neuronal tau is degraded by chaperone-mediated autophagy (CMA) whereas, upon acetylation, tau is preferentially degraded by macroautophagy and endosomal microautophagy. Rerouting of acetylated tau to these other autophagic pathways originates, in part, from the inhibitory effect that acetylated tau exerts on CMA and results in its extracellular release. In fact, experimental blockage of CMA enhances cell-to-cell propagation of pathogenic tau in a mouse model of tauopathy. Furthermore, analysis of lysosomes isolated from brains of patients with tauopathies demonstrates similar molecular mechanisms leading to CMA dysfunction. This study reveals that CMA failure in tauopathy brains alters tau homeostasis and could contribute to aggravate disease progression.
Overview
The claims and statistics of this paper haven’t been checked yet.
Run the check — free, no account needed. It reads the open-access text and checks the sources it cites.
Integrity signals
Registry
Cites
Statistics
Figures
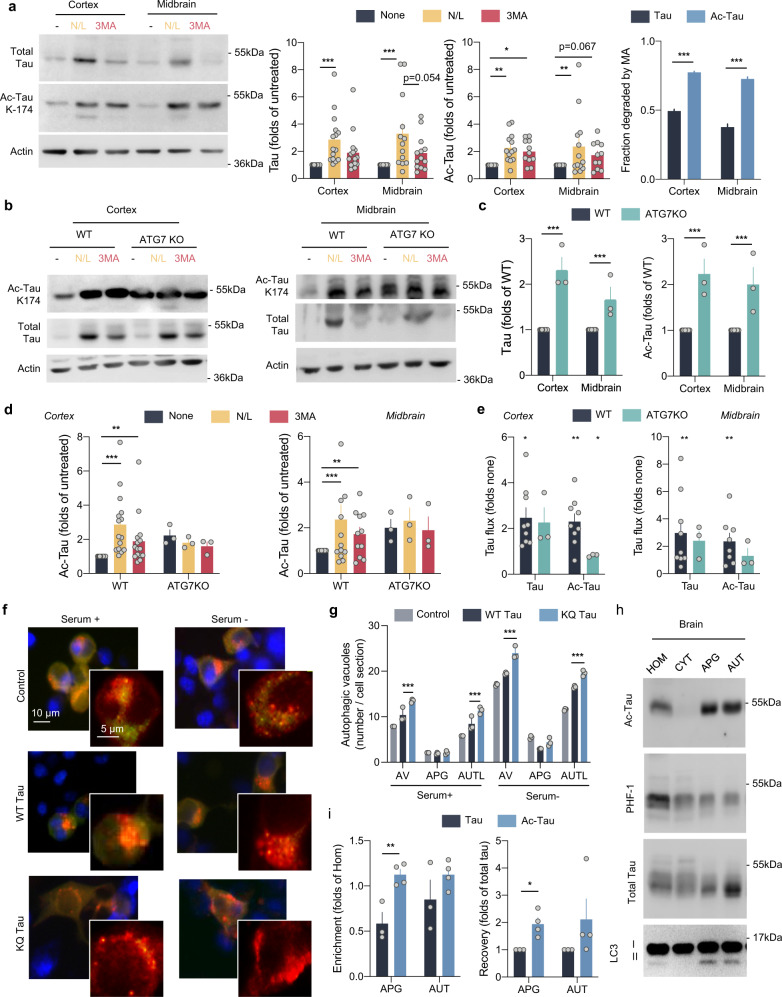
![Fig. 1 Acetylated tau is degraded by macroautophagy. a Brain slices from the mouse cortex or midbrain were incubated in the presence or absence of NH4Cl 20 mM and leupeptin 200 µM (N/L) or 3-methyladenine (3MA) 10 mM for 4 h at 37 °C and blotted for the indicated proteins. Right: Quantification of total tau (left) [Degradation pathway effect: F(2,78) = 14.31, p < 0.0001], acetylated tau (Ac-Tau; middle) [Degradation pathway effect: F(2,78) = 12.22, p < 0.0001], and fraction of tau degraded by macroautophagy (MA) [Tau status effect: F(1,52) = 507.2, p < 0.0001], n = 15 (for cortex) and 13 (for midbrain) mice per genotype. Controls of the selectivity of the acetylated antibody using brains from tau knockout mice and of the efficiency of the inhibitors are shown in Supplemental Fig. 1a, b. b–e Brain slices from wild-type (WT) and Atg7 knockout mice (ATG7KO) cortex or midbrain were incubated as in a and blotted for the indicated proteins. b Representative immunoblots. c Quantification of total and acetylated tau in two brain regions (cortex and midbrain) [Genotype effect: F(1,28) = 174, p < 0.0001]. d Changes of acetylated tau levels in both mice groups in the cortex (left) [Combined effect: F(2,42) = 4.280, p = 0.0203] and midbrain (right) [Degradation pathway effect: F(2,42) = 3.707, p = 0.0329], n = 3. Changes in total tau are shown in Supplemental Fig. 1d. e Flux of total and acetylated tau in the cortex (left) and midbrain (right) calculated as the fold increase in tau levels upon addition of N/L. f High content microscopy representative images of a mouse neuroblastoma cell line Neuro-2a (N2a) transduced with mCherry-GFP-LC3 and transfected with unmodified FLAG-wild-type Tau (WT) or acetylation-mimetic FLAG-K274,281Q tau (KQ) and maintained in the presence or absence of serum for 4 h. Nuclei are highlighted with DAPI in blue. Insets show higher magnification images of the two channels. n > 800 cells/condition in three different wells per day from cells transfected in 4 different days. g Quantification of total autophagic vacuoles (AV), autophagosomes (APG, yellow puncta), and autolysosomes (AUTL, red only puncta). n > 800 cells/condition in three different wells per day from cells transfected in 4 different days. Expression levels of both proteins upon transfection in N2a cells are shown in Supplemental Fig. 1h. [Serum+: Tau status effect: F(2,18) = 49.37, p < 0.0001; Serum−: Tau status effect: F(2,18) = 11.26, p = 0.0007] (h) Homogenate (HOM), Cytosol (CYT), Autophagosomes (APG), and Autolysosomes (AUT) were isolated from mouse brain and blotted for the indicated proteins. Representative immunoblot. n = 3 mice. i Quantification of enrichment (left) [Tau status effect: F(1,10) = 16.90, p = 0.0021] and recovery (right) [Tau status effect: F(1,10) = 16.92, p = 0.0021] of total tau and acetylated tau in the indicated fractions, n = 3 mice. All values are mean ± s.e.m. Statistical analysis were done using Two-way ANOVAs (panels a, c, d, g, and i) and two-tailed t-tests or Wilcoxon tests (panels e). Differences were significant with untreated or WT tau for *p < 0.05, **p < 0.01, ***p < 0.005. For clarity purposes, only relevant statistical comparisons are presented. Uncropped blots are shown in Supplemental Fig. 7.](/paper-figures/95eb2b52f2794244a04ea5abc667a239/acetylated-tau-inhibits-chaperone-mediated-autophagy-and-promotes-tau-pathology-figure-1.jpg)
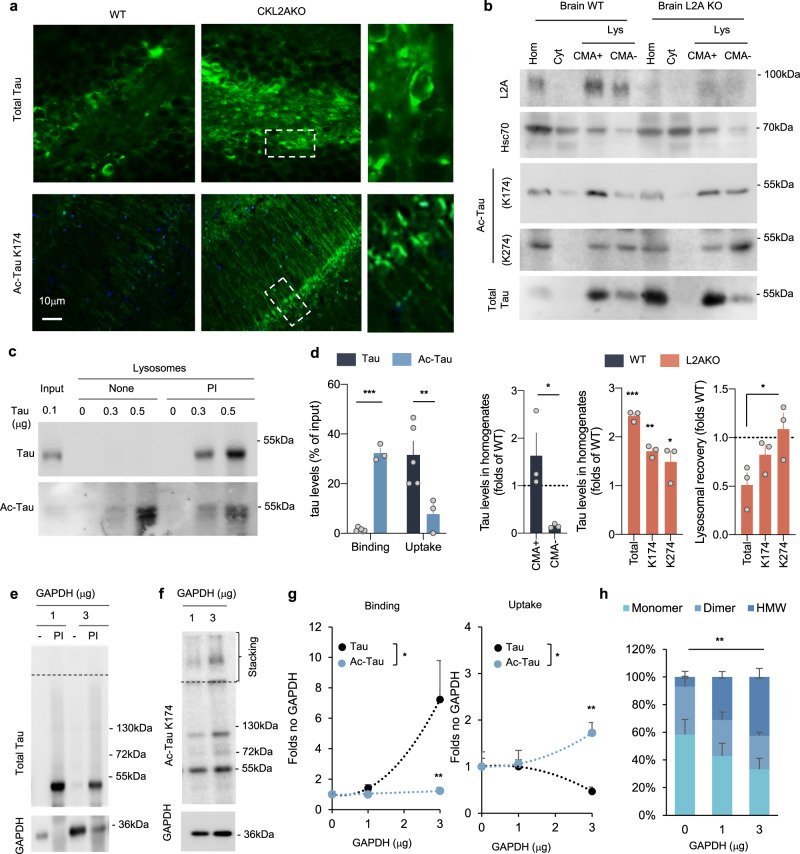
![Fig. 2 Acetylated tau associates with CMA-active lysosomes. a Immunofluorescence staining for tau and acetylated tau (Ac-Tau) of brain sections from wild-type (WT) and CaMKinaseIIα-Cre-L2A knockout mice (L2AKO). n = 3 mice. b Immunoblot for the indicated proteins of homogenate (Hom), Cytosol (Cyt), and two lysosomal (Lys) populations with different CMA activity (CMA+ and CMA−) isolated from WT and L2AKO mice brains. Bottom left plot: Quantification of the percentage of total tau recovered in the indicated fractions. [Two-tailed t-test t4 = 3.079, p = 0.037]. Bottom middle plot: Quantification of tau levels in L2AKO mice brain homogenate relative to WT (dotted line) [Two-way ANOVA Tau status effect: F(1,12) = 90.17, p < 0.0001]. Bottom, right plot: Quantification of recovery of tau levels in lysosomes from L2AKO mice brain relative to WT [One-way ANOVA interaction effect: F(2,6) = 4.58, p = 0.061; Total vs. K274 p = 0.041] n = 3 mice. c Immunoblots of isolated lysosomes pretreated or not with protease inhibitors (PI) and incubated with increasing concentrations of tau untreated (Tau) or acetylated in vitro (Ac-Tau). d Binding and uptake of tau calculated from quantification of immunoblots as the ones shown in c [Two-way ANOVA interaction effect: F(1,13) = 49.67, p < 0.0001], n = 3 independent experiments. e, f Effect of increasing concentrations of glyceraldehyde 3-phoshpate dehydrogenase (GAPDH) in the association of tau (e) and Ac-Tau (f) with isolated liver lysosomes pre-incubated or not with protease inhibitors (PI) as labeled. The dashed line indicates the separation between running and stacking. n = 3 independent experiments per type of tau and amount of GAPDH. g Quantification of the effect of increasing concentrations of GAPDH on binding [Two way ANOVA Tau status effect: F(1,12) = 6.033, p = 0.0302] and uptake [Two-way ANOVA Tau status effect: F(1,12) = 5.815, p = 0.0328] of control and acetylated tau (note that acetylated includes all variants independently of their molecular weight). n = 3 independent experiments. h Quantification of the percentage of lysosome-associated acetylated tau detected as monomer, dimer, or higher molecular weight (HMW) complexes in the stacking of the gel upon addition of GAPDH. n = 3 independent experiments [Two-way ANOVA interaction effect: F(4,18) = 4.894, p = 0.0076]. All values are mean ± s.e.m. Differences with unmodified tau were significant for *p < 0.05 05, **p < 0.01, ***p < 0.005. Uncropped blots are shown in Supplemental Fig. 7.](/paper-figures/ad4ccb6bf8e34b0c96660e9f33f42f1e/acetylated-tau-inhibits-chaperone-mediated-autophagy-and-promotes-tau-pathology-figure-2.jpg)
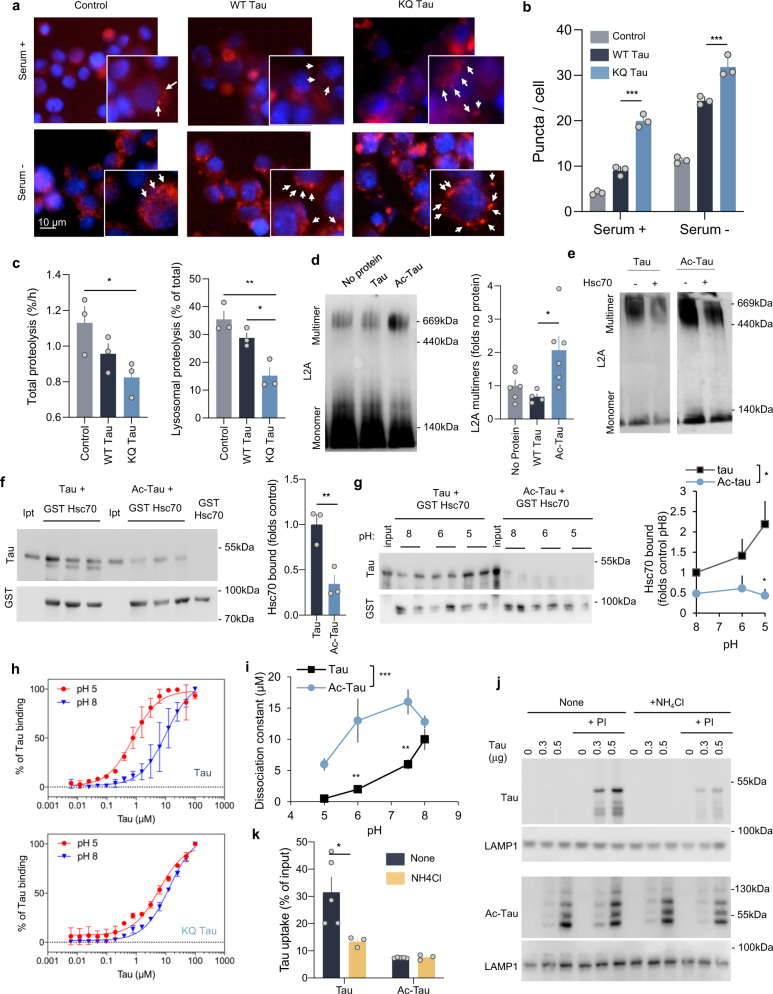
![Fig. 3 Acetylated tau has an inhibitory effect on CMA activity. a Representative images of mouse neuroblastoma cell line Neuro-2a (N2a) transduced with KFERQ-PS-Dendra2 and transfected with empty vector (Control), FLAG-wild-type tau (WT Tau) or FLAG-K274,281Q tau (KQ Tau), and maintained in the presence (+) or absence (−) of serum for 16 h. Nuclei are highlighted with DAPI in blue. Insets show higher magnification images and arrows point examples of fluorescent puncta. n > 800 cells/condition in three different wells and 4 independent experiments. b Quantification of an average number of puncta per cell section. [Two-way ANOVA Tau status effect: F(2,12) = 179.1, p < 0.0001], n > 800 cells/condition in three different wells, and n = 4 independent experiments. Controls for tau expression are shown in Supplemental Fig. 1h (protein levels) and Supplemental Fig. 3a (mRNA levels). c Degradation rates of long-lived proteins in N2a cells transfected as in a and radiolabeled for 48 h with 3H-leucine), [One-way ANOVA Tau status effect: F(2,6) = 4;619, p = 0.0610]. Right: fraction of degradation occurring in lysosomes (sensitive to inhibition of lysosomal proteolysis), [One-way ANOVA Tau status effect: F(2,6) = 14.55, p = 0.005], n = 3 independent experiments. d Immunoblot for L2A of isolated lysosomes subjected to blue-native electrophoresis after being incubated alone (No protein) or with unmodified (Tau) or in vitro acetylated tau (Ac-Tau). A 700-kDa multimeric complex and the 110-kDa monomer are shown. Right: Quantification of multimeric levels of L2A relative to those in lysosomes incubated alone. [One-way ANOVA Tau status effect: F(2,13) = 5.580, p = 0.0178], n = 4 independent experiments. e Lysosomes incubated and processed under the same conditions as in d but in the presence or absence of hsc70. f Immunoblot for tau of the GST-pulldowns of GST-hsc70 incubated with tau or Ac-Tau at neutral pH for 30 min at 37 °C. Input (Ipt): 1/10 of tau added to the incubation. Right: Quantification of tau bound to Hsc70. [Two-tailed t-test t4 = 4.432, p = 0.0114], n = 3. g Samples incubated as in f but at different pH. Right: Quantification of tau bound to hsc70 [Two-way ANOVA Tau status effect: F(1,18) = 10.85, p = 0.0040], n = 4 independent experiments. h Tau or K280Q tau binding assay to immobilized hsc70 determined by ELISA at the indicated pH. See also Supplemental Fig. 3b and c for binding assays at intermediate pH. n = 6 (in 2 independent experiments). i Summary plot of the binding assay at all tested pH for tau and acetylated tau (Ac-Tau). [Two-way ANOVA Tau status effect: F(1,8) = 42.10, p = 0.0002]. n = 6 (in 2 independent experiments). j Immunoblots of lysosomes from starved rat livers, pretreated or not with protease inhibitors (PI) and/or NH4Cl 20 mM for 10 min at 4 °C and then incubated with tau (left) or Ac-Tau (middle). n = 3 independent experiments. k Quantification of tau proteins binding and uptake by lysosomes. [Two-way ANOVA Tau status effect: F(1,17) = 17.22, p = 0.0013], n = 3 independent experiments. All values are mean ± s.e.m. Differences with control or unmodified tau were significant for *p < 0.05, **p < 0.01, ***p < 0.005. Uncropped blots are shown in Supplemental Fig. 7.](/paper-figures/a40d4d48e5b041f48d0fef78e6bdb201/acetylated-tau-inhibits-chaperone-mediated-autophagy-and-promotes-tau-pathology-figure-3.jpg)
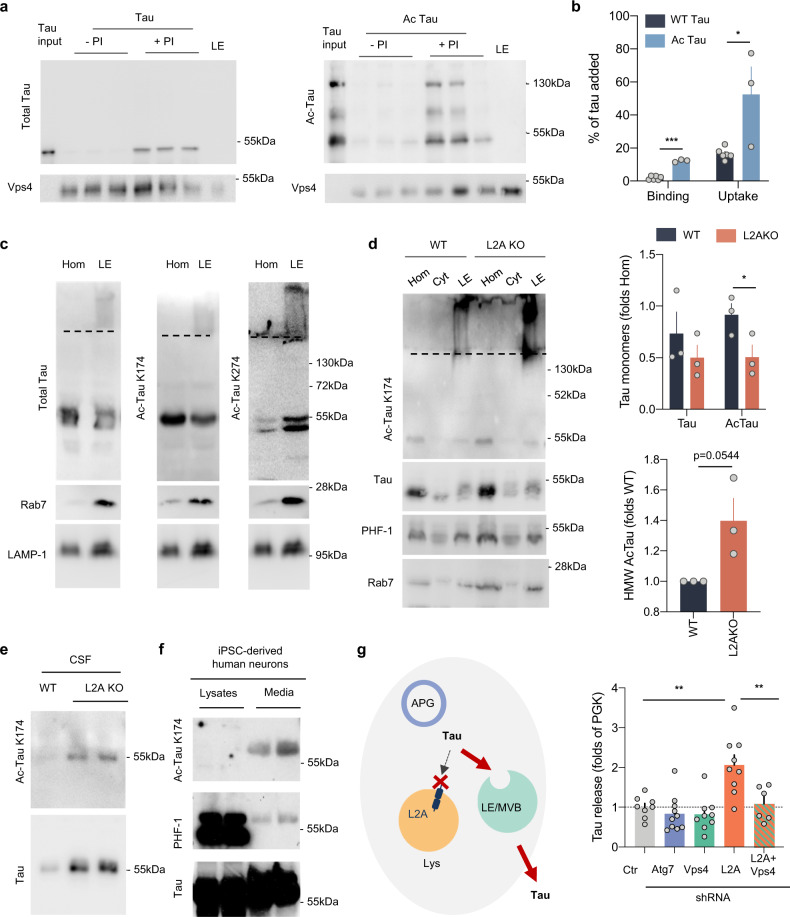
![Fig. 4 Acetylated tau and endosomal microautophagy. a Immunoblots of late endosomes (LE) isolated from tau-null mice brains, pretreated or not with protease inhibitors (PI), and incubated with tau or in vitro acetylated tau (Ac-tau). Tau input is 1/5 of the protein added. b Quantification of endosomal binding [Two-tailed t-test t7 = 13.80, p < 0.0001] and uptake [Two-tailed t-test t7 = 3.239, p = 0.0143] of tau proteins from blots as in a. n = 3 mice. c Immunoblot with the indicated antibodies of homogenate (Hom) and late endosomes (LE) isolated from mice brain. A dashed line indicates the separation between running and stacking in the gel. The same homogenate and LE fractions were loaded in triplicate in a membrane and strips of the membrane were separately incubated with each of the antibodies to allow for comparison among antibodies. d Immunoblot for the indicated antibodies of Hom, cytosol (Cyt), and LE isolated from brains of wild-type (WT) and L2A knock-out mice (L2A KO). Dashed lines as in c. Right: quantification of the amount of total and acetylated tau in monomer [Two-way ANOVA genotype effect: F(1,8) = 10.56, p = 0.0117] and in high molecular weight (HMW) complexes [Two-tailed t-test t4 = 2.694, p = 0.0545]. n = 4 mice. e Immunoblot for total and acetylated tau in CSF isolated from wild-type and L2AKO mice. n = 3 mice per genotype were pooled for each immunoblot; the 2 samples shown here correspond to isolations done in 2 separate days. f Immunoblot for the indicated forms of tau of lysates and culture media from iPSC-derived human neurons upon stimulation with KCl for 30 min. Note: saturated bands are shown for the lysates in the PHF-1 membrane to illustrate the small amount of phosphorylated tau detected in the media. n = 4 different experiments performed in 2 different iPSC cell lines. g Left: Scheme illustrating rerouting of tau towards LE/MVB upon blockage of CMA and extracellular release of tau after fusion of LE/MVB with the plasma membrane. APG: autophagosome, Lys: lysosome. Right: Quantification of extracellular tau using ELISA upon blockage of the various autophagy pathways in N2a cells expressing human P301LTau. Vps4: VPS4 knock-down, L2A: L2A knock-down, Atg7: ATG7 knock-down, L2A + Vps4: a combination of L2A and VPS4 knock-down. The efficiency of the different knock-downs is shown in Supplemental Fig. 4c. Values are expressed as the fold on PGK (Control). [One-way ANOVA F(4,37) = 9.542, p < 0.0001]. n = 8, 10, 9, 9, 6 (in order of genotype shown in the graph) independent experiments. All values are mean ± s.e.m. Differences with control or unmodified tau were significant for *p < 0.05, **p < 0.005. Uncropped blots are shown in Supplemental Fig. 7.](/paper-figures/b611a470e5854d72b9f12a5300d9f7ac/acetylated-tau-inhibits-chaperone-mediated-autophagy-and-promotes-tau-pathology-figure-4.jpg)
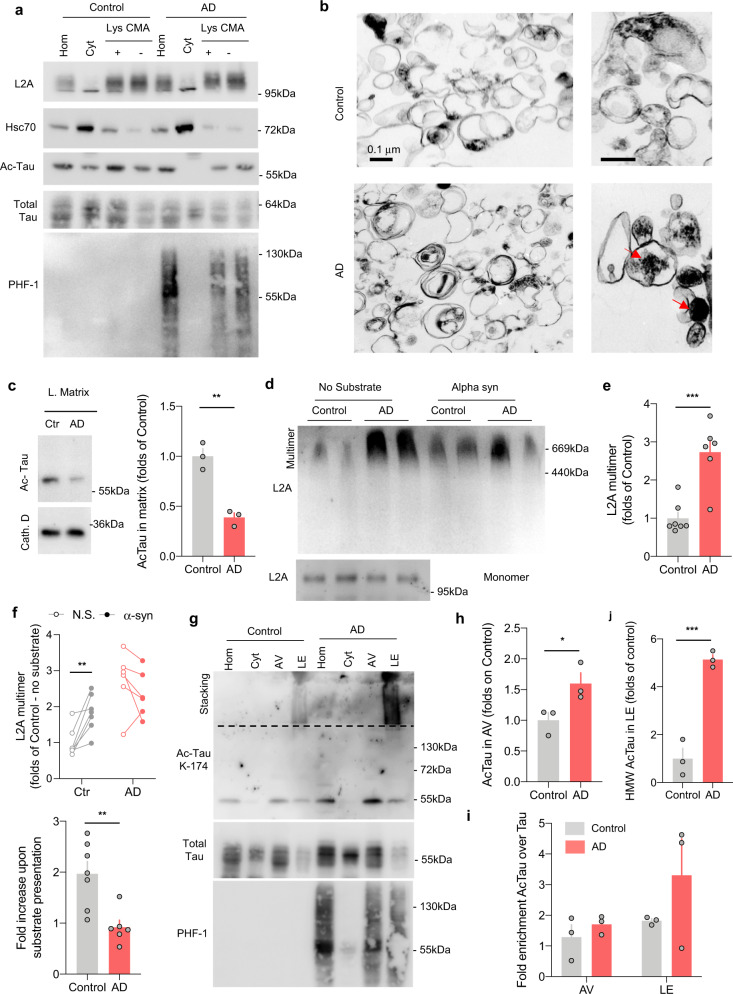
![Fig. 5 Changes in the association of tau with autophagic and lysosomal compartments in Alzheimer’s disease patient brains. a Immunoblots for the indicated proteins of homogenates (Hom), cytosol (Cyt), and two populations of lysosomes (Lys) with different CMA activity (CMA+ and CMA−) isolated from the frontal area of brains from patients with Alzheimer’s Disease (AD, n = 6) and non-neurological patients of matching age (Control, n = 7). b Pictures of CMA-active lysosomes isolated from control (n = 3) or AD (n = 3) patients’ brains and subjected to electron microscopy. Right: higher magnification inserts. Red arrows: undegraded dense lipofuscin-like material. Differences noted in the images were reproducible in the 3 brains. c Immunoblot for acetylated tau (Ac-Tau) in lysosomal matrices from control and AD patients. Right: Quantification of the amount of acetylated tau (Ac-Tau) internalized in AD patients’ lysosomes relative to control [Two-tailed t-test t4 = 6.831, p = 0.0024]. n = 3 samples (1 per brain) per group. d Immunoblot from L2A of the blue-native electrophoresis of lysosomes isolated as in a and incubated alone (No substrate) or in the presence of 1 µg of purified alpha-synuclein (Alpha syn). Two different individuals per diagnosis are shown. Multimer: indicates the 700-kDa multimeric translocation complex. Monomer: insert of the monomer run in a different gel. n = 6 control and 6 AD patient brains. e Quantification of multimeric L2A levels relative to those in control lysosomes in absence of substrate [Two-tailed t-test t11 = 4.936, p = 0.0004]. n = 7 control and 6 AD patient brains. f Quantification of multimeric L2A levels in absence of substrate (N.S.) or upon substrate (α-syn) presentation. Top changes of multimeric L2A for individual subjects. Bottom: Fold increase of L2A multimers upon substrate presentation [Two-tailed t-test t11 = 3.607, p = 0.0041]. n = 7 controls and 6 AD patient brains. g Immunoblots for the indicated proteins of homogenates (Hom), cytosol (Cyt), autophagic vacuoles (AV), and late endosomes (LE) isolated from patients with Alzheimer’s Disease (AD) and non-neurological patients of matching age (Control). n = 3 samples (1 per brain) per condition. h Quantification of the abundance of acetylated tau in autophagic vesicles [Two-tailed t-test t4 = 2.805, p = 0.0486]. n = 3 samples (1 per brain) per group. I, j Quantification of the ratio of acetylated to total tau in the indicated fraction (i) and of the abundance of the high molecular weight (HMW) acetylated tau species in LE (j). [Two-tailed t-test t4 = 8.719, p = 0.001]. n = 3 samples (1 per brain) per group. All values are mean ± s.e.m. Differences with control were significant for *p < 0.05, **p < 0.01, ***p < 0.005. Uncropped blots are shown in Supplemental Fig. 7.](/paper-figures/b6142f6856664f2eb8096d8c43df0e6e/acetylated-tau-inhibits-chaperone-mediated-autophagy-and-promotes-tau-pathology-figure-5.jpg)
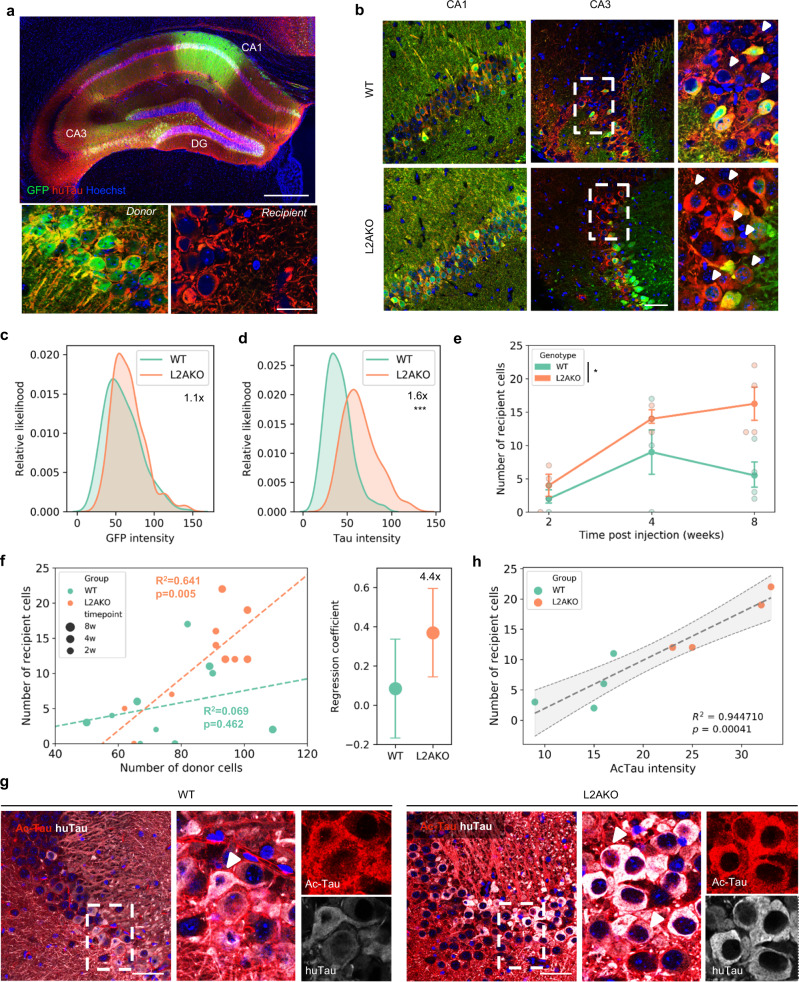
![Fig. 6 CMA deficiency accelerates Tau spreading. a Example of immunofluorescence for human tau (huTau-red) and GFP (Green) of the whole hippocampal formation in coronal section. Bottom pictures are representative pictures of donor [GFP+/huTau+] and recipient [GFP−/huTau+] cells. Scale bars: top: 100 µm; bottom 20 µm. n = 20 mice (10 WT and 10 L2AKO). b Representative images of Tau and GFP levels in CA1 (injection site) and CA3 (spreading site) in WT and L2AKO mice at 8 weeks after surgery. Scale bar: 50 µm. n = 4 mice per genotype. c Distribution of GFP intensity in donor cells (with kernel density estimation) in WT and L2AKO mice. d Distribution of human Tau intensity in donor cells (with kernel density estimation) in WT and L2AKO mice [Two-tailed t-test t553 = 16.113, p = 3.69 × 10−48]. e Number of recipient cells over time [Two-way ANOVA genotype effect: F(1,14) = 7.668, p = 0.0151]. n = 3, 3, and 4 mice per genotype at 2, 4, and 8 weeks, respectively. f Left: scatterplot showing the average number of recipient versus donor cells per mouse. Dotted lines are the linear regression per genotype. Right: slopes of the linear regression between recipient and donor cells per genotype. n = 3, 3, and 4 mice per genotype at 2, 4, and 8 weeks, respectively. h Scatterplot showing the average intensity of acetylated tau in donor cells versus the average number of recipient cells per mouse. The dotted line is the mean linear regression +/−95% confidence interval (gray zone). g Levels of human tau (huTau) and K174 acetylated tau (ac-Tau) in recipient cells between WT and L2AKO mice. n = 4 mice per genotype. Scale bar: 50 µm. All values are mean ± s.e.m. except otherwise specified. Differences with WT mice were significant for *p < 0.05, ***p < 0.0005.](/paper-figures/cae3ecc832864914854a4396284ddfbc/acetylated-tau-inhibits-chaperone-mediated-autophagy-and-promotes-tau-pathology-figure-6.jpg)
Verification
Claims the paper makes
The claims and statistics of this paper haven’t been checked yet.
Run the check — free, no account needed. It reads the open-access text and checks the sources it cites.
Claims other papers make about this one
Each is checked against this paper’s own text: does it say what the citing paper says it does?
The check wasn’t confident either way, so it gives no verdict — never disputed.
In the citing paper
“The balance between cell proliferation and programmed cell death is altered in LSDs as well as neurodegenerative disorders.26,27”
From The lysosome and proteostatic stress at the intersection of pediatric neurological disorders and adult neurodegenerative diseases (2025) · cites this paper as [27]
Experimental — accuracy not yet measuredIn the citing paper
“In addition, the acetylation of tau is an early pathological feature of neurodegeneration. Acetylated tau inhibits its degradation, promotes pathological aggregation and propagation, and contributes to tauopathy [46–51].”
From Tau and neuroinflammation in Alzheimer’s disease: interplay mechanisms and clinical translation (2023) · cites this paper as [50]
In the citing paper
“Blockage of CMA leads to rerouting of some of the pathogenic forms of MAPT/tau toward endosomal microautophagy, as both pathways share the same chaperone, HSPA8, and this promotes fusion of late endosomes with the plasma membrane and subsequent extraneuronal release of the MAPT/tau variants, thus contributing to MAPT/tau propagation (Caballero et al, 2021).”
From Autophagy in major human diseases (2021) · cites this paper as Caballero et al, 2021
In the citing paper
“However, mutations and posttranslational modifications of this protein, such as acetylation, not only prevent MAPT/tau degradation by CMA but also inhibit normal CMA functioning (Caballero et al, 2018; Caballero et al, 2021).”
From Autophagy in major human diseases (2021) · cites this paper as Caballero et al, 2021
In the citing paper
“Chaperone‐mediated autophagy also contributes to degradation of a large fraction of neuronal MAPT/tau under physiological conditions (Caballero et al, 2018; Caballero et al, 2021).”
From Autophagy in major human diseases (2021) · cites this paper as Caballero et al, 2021
In the citing paper
“Reduction in neuronal CMA activity has been recently shown in AD patient's brains (Bourdenx et al, 2021; Caballero et al, 2021)”
From Autophagy in major human diseases (2021) · cites this paper as Caballero et al, 2021
Self-check
Percentages, sums and reported differences re-computed from the paper’s own numbers.
The self-check needs the paper’s full text.
Citations
Cites
PROTEIN MEASUREMENT WITH THE FOLIN PHENOL REAGENT
Lowry, O. H., Rosebrough, N., Farr, A. L., & Randall, R. (1951) · Journal of Biological Chemistry · doi:10.1016/s0021-9258(19)52451-6 · Cited by 316,394
Analysis of Relative Gene Expression Data Using Real-Time Quantitative PCR and the 2−ΔΔCT Method
Livak, K. J., & Schmittgen, T. D. (2001) · Methods · doi:10.1006/meth.2001.1262 · Cited by 180,860
Towbin, H., Staehelin, T., & Gordon, J. (1979) · Proceedings of the National Academy of Sciences · doi:10.1073/pnas.76.9.4350 · Cited by 53,218
Raza, H., John, A., & Nemmar, A. (2013) · Cellular Physiology and Biochemistry · doi:10.1159/000350087 · Cited by 47,311
Repertoires of Autophagy in the Pathogenesis of Ocular Diseases
Li, Y., Jiang, Q. L., Cao, G.-F., Yao, J., & Yan, B. (2015) · Cellular Physiology and Biochemistry · doi:10.1159/000373980 · Cited by 16,351
Neuropathological stageing of Alzheimer-related changes.
Braak, H., & Braak, E. (1991) · Acta Neuropathologica · doi:10.1007/bf00308809 · Cited by 16,123
Amyloid oligomers exacerbate tau pathology in a mouse model of tauopathy
Selenica, M.-L. B., Brownlow, M., Jimenez, J. P., Lee, D. C., Pena, G., Dickey, C. A., Gordon, M. N., & Morgan, D. (2013) · Neurodegenerative Diseases · doi:10.1159/000337230 · Cited by 10,359
Autophagy: Renovation of Cells and Tissues
Mizushima, N., & Komatsu, M. (2011) · Cell · doi:10.1016/j.cell.2011.10.026 · Cited by 6,598
Cui, C., Cui, J., Jin, F., Cui, Y., Li, R., Jiang, X., Tian, Y., Wang, R. C., Jiang, P., & Gao, J. (2017) · Cellular Physiology and Biochemistry · doi:10.1159/000479571 · Cited by 5,214
Mutation of the mouse klotho gene leads to a syndrome resembling ageing
Kuro-o, M., Matsumura, Y., Aizawa, H., Kawaguchi, H., Suga, T., Utsugi, T., Ohyama, Y., Kurabayashi, M., Kaname, T., Kume, E., et al. (1997) · Nature · doi:10.1038/36285 · Cited by 3,837
Research works printed but not linked: 1
- Morris, M., Maeda, S., Vossel, K. & Mucke, L. The many faces of Tau. Neuron 70, 410–426 (2011). · DOI · Paper page
Cited by
Sorted by citations
Items 201–223 of 223
Hegde, A., Upadhyay, S. S., Prasad, T. S. K., & Modi, P. K. (2023) · Elsevier eBooks · doi:10.1016/b978-0-443-19084-1.00007-7
Presenilin-dependent regulation of tau pathology via the autophagy/proteasome pathwayPreprint
del Ser‐Badia, A., Soto-Faguás, C. M., Vecino, R., Rodrı́guez-Álvarez, J., Vicario‐Abejón, C., & Saura, C. A. (2023) · bioRxiv (Cold Spring Harbor Laboratory) · doi:10.1101/2023.12.21.572822
Tittelmeier, J., Sandhof, C. A., Martin, N., El-Kabarity, D., Ngonza-Nito, S.-B., Melki, R., & Nussbaum-Krammer, C. I. (2025) · eLife · doi:10.7554/elife.106865
Autophagy and Its Role in Neurodegenerative Diseases
Kara, F., Mavzer, A., Karalik, İ., & Baran, A. S. (2025) · IGI Global eBooks · doi:10.4018/979-8-3693-5908-2.ch001
Bakkar, N. Z., Arida, R. E., Soliman, A. Y., & EL‐Yazbi, A. F. (2025) · Elsevier eBooks · doi:10.1016/b978-0-443-32852-7.00016-4
Impaired MAPT/tau-secretory lysosomes are linked to cognitive vulnerability in Alzheimer patients
Sharma, P., Pallavi, A., Chatterjee, A., Prasad, V. M., Gandasi, N. R., & Saroja, S. R. (2025) · Autophagy · doi:10.1080/15548627.2025.2552905
Autophagy and Neuroinflammatory Pathways in Alzheimer’s Disease
Gupta, R. V., Pawar, J. S., Gujjari, L., & Kumari, S. (2025) · Springer eBooks · doi:10.1007/978-981-95-3945-1_8
Yang, L., Chen, S., Xia, J., Zhou, Y., Peng, L., Fan, H., Han, Y., Duan, L., Cheng, G., Yang, H., et al. (2022) · Figshare · doi:10.6084/m9.figshare.20003231
Gojani, E. G., Farzin, H., Sutherland, R. J., & Mohajerani, M. H. (2026) · Neuroscience & Biobehavioral Reviews · doi:10.1016/j.neubiorev.2026.106619
The Role of Presynaptic Cytomatrix Protein Bassoon (BSN) in Tau Pathology and Propagation
Oo, W. J., Sia, W. T., Lee, J. Y., Chen, C. H., Chang, W., & Chye, S. M. (2026) · CNS & Neurological Disorders - Drug Targets · doi:10.2174/0118715273400895251129055504
Alzheimer’s disease : epistemology, ethics, innovation
Daly, T. P. (2021) · theses.fr (ABES) · doi:10.70675/6e99838az7dd4z402fz98fdzeca072d3ad13
Grabinska-Rogala, A., & Gestwicki, J. E. (2026) · Topics in medicinal chemistry · doi:10.1007/7355_2026_190
Self-citationYadav, R. K., Swarup, V., Ahuja, A., Talukdar, D., Garg, D., Aski, M. S., Srivastava, A. K., & Yadav, P. S. (2026) · Free Radical Biology and Medicine · doi:10.1016/j.freeradbiomed.2026.06.031
The drug discovery landscape of Alzheimer’s disease
Chinnathambi, S., & Prakash, L. E. (2026) · Advances in protein chemistry and structural biology · doi:10.1016/bs.apcsb.2026.07.005
Endolysosomal pathway and autophagy dysregulation in Alzheimer’s disease
Singh, A., Gulati, I., Darshna, D., & Tiwari, S. S. (2026) · International review of neurobiology · doi:10.1016/bs.irn.2026.08.002
Autophagy-lysosomal pathway in neurodegeneration
McDonough, S. R., Rao, A. K., McAleer, J. M., Babrowicz, B. M., & Sharma, M. (2026) · Molecular Neurodegeneration Advances · doi:10.1186/s44477-026-00041-0
Chaperone-mediated autophagy in physiological homeostasis, disease and ageing
Kaushik, S., & Cuervo, A. M. (2026) · Nature Reviews Molecular Cell Biology · doi:10.1038/s41580-026-01023-6
Self-citationBasavaraju, K. C., & G., P. P. C. (2026) · Biochemical and Biophysical Research Communications · doi:10.1016/j.bbrc.2026.154717
Nimavard, R. T., Sadeghi, S. A., Colón-Rosado, J. A., Yue, Y., Fang, F., Hagar, H. C., Kuo, M.-H., & Sun, L. (2026) · Journal of Proteome Research · doi:10.1021/acs.jproteome.6c00539
Astrocytic timekeepers and their influence on brain waste clearance in Alzheimer's disease
Koenders, C. L., Chiu, R. K., Medeiros-Furquim, T., & Bergink, S. (2026) · Neurobiology of Sleep and Circadian Rhythms · doi:10.1016/j.nbscr.2026.100155
Lyagin, I. (2026) · Moscow University Chemistry Bulletin · doi:10.3103/s0027131426700276
Abd-Elraouf, K., Murphy, D. T., Cheong, L. Y. T., Zeng, J., & Lo, C. H. (2026) · Translational Neurodegeneration · doi:10.1186/s40035-026-00591-z
Metadata
- Authors
- Caballero, B., Bourdenx, M., Luengo, E., Diaz, A., Sohn, P. D., Chen, X., Wang, C., Juste, Y. R., Wegmann, S., Patel, B., Young, Z. T., Kuo, S. Y., Rodriguez-Navarro, J. A., Shao, H., Lopez, M. G., Karch, C. M., Goate, A. M., Gestwicki, J. E., Hyman, B. T., Gan, L., & Cuervo, A. M.
- Affiliations
- Albert Einstein College of Medicine (US)
- Centre National de la Recherche Scientifique (FR)
- Weill Cornell Medicine (US)
- Harvard University (US)
- University of California, San Francisco (US)
- Washington University in St. Louis (US)
- Icahn School of Medicine at Mount Sinai (US)
- ORCID
- Venue
- Nature Communications
- Published
- 2021-04-14
- Volume
- 12
- Issue
- 1
- Pages
- 2238-2238
- ISSN
- 2041-1723 (ISSN-L)
- PMC
- PMC8047017
- OpenAlex
- W3154991192
- Cited by
- 223
- References
- 92
- Citations by year
- 2026: 29 · 2025: 61 · 2024: 30 · 2023: 47 · 2022: 42 · 2021: 14
- FWCI
- 20.89
- Type
- journal article
- Language
- en
- Open access
- gold
- doi.org
- Locations
- Nature Communications (publishedVersion, cc-by)
- PubMed Central (publishedVersion, cc-by)
- PubMed (publishedVersion)
- Digital Commons@Becker (Washington University School of Medicine) (submittedVersion, cc-by)
- RePEc: Research Papers in Economics (submittedVersion)
- DOAJ (DOAJ: Directory of Open Access Journals) (submittedVersion, cc-by-sa)
- eScholarship (California Digital Library) (submittedVersion)
- eScholarship (California Digital Library) (submittedVersion, cc-by)
- DZNE Pub (submittedVersion, other-oa)
- Funders
- Fundación Tatiana Pérez de Guzmán el Bueno (Fellowship)
- U.S. Department of Health & Human Services | National Institutes of Health (T32 GM007491)
- Charles H. Revson Foundation (CP13-00234)
- Rainwaters Foundation
- U.S. Department of Health & Human Services | NIH | National Institute on Aging (AG05681, AG058674, AG036884, AG021904, AG054108, AG031782, AG038072)
- Rainwaters Foundation JPB Foundation
- U.S. Department of Health & Human Services | NIH | National Institute of Neurological Disorders and Stroke (NS100717)
- Rainwaters Foundation Backus Foundation JPB Foundation
- Topics
- Life Sciences › Neuroscience › Cellular and Molecular Neuroscience › Alzheimer's disease research and treatments
- Life Sciences › Biochemistry, Genetics and Molecular Biology › Cell Biology › Autophagy in Disease and Therapy
- Life Sciences › Biochemistry, Genetics and Molecular Biology › Molecular Biology › Heat shock proteins research
- Keywords
- tau acetylation, chaperone-mediated autophagy, tauopathy, tau degradation, macroautophagy, microautophagy, lysosomes, cell-to-cell transmission, neurodegeneration
- MeSH terms
- Chaperone-Mediated Autophagy, Acetylation, Animals, Brain, Female, Humans, Male, Mice, Inbred C57BL, Neurons, tau Proteins, Tauopathies, Mice
About these checks
Registry, retraction, Cites and statistics results are computed, not judged, with one exception: a printed reference that no index lists is read once by a model before it counts as a citation error. Claims are extracted by a model and kept only when their quote appears verbatim in the text; each cited source is then checked, with a model’s help, for whether it says what the claim relies on. Those verdicts can be wrong — read the claim’s quote and the cited source before relying on one.
Statistics and arithmetic are recomputed, not judged.
Confidence bands are shown only for fields calibrated on our annotated test set. None is calibrated yet, so no band is shown.
What counts as a claim ›How we measure confidence ›How we check this ›
Are you an author, or do you see a problem with this page? Request a review