Cited by 116Stress Responses and CortisolNeurotransmitter Receptor Influence on BehaviorNeural and Behavioral Psychology Studies

The DOI matches its Crossref record; 148 of the 148 references it cites were found in a registry or an index.

Real-world stress resilience is associated with the responsivity of the locus coeruleus

Open access

Abstract

Individuals may show different responses to stressful events. Here, we investigate the neurobiological basis of stress resilience, by showing that neural responsitivity of the noradrenergic locus coeruleus (LC-NE) and associated pupil responses are related to the subsequent change in measures of anxiety and depression in response to prolonged real-life stress. We acquired fMRI and pupillometry data during an emotional-conflict task in medical residents before they underwent stressful emergency-room internships known to be a risk factor for anxiety and depression. The LC-NE conflict response and its functional coupling with the amygdala was associated with stress-related symptom changes in response to the internship. A similar relationship was found for pupil-dilation, a potential marker of LC-NE firing. Our results provide insights into the noradrenergic basis of conflict generation, adaptation and stress resilience.

Overview

The claims and statistics of this paper haven’t been checked yet.

Run the check — free, no account needed. It reads the open-access text and checks the sources it cites.

A few free checks a day · papers already verified open instantly · results are public

Integrity signals

Registry

Crossref · 10.1038/s41467-021-22509-1

Cites

148 of 148 references verified0 citation errors · 0 not checkable

Statistics

Figures

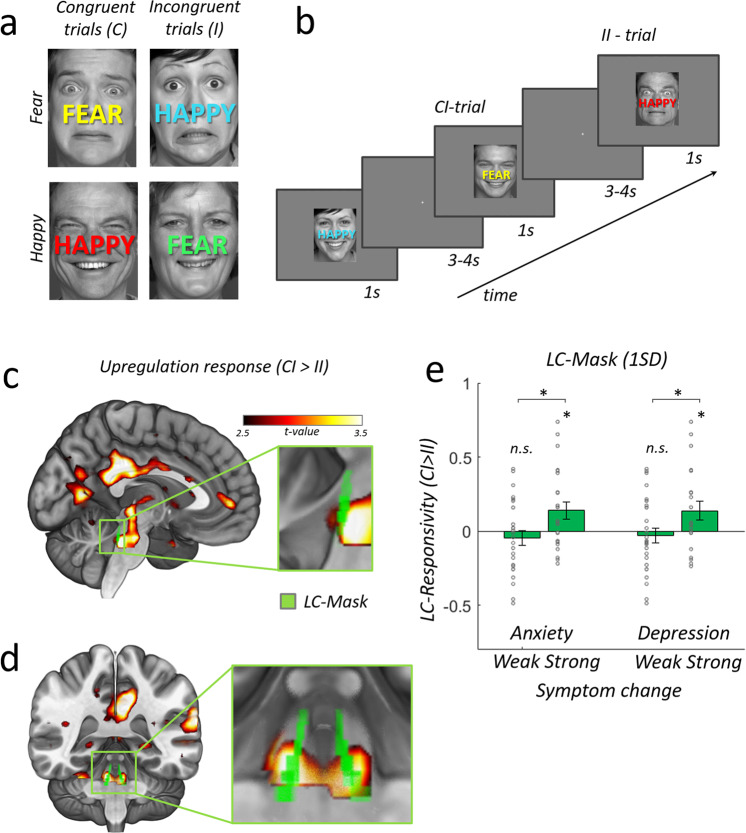
Fig. 1 Experimental task and neural conflict-induced upregulation responses (CI > II). a Example stimuli illustrating all four possible face/word combinations in the emotional-stroop task. Face stimuli used in our experiment were identical to the face stimuli used in Etkin et al. 2006. For illustrative purposes, we have replaced these images here with open access face stimuli (https://faces.mpdl.mpg.de/imeji/). Participants were instructed to react to the facial expression while ignoring the overlaid word and to answer as fast and accurately as possible. On each trial, the word color was randomly assigned in order to avoid adaptation effects. b Trial presentation schedule. A CI-trial is an incongruent trial preceded by a congruent trial. An II-trial is an incongruent trial preceded by an incongruent trial. Subtracting neural responses for II from CI trials reveals regions involved in the upregulation response (CI > II), while subtracting neural responses for CI from II trials reveals regions associated with implicit conflict adaptation (II > CI). See Supplemental Methods for details on stimulus presentation and counterbalancing of conditions. c Cortical and subcortical regions involved in generating an upregulation response to resolve conflict. Mid-saggital slice with activation clusters shows higher activity to incongruent trials preceded by a congruent trial (CI) as compared to incongruent trials preceded by an incongruent trial (II) (left superior temporal cortex (STC), posterior cingulate cortex (PCC), anterior visual cortex and a large subcortical cluster, FWE-cluster-correction at p = 0.05 with cluster-forming-threshold at p = 0.001, One-sample t test, one-sided, the pseudo-color-map illustrating the one-sample t statistic applies to all panels). Inset shows magnified lateral-view of subcortical cluster and an overlaid locus coeruleus mask in green (2SD-mask from Keren et al.88). d Coronal view of standard brain and magnified view of bilateral LC upregulation response (hot colors) overlaid with LC mask (green). e Participants (N = 48) with high subsequent anxiety/depression symptom changes show significantly stronger LC-NE responsivity (CI > II) than participants with lower symptom changes (median split), two-sample t test, two-sided, anxiety: p = 0.019; T = 2.431, depression: p = 0.037; T = 2.154. Bar plots show the LC-responsivity strength extracted from the CI > II contrast in the physiological noise controlled, unsmoothed data as weighted-average of LC-1SD mask voxels (see Supplemental Fig. S8 for detailed statistics and comparison with LC-2SD mask voxels). Single dots show individual data. Errorbars represent ±SEM. *p < 0.05. Source data are provided as a Source Data file.
Fig. 1 Experimental task and neural conflict-induced upregulation responses (CI > II). a Example stimuli illustrating all four possible face/word combinations in the emotional-stroop task. Face stimuli used in our experiment were identical to the face stimuli used in Etkin et al. 2006. For illustrative purposes, we have replaced these images here with open access face stimuli (https://faces.mpdl.mpg.de/imeji/). Participants were instructed to react to the facial expression while ignoring the overlaid word and to answer as fast and accurately as possible. On each trial, the word color was randomly assigned in order to avoid adaptation effects. b Trial presentation schedule. A CI-trial is an incongruent trial preceded by a congruent trial. An II-trial is an incongruent trial preceded by an incongruent trial. Subtracting neural responses for II from CI trials reveals regions involved in the upregulation response (CI > II), while subtracting neural responses for CI from II trials reveals regions associated with implicit conflict adaptation (II > CI). See Supplemental Methods for details on stimulus presentation and counterbalancing of conditions. c Cortical and subcortical regions involved in generating an upregulation response to resolve conflict. Mid-saggital slice with activation clusters shows higher activity to incongruent trials preceded by a congruent trial (CI) as compared to incongruent trials preceded by an incongruent trial (II) (left superior temporal cortex (STC), posterior cingulate cortex (PCC), anterior visual cortex and a large subcortical cluster, FWE-cluster-correction at p = 0.05 with cluster-forming-threshold at p = 0.001, One-sample t test, one-sided, the pseudo-color-map illustrating the one-sample t statistic applies to all panels). Inset shows magnified lateral-view of subcortical cluster and an overlaid locus coeruleus mask in green (2SD-mask from Keren et al.88). d Coronal view of standard brain and magnified view of bilateral LC upregulation response (hot colors) overlaid with LC mask (green). e Participants (N = 48) with high subsequent anxiety/depression symptom changes show significantly stronger LC-NE responsivity (CI > II) than participants with lower symptom changes (median split), two-sample t test, two-sided, anxiety: p = 0.019; T = 2.431, depression: p = 0.037; T = 2.154. Bar plots show the LC-responsivity strength extracted from the CI > II contrast in the physiological noise controlled, unsmoothed data as weighted-average of LC-1SD mask voxels (see Supplemental Fig. S8 for detailed statistics and comparison with LC-2SD mask voxels). Single dots show individual data. Errorbars represent ±SEM. *p < 0.05. Source data are provided as a Source Data file.CC BY · PubMed Central
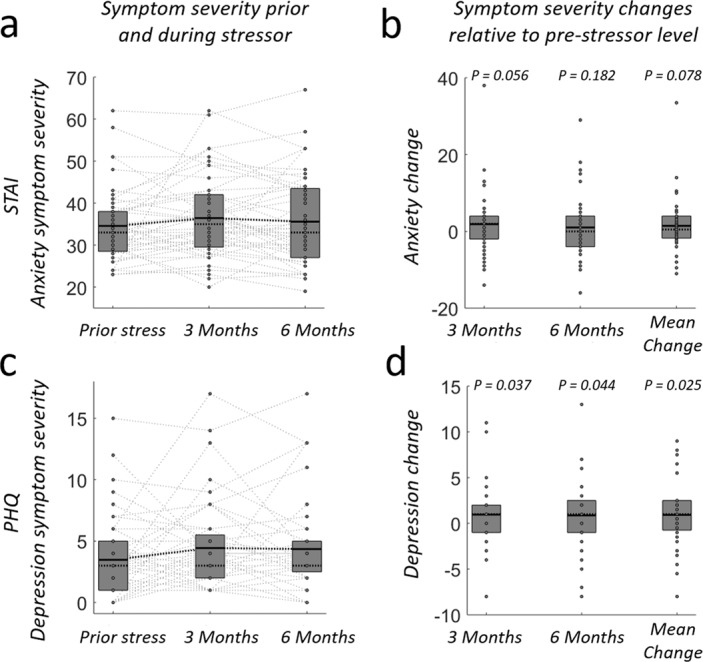
Fig. 2 Symptom severity scores and severity changes across time. a Anxiety symptom severity prior to and after 3 and 6 months of medical internship. b Anxiety symptom severity changes relative to initial anxiety baseline level prior to the internship (time of imaging experiment). One-sample t test, one-sided. c Depression-symptom severity prior and after 3 and 6 months of medical internship. d Depression-symptom severity changes relative to initial depression baseline level prior to the internship. Each dot (and their connections) represents data (and changes) for a single subject (N = 48). Top and bottom of boxes indicate 75th and 25th percentile of the underlying distribution respectively. Horizontal lines within boxes indicate the mean (black) and median (dotted). One-sample t test, one-sided. Source data are provided as a Source Data file.
Fig. 2 Symptom severity scores and severity changes across time. a Anxiety symptom severity prior to and after 3 and 6 months of medical internship. b Anxiety symptom severity changes relative to initial anxiety baseline level prior to the internship (time of imaging experiment). One-sample t test, one-sided. c Depression-symptom severity prior and after 3 and 6 months of medical internship. d Depression-symptom severity changes relative to initial depression baseline level prior to the internship. Each dot (and their connections) represents data (and changes) for a single subject (N = 48). Top and bottom of boxes indicate 75th and 25th percentile of the underlying distribution respectively. Horizontal lines within boxes indicate the mean (black) and median (dotted). One-sample t test, one-sided. Source data are provided as a Source Data file.CC BY · PubMed Central
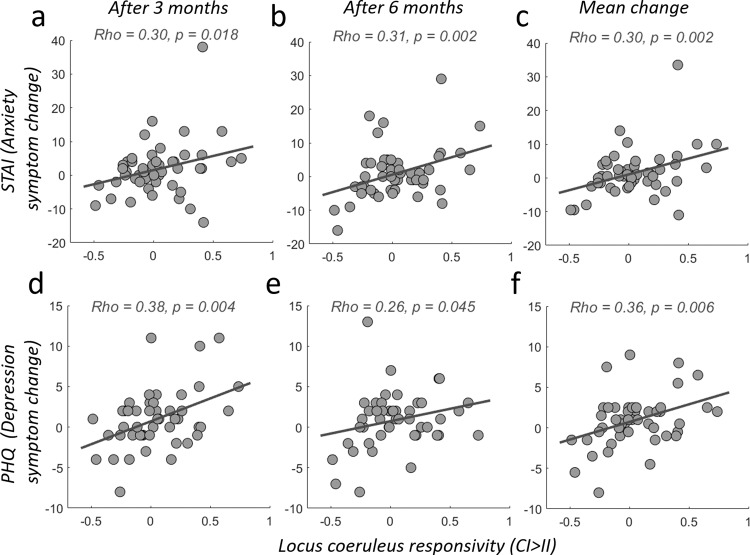
Fig. 3 LC-NE responsivity (CI > II) relates to increases in anxiety and depression due to prolonged real-world stress exposure. Each panel visualizes the correlation (robust linear regressions) between participants’ symptom severity and individual CI > II responses, extracted from physiological-noise-corrected, unsmoothed data with weighted averaging across voxels in the LC-1SD-mask. Please note that the symptom severity used for these correlations is defined as the change from the individual symptoms baseline level at measurement time t0. a–c Correlation between LC responsivity (CI > II) and severity of anxiety symptom changes (STAI) (top) measured after 3 months (a) and 6 months (b) of exposure to real-world chronic stress as well as the mean change between both measurement time points (c). d–f Same as (a–c), but for severity of depression symptoms change (PHQ). Source data are provided as a Source Data file.
Fig. 3 LC-NE responsivity (CI > II) relates to increases in anxiety and depression due to prolonged real-world stress exposure. Each panel visualizes the correlation (robust linear regressions) between participants’ symptom severity and individual CI > II responses, extracted from physiological-noise-corrected, unsmoothed data with weighted averaging across voxels in the LC-1SD-mask. Please note that the symptom severity used for these correlations is defined as the change from the individual symptoms baseline level at measurement time t0. a–c Correlation between LC responsivity (CI > II) and severity of anxiety symptom changes (STAI) (top) measured after 3 months (a) and 6 months (b) of exposure to real-world chronic stress as well as the mean change between both measurement time points (c). d–f Same as (a–c), but for severity of depression symptoms change (PHQ). Source data are provided as a Source Data file.CC BY · PubMed Central
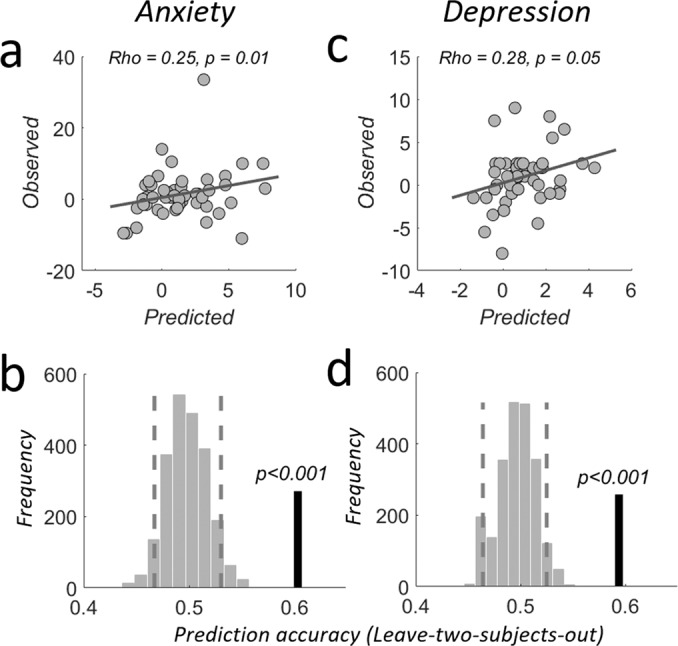
Fig. 4 Out-of-sample prediction of mean symptom severity changes. a Correlation between out-of-sample predicted and observed mean anxiety symptom severity changes due to emergency room internship stress. Robust linear regressions. b LC-NE upregulation responses predict significantly above chance which of two subjects left out of the estimation will show stronger mean anxiety increases as a consequence of stress. Prediction analyses were based on a leave-two-subjects-out cross-validation procedure; their significance was tested using a permutation test with 1000 permutations for each possible left-out pair combination. Dashed lines indicate the 5th and 95th percentile of the randomized labels distribution, respectively. Thick black vertical line indicates the obtained prediction accuracy. (c, d) as in (a, b) but for depression symptom changes. Please see “Methods” section for details. Source data are provided as a Source Data file.
Fig. 4 Out-of-sample prediction of mean symptom severity changes. a Correlation between out-of-sample predicted and observed mean anxiety symptom severity changes due to emergency room internship stress. Robust linear regressions. b LC-NE upregulation responses predict significantly above chance which of two subjects left out of the estimation will show stronger mean anxiety increases as a consequence of stress. Prediction analyses were based on a leave-two-subjects-out cross-validation procedure; their significance was tested using a permutation test with 1000 permutations for each possible left-out pair combination. Dashed lines indicate the 5th and 95th percentile of the randomized labels distribution, respectively. Thick black vertical line indicates the obtained prediction accuracy. (c, d) as in (a, b) but for depression symptom changes. Please see “Methods” section for details. Source data are provided as a Source Data file.CC BY · PubMed Central
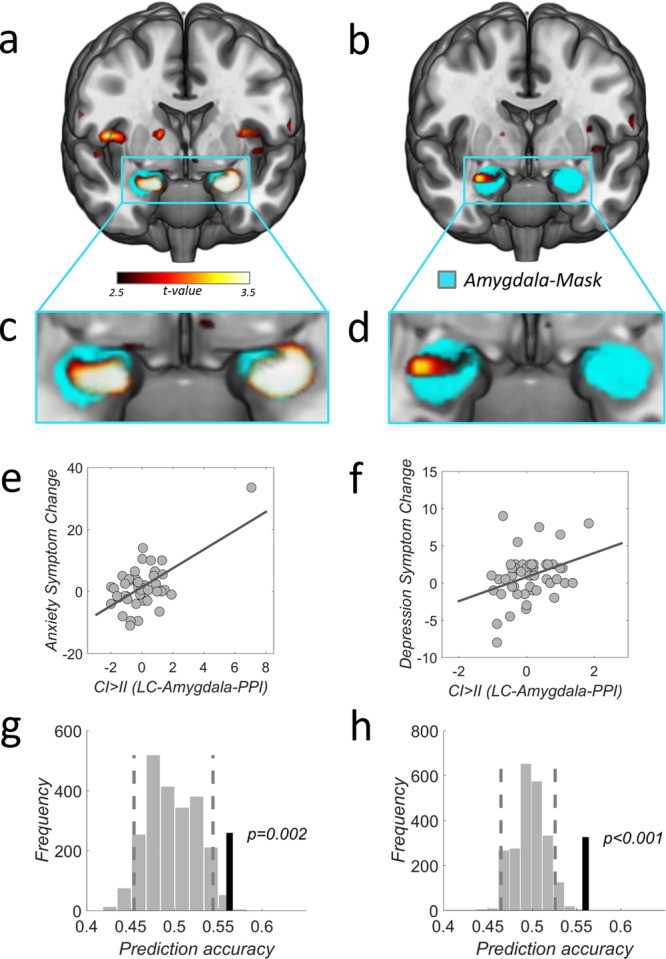
Fig. 5 Functional coupling between LC-NE and amygdala during upregulation response relates to symptom changes. Functional coupling between LC-NE and amygdala during the conflict response relates to individual changes in symptom severity for mean anxiety (a, c) and depression (b, d). e LC-NE-amygdala functional coupling (PPI: CI > II contrast betas extracted within bilateral amygdala mask using LOSO, see “Methods”) relates to mean anxiety-symptom changes (R = 0.62, simple-regression: p < 0.001, robust regression, p = 0.052) and (f) mean depression-symptom changes (R = 0.34, simple-regression: p = 0.019, robust regression, p = 0.020). Mean symptom changes were defined as the mean between changes after 3 and 6 months. g LC-NE-amygdala functional coupling during upregulation response (extracted with LOSO) predicts mean anxiety symptom severity change above chance (p = 0.002, prediction accuracy 56.3%). h Similarly, for depression (p < 0.001, prediction accuracy 56.0%). Prediction analyses were based on a leave-two-subject-out cross-validation procedure; their significance was tested using a permutation test with 1000 permutations for each possible left out pair combination. Source data are provided as a Source Data file.
Fig. 5 Functional coupling between LC-NE and amygdala during upregulation response relates to symptom changes. Functional coupling between LC-NE and amygdala during the conflict response relates to individual changes in symptom severity for mean anxiety (a, c) and depression (b, d). e LC-NE-amygdala functional coupling (PPI: CI > II contrast betas extracted within bilateral amygdala mask using LOSO, see “Methods”) relates to mean anxiety-symptom changes (R = 0.62, simple-regression: p < 0.001, robust regression, p = 0.052) and (f) mean depression-symptom changes (R = 0.34, simple-regression: p = 0.019, robust regression, p = 0.020). Mean symptom changes were defined as the mean between changes after 3 and 6 months. g LC-NE-amygdala functional coupling during upregulation response (extracted with LOSO) predicts mean anxiety symptom severity change above chance (p = 0.002, prediction accuracy 56.3%). h Similarly, for depression (p < 0.001, prediction accuracy 56.0%). Prediction analyses were based on a leave-two-subject-out cross-validation procedure; their significance was tested using a permutation test with 1000 permutations for each possible left out pair combination. Source data are provided as a Source Data file.CC BY · PubMed Central
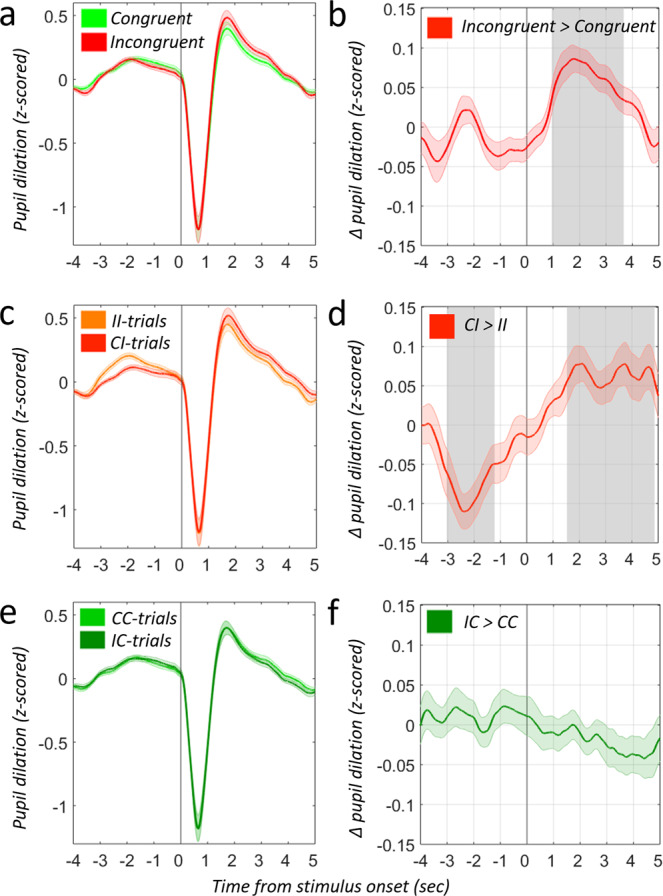
Fig. 6 Pupil dilation during response conflict (I > C) and upregulation (CI > II). a Mean Pupil dilation during congruent (green) and incongruent trials (red). b Pupil dilation during incongruent trials is significantly larger as compared to congruent trials. Gray shades area indicates sign. difference p < 0.05 (One-sample t test, two-sided, cluster-corrected). Vertical line indicates stimulus onset. c Mean Pupil dilation during CI trials (incongruent trials preceded by congruent trials = dark red) and II trials (incongruent trials preceded by incongruent trials = light orange). d II trials yield significantly enhanced pre-trial pupil dilation as compared to CI trials, indicating the need for noradrenergic upregulation on current CI trials. The gray shaded area indicates significant difference from zero at p < 0.05, (One-sample t test, two-sided, cluster-corrected). Vertical line indicates stimulus onset. e Mean Pupil dilation during CC trials (congruent trials preceded by congruent trials = light green) and IC trials (congruent trials preceded by incongruent trials = dark green). f Pupil dilation for CC trials does not significantly differ from IC trials before or during the current congruent trial, precluding potential light reflex differences (see main text). Error bands represent ±SEM at each timepoint. Source data are provided as a Source Data file.
Fig. 6 Pupil dilation during response conflict (I > C) and upregulation (CI > II). a Mean Pupil dilation during congruent (green) and incongruent trials (red). b Pupil dilation during incongruent trials is significantly larger as compared to congruent trials. Gray shades area indicates sign. difference p < 0.05 (One-sample t test, two-sided, cluster-corrected). Vertical line indicates stimulus onset. c Mean Pupil dilation during CI trials (incongruent trials preceded by congruent trials = dark red) and II trials (incongruent trials preceded by incongruent trials = light orange). d II trials yield significantly enhanced pre-trial pupil dilation as compared to CI trials, indicating the need for noradrenergic upregulation on current CI trials. The gray shaded area indicates significant difference from zero at p < 0.05, (One-sample t test, two-sided, cluster-corrected). Vertical line indicates stimulus onset. e Mean Pupil dilation during CC trials (congruent trials preceded by congruent trials = light green) and IC trials (congruent trials preceded by incongruent trials = dark green). f Pupil dilation for CC trials does not significantly differ from IC trials before or during the current congruent trial, precluding potential light reflex differences (see main text). Error bands represent ±SEM at each timepoint. Source data are provided as a Source Data file.CC BY · PubMed Central
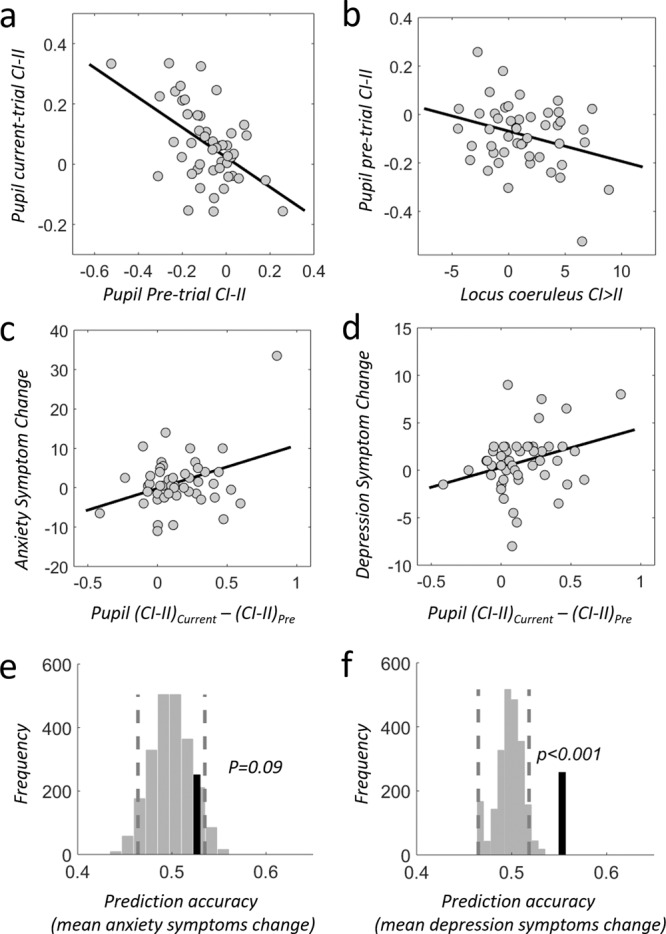
Fig. 7 Conflict-related pupil response relates to LC responsivity and stress resilience. a Evidence for carry-over effects of LC-NE responses as measured by pupil dilation: The stronger the pupil dilation before incongruent trials, the lower the pupil dilation elicited by this incongruent trial (R = −0.52, p = 0.00014); this effect is specific to incongruent trials. b The degree of pre-trial pupil-dilation difference (CI > II) correlates with LC-NE upregulation responses (CI-II), consistent with a noradrenergic mechanism that drives upregulation of resources to meet current trial conflict demands (R = −0.30, p = 0.038). c, d The larger the individual impact on pupil dilation from previous to current incongruent trials (pupil dilation distance between current CI-II and previous trial CI-II), the more increases are observed for (c) anxiety (R = 0.36, p = 0.013) and (d) depression (R = 0.30, p = 0.04) symptoms (for simplicity we averaged symptom changes between 3 and 6 months). a–d Pearson correlation. e, f The pupil dilation distance between current CI-II and previous trial CI-II predicts mean symptom changes due to real-world stress reliably out-of-sample for depression (f, p < 0.001), but only marginally for anxiety (e, p = 0.09). Prediction analyses were based on a leave-two-subject-out cross-validation procedure; their significance was tested using a permutation test with 1000 permutations for each possible left out pair combination. Source data are provided as a Source Data file.
Fig. 7 Conflict-related pupil response relates to LC responsivity and stress resilience. a Evidence for carry-over effects of LC-NE responses as measured by pupil dilation: The stronger the pupil dilation before incongruent trials, the lower the pupil dilation elicited by this incongruent trial (R = −0.52, p = 0.00014); this effect is specific to incongruent trials. b The degree of pre-trial pupil-dilation difference (CI > II) correlates with LC-NE upregulation responses (CI-II), consistent with a noradrenergic mechanism that drives upregulation of resources to meet current trial conflict demands (R = −0.30, p = 0.038). c, d The larger the individual impact on pupil dilation from previous to current incongruent trials (pupil dilation distance between current CI-II and previous trial CI-II), the more increases are observed for (c) anxiety (R = 0.36, p = 0.013) and (d) depression (R = 0.30, p = 0.04) symptoms (for simplicity we averaged symptom changes between 3 and 6 months). a–d Pearson correlation. e, f The pupil dilation distance between current CI-II and previous trial CI-II predicts mean symptom changes due to real-world stress reliably out-of-sample for depression (f, p < 0.001), but only marginally for anxiety (e, p = 0.09). Prediction analyses were based on a leave-two-subject-out cross-validation procedure; their significance was tested using a permutation test with 1000 permutations for each possible left out pair combination. Source data are provided as a Source Data file.CC BY · PubMed Central
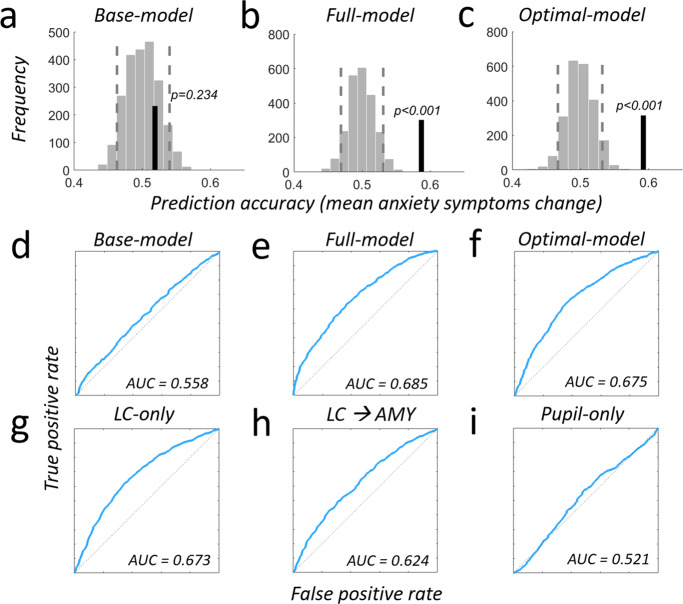
Fig. 8 Comprehensive model comparison for predicting anxiety symptom change. a–c Prediction analyses were based on a leave-two-subject-out cross-validation procedure and their significance was tested using a permutation test with 1000 permutations for each possible left-out pair combination. Light gray bars show the distribution of prediction accuracies that can be expected by chance (shuffled labels, see methods sections for details). Dashed vertical lines represent the 5th and 95th percentile of this distribution. Vertical black line indicates the obtained out-of sample accuracy. a A base-model containing scores from anxiety and pretrauma surveys does not predict the individual mean changes in anxiety symptom severity due to real-world stress above chance (out-of-sample accuracy = 51.86%, p = 0.234, R2 = 0.08, adjusted R2 = 0.037). b Using a full model that additionally contains behavioral-, neural- and pupil data predicts mean anxiety increases significantly above chance (out-of-sample accuracy = 58.7%, p < 0.001, R2 = 0.57, adjusted R2 = 0.50). Compared to the base-model, the full model increases the explained variance by 49% and the adjusted explained variance by 47%. Locus coeruleus contribution is significant (p = 0.038). c The optimal model, established using a stepwise-regression procedure (Methods), shows similar prediction improvements (out-of-sample accuracy = 59.2%, p < 0.001, R2 = 0.56, adjusted R2 = 0.52) but comprises only four parameters: locus coeruleus upregulation response (p = 0.025), behavioral congruency-sequence effect (CSE, p = 0.031), pupil (p = 0.05) and LC-NE-Amygdala coupling during the upregulation response (p < 0.001). Compared to the base-model, this sparse model predicts 49% more of the variance and also 48% more of the adjusted variance. d–i Receiver operating characteristic (ROC) plots and area under the curve (AUC) for different combinations of measures predicting anxiety: (d) Base-model, (e) Full-model, (f) Optimal model, (g) LC-only, (h) LC-Amygdala only, (i) pupil only. Please see Supplemental Table S7 for additional models, full details on single regressor contributions and model comparison. Source data are provided as a Source Data file.
Fig. 8 Comprehensive model comparison for predicting anxiety symptom change. a–c Prediction analyses were based on a leave-two-subject-out cross-validation procedure and their significance was tested using a permutation test with 1000 permutations for each possible left-out pair combination. Light gray bars show the distribution of prediction accuracies that can be expected by chance (shuffled labels, see methods sections for details). Dashed vertical lines represent the 5th and 95th percentile of this distribution. Vertical black line indicates the obtained out-of sample accuracy. a A base-model containing scores from anxiety and pretrauma surveys does not predict the individual mean changes in anxiety symptom severity due to real-world stress above chance (out-of-sample accuracy = 51.86%, p = 0.234, R2 = 0.08, adjusted R2 = 0.037). b Using a full model that additionally contains behavioral-, neural- and pupil data predicts mean anxiety increases significantly above chance (out-of-sample accuracy = 58.7%, p < 0.001, R2 = 0.57, adjusted R2 = 0.50). Compared to the base-model, the full model increases the explained variance by 49% and the adjusted explained variance by 47%. Locus coeruleus contribution is significant (p = 0.038). c The optimal model, established using a stepwise-regression procedure (Methods), shows similar prediction improvements (out-of-sample accuracy = 59.2%, p < 0.001, R2 = 0.56, adjusted R2 = 0.52) but comprises only four parameters: locus coeruleus upregulation response (p = 0.025), behavioral congruency-sequence effect (CSE, p = 0.031), pupil (p = 0.05) and LC-NE-Amygdala coupling during the upregulation response (p < 0.001). Compared to the base-model, this sparse model predicts 49% more of the variance and also 48% more of the adjusted variance. d–i Receiver operating characteristic (ROC) plots and area under the curve (AUC) for different combinations of measures predicting anxiety: (d) Base-model, (e) Full-model, (f) Optimal model, (g) LC-only, (h) LC-Amygdala only, (i) pupil only. Please see Supplemental Table S7 for additional models, full details on single regressor contributions and model comparison. Source data are provided as a Source Data file.CC BY · PubMed Central
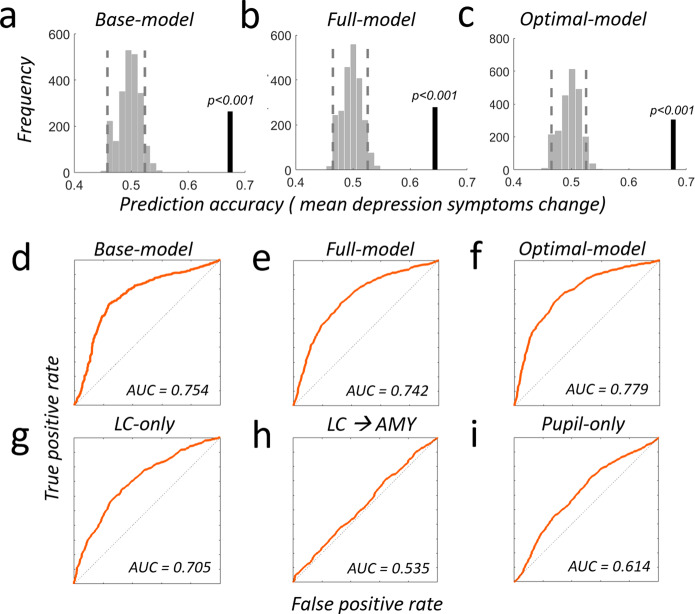
Fig. 9 Comprehensive model comparison for predicting depression-symptom change. a–c Prediction analyses were based on a leave-two-subject-out cross-validation procedure and their significance was tested using a permutation test with 1,000 permutations for each possible left-out pair combination. a The base-model predicts mean depression symptom increases significantly above chance (out-of-sample accuracy = 67.38%, p < 0.001, R2 = 0.27 adjusted R2 = 0.23). The PHQ-survey score is already a significant predictor for depression symptom severity changes (p = 0.0002). b The full model containing additional behavioral-, neural- and pupil data predicts mean depression increases significantly above chance (out-of-sample accuracy = 64.36%, p < 0.001, R2 = 0.37, adjusted R2 = 0.28) and increases the explained variance by 11% and the adjusted explained variance by 4.3%. c The optimal model has similar prediction improvements as the full model (out-of-sample accuracy = 67.7%, p < 0.001, R2 = 0.33, adjusted R2 = 0.30) but contains only two parameters: locus coeruleus upregulation response (p = 0.039) and the PHQ-depression survey (p = 0.0009). Compared to the base-model, this sparse model predicts 10% more of the variance and also 10% of the adjusted variance. d–i Receiver operating characteristic (ROC) plots and area under the curve (AUC) for different combinations of measures predicting depression: (d) Base-model, (e) Full-model, (f) Optimal model, (g) LC-only, (h) LC-Amygdala only, (i) pupil only. Please see Supplemental Table S8 for additional models, full details on single regressor contributions and model comparison. Source data are provided as a Source Data file.
Fig. 9 Comprehensive model comparison for predicting depression-symptom change. a–c Prediction analyses were based on a leave-two-subject-out cross-validation procedure and their significance was tested using a permutation test with 1,000 permutations for each possible left-out pair combination. a The base-model predicts mean depression symptom increases significantly above chance (out-of-sample accuracy = 67.38%, p < 0.001, R2 = 0.27 adjusted R2 = 0.23). The PHQ-survey score is already a significant predictor for depression symptom severity changes (p = 0.0002). b The full model containing additional behavioral-, neural- and pupil data predicts mean depression increases significantly above chance (out-of-sample accuracy = 64.36%, p < 0.001, R2 = 0.37, adjusted R2 = 0.28) and increases the explained variance by 11% and the adjusted explained variance by 4.3%. c The optimal model has similar prediction improvements as the full model (out-of-sample accuracy = 67.7%, p < 0.001, R2 = 0.33, adjusted R2 = 0.30) but contains only two parameters: locus coeruleus upregulation response (p = 0.039) and the PHQ-depression survey (p = 0.0009). Compared to the base-model, this sparse model predicts 10% more of the variance and also 10% of the adjusted variance. d–i Receiver operating characteristic (ROC) plots and area under the curve (AUC) for different combinations of measures predicting depression: (d) Base-model, (e) Full-model, (f) Optimal model, (g) LC-only, (h) LC-Amygdala only, (i) pupil only. Please see Supplemental Table S8 for additional models, full details on single regressor contributions and model comparison. Source data are provided as a Source Data file.CC BY · PubMed Central

Verification

Claims the paper makes

The claims and statistics of this paper haven’t been checked yet.

Run the check — free, no account needed. It reads the open-access text and checks the sources it cites.

A few free checks a day · papers already verified open instantly · results are public

Claims other papers make about this one

Each is checked against this paper’s own text: does it say what the citing paper says it does?

Self-check

Percentages, sums and reported differences re-computed from the paper’s own numbers.

The self-check needs the paper’s full text.

Citations

Cites

Show all 147 references

Research works printed but not linked: 7

  1. Laeng, B., Orbo, M., Holmlund, T. & Miozzo, M. Pupillary Stroop effects. Cogn. Process 12, 13–21 (2011). · DOI
  2. van Steenbergen, H. & Band, G. P. Pupil dilation in the Simon task as a marker of conflict processing. Front. Hum. Neurosci. 7, 215 (2013). · DOI
  3. van der Wel, P. & van Steenbergen, H. Pupil dilation as an index of effort in cognitive control tasks: a review. Psychon. Bull. Rev. 25, 2005–2015 (2018). · DOI
  4. Loewenfeld, I. The Pupil: Anatomy, Physiology, and Clinical Applications (Iowa State University Press, 1991).
  5. Beatty, J. & Lucero-Wagoner, B. in Handbook of Psychophysiology (ed Tassinary, L.G., Cacioppo, J.T. Berntson, G.) 142–162 (Cambridge University Press, 2000).
  6. Buddeberg-Fischer, B., Klaghofer, F. C. & Buddeberg, C. Stress at work and well-being in junior residents. Z. Psychosomatische Med. Psychotherapie 51, 163–178 (2005).
  7. Buddeberg-Fischer, B., Stamm, M., Buddeberg, C. & Klaghofer, R. Anxiety and depression in residents—Results of a Swiss longitudinal study. Z. Psychosomatishce Med. Psychotherapie 55, 37–50 (2009).

Cited by

Sorted by citations

Items 101–116 of 116

Metadata

Authors
Grueschow, M., Stenz, N., Thörn, H., Ehlert, U., Breckwoldt, J., Brodmann Maeder, M., Exadaktylos, A. K., Bingisser, R., Ruff, C. C., & Kleim, B.
Affiliations
  • University of Zurich (CH)
  • University Hospital of Bern (CH)
  • University Hospital of Basel (CH)
Corresponding author
  • Grueschow, Marcus
  • Kleim, Birgit
Venue
Nature Communications
Published
2021-04-15
Volume
12
Issue
1
Pages
2275-2275
ISSN
2041-1723 (ISSN-L)
OpenAlex
W3155821888
Cited by
116
References
147
Citations by year
2026: 18 · 2025: 31 · 2024: 18 · 2023: 18 · 2022: 20 · 2021: 11
FWCI
10.72
Type
journal article
Language
en
Open access
Locations
  • Nature Communications (publishedVersion, cc-by)
  • PubMed Central (publishedVersion, cc-by)
  • PubMed (publishedVersion)
  • Zurich Open Repository and Archive (University of Zurich) (acceptedVersion, cc-by)
  • RePEc: Research Papers in Economics (submittedVersion)
  • Bern Open Repository and Information System (University of Bern) (submittedVersion, cc-by)
  • DOAJ (DOAJ: Directory of Open Access Journals) (submittedVersion, cc-by-sa)
  • Zurich Open Repository and Archive (University of Zurich) (submittedVersion, cc-by)
  • Zurich Open Repository and Archive (University of Zurich)
Funders
  • Richard-Büchner-Foundation
  • Schweizerischer Nationalfonds zur Förderung der Wissenschaftlichen Forschung (PZ00P1_126597, PZ00P1_150812)
Topics
  • Life Sciences › Neuroscience › Behavioral Neuroscience › Stress Responses and Cortisol
  • Life Sciences › Neuroscience › Cellular and Molecular Neuroscience › Neurotransmitter Receptor Influence on Behavior
  • Life Sciences › Neuroscience › Cognitive Neuroscience › Neural and Behavioral Psychology Studies
Keywords
stress resilience, locus coeruleus, noradrenergic system, pupil dilation, amygdala, emotional conflict, anxiety, depression, medical residents, functional connectivity
MeSH terms
Occupational Stress, Adult, Amygdala, Anxiety, Depression, Emergency Service, Hospital, Female, Humans, Internship and Residency, Locus Coeruleus, Magnetic Resonance Imaging, Male, Predictive Value of Tests, Risk Factors, Students, Medical, Resilience, Psychological, Young Adult, Connectome

About these checks

Registry, retraction, Cites and statistics results are computed, not judged, with one exception: a printed reference that no index lists is read once by a model before it counts as a citation error. Claims are extracted by a model and kept only when their quote appears verbatim in the text; each cited source is then checked, with a model’s help, for whether it says what the claim relies on. Those verdicts can be wrong — read the claim’s quote and the cited source before relying on one.

Statistics and arithmetic are recomputed, not judged.

Confidence bands are shown only for fields calibrated on our annotated test set. None is calibrated yet, so no band is shown.

What counts as a claim ›How we measure confidence ›How we check this ›

Are you an author, or do you see a problem with this page? Request a review