Cited by 105Functional Brain Connectivity StudiesNeural dynamics and brain functionNeural and Behavioral Psychology Studies

The DOI matches its Crossref record; 113 of the 115 references it cites were found in a registry or an index.

Dynamic causal brain circuits during working memory and their functional controllability

Open access

Abstract

Control processes associated with working memory play a central role in human cognition, but their underlying dynamic brain circuit mechanisms are poorly understood. Here we use system identification, network science, stability analysis, and control theory to probe functional circuit dynamics during working memory task performance. Our results show that dynamic signaling between distributed brain areas encompassing the salience (SN), fronto-parietal (FPN), and default mode networks can distinguish between working memory load and predict performance. Network analysis of directed causal influences suggests the anterior insula node of the SN and dorsolateral prefrontal cortex node of the FPN are causal outflow and inflow hubs, respectively. Network controllability decreases with working memory load and SN nodes show the highest functional controllability. Our findings reveal dissociable roles of the SN and FPN in systems control and provide novel insights into dynamic circuit mechanisms by which cognitive control circuits operate asymmetrically during cognition.

Overview

The claims and statistics of this paper haven’t been checked yet.

Run the check — free, no account needed. It reads the open-access text and checks the sources it cites.

A few free checks a day · papers already verified open instantly · results are public

Integrity signals

Registry

Crossref · 10.1038/s41467-021-23509-x

Cites

113 of 114 references verified1 citation errors · 0 not checkable

Statistics

Figures

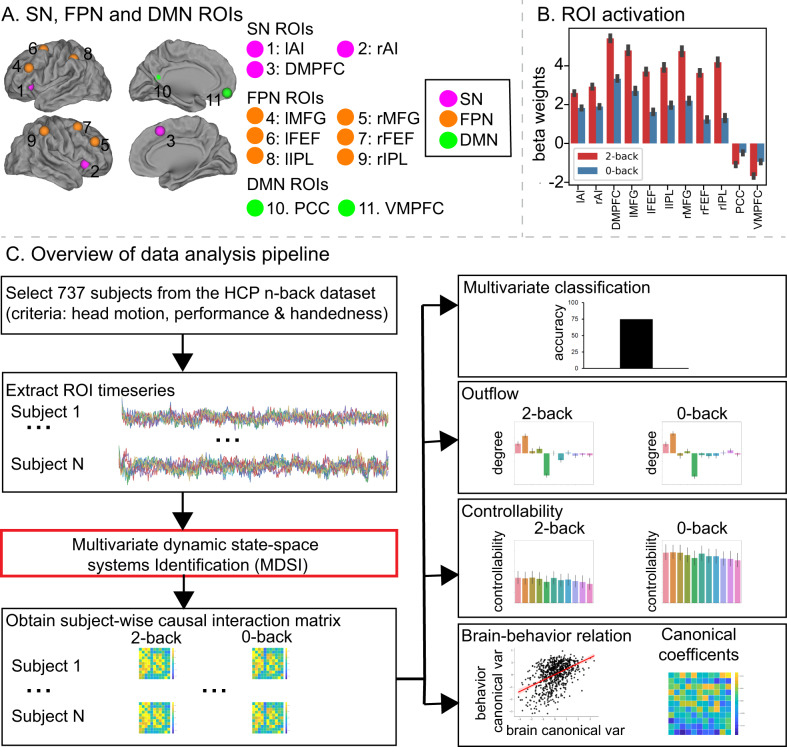
Fig. 1 Schematic illustration of data analysis strategy and procedures. A Salience Network (SN), Frontal-Parietal Network (FPN), and Default Mode network (DMN) ROIs: (1) left anterior insula (lAI); (2) right anterior insula (rAI); (3) dorsomedial prefrontal cortex (DMPFC); (4) left middle frontal gyrus (lMFG); (5) right middle frontal gyrus (rMFG); (6) left frontal eye field (lFEF); (7) right frontal eye field (rFEF); (8) left intraparietal lobule (lIPL); (9) right intraparietal lobule (rIPL); (10) posterior cingulate cortex (PCC), and (11) ventromedial prefrontal cortex (VMPFC). B General linear model analysis revealed significant working-memory-load-related activation in SN and FPN (task-positive nodes), and deactivation in the DMN (task-negative nodes) (p < 0.01, FDR-corrected, two-sided t-test). N = 737 participants. Data are presented as mean ± SEM. C Overview of data analysis pipeline. We first screened the HCP n-back working-memory dataset based on head motion, behavioral performance, and participant handedness. We then extracted time series from each of the 11 ROIs and applied MDSI to determine working-memory load-specific dynamic causal interactions from each participant in the 2-back and 0-back task conditions. MDSI-derived causal influences were then used to investigate (1) whether multivariate dynamic causal interaction patterns distinguished 2-back versus 0-back task conditions, (2) task-dependent causal outflow from each ROI, (3) network controllability as a function of working-memory load, and (4) the relationship between the strength of dynamic causal interactions and behavioral performance. HCP human connectome project, MDSI multivariate dynamic state-space systems identification, ROI region of interest. Source data are provided as a Source data file.
Fig. 1 Schematic illustration of data analysis strategy and procedures. A Salience Network (SN), Frontal-Parietal Network (FPN), and Default Mode network (DMN) ROIs: (1) left anterior insula (lAI); (2) right anterior insula (rAI); (3) dorsomedial prefrontal cortex (DMPFC); (4) left middle frontal gyrus (lMFG); (5) right middle frontal gyrus (rMFG); (6) left frontal eye field (lFEF); (7) right frontal eye field (rFEF); (8) left intraparietal lobule (lIPL); (9) right intraparietal lobule (rIPL); (10) posterior cingulate cortex (PCC), and (11) ventromedial prefrontal cortex (VMPFC). B General linear model analysis revealed significant working-memory-load-related activation in SN and FPN (task-positive nodes), and deactivation in the DMN (task-negative nodes) (p < 0.01, FDR-corrected, two-sided t-test). N = 737 participants. Data are presented as mean ± SEM. C Overview of data analysis pipeline. We first screened the HCP n-back working-memory dataset based on head motion, behavioral performance, and participant handedness. We then extracted time series from each of the 11 ROIs and applied MDSI to determine working-memory load-specific dynamic causal interactions from each participant in the 2-back and 0-back task conditions. MDSI-derived causal influences were then used to investigate (1) whether multivariate dynamic causal interaction patterns distinguished 2-back versus 0-back task conditions, (2) task-dependent causal outflow from each ROI, (3) network controllability as a function of working-memory load, and (4) the relationship between the strength of dynamic causal interactions and behavioral performance. HCP human connectome project, MDSI multivariate dynamic state-space systems identification, ROI region of interest. Source data are provided as a Source data file.CC BY · PubMed Central
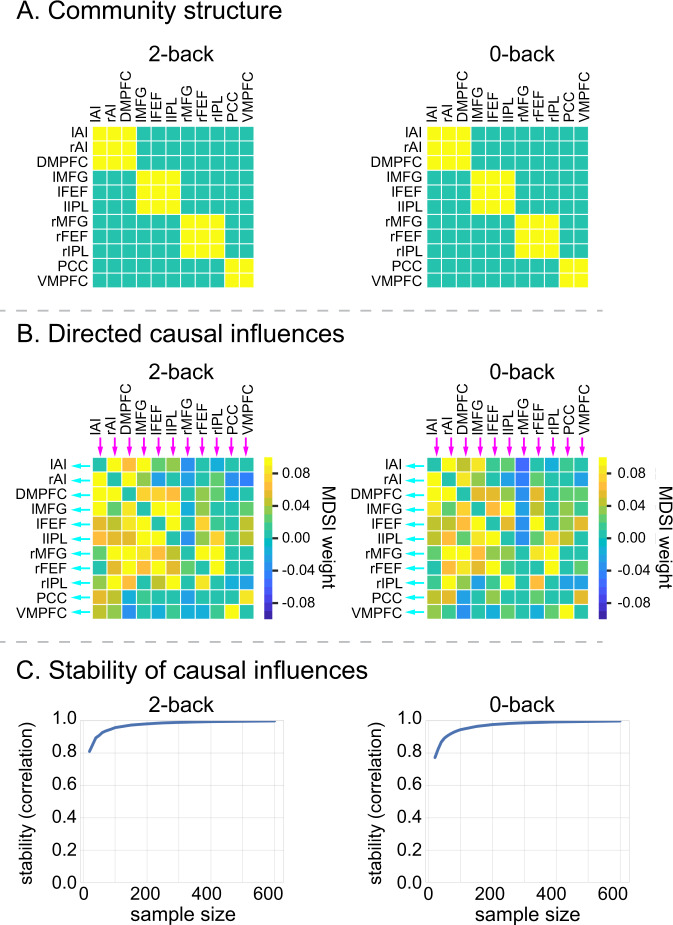
Fig. 2 Working-memory load-specific dynamic causal influences. A MDSI and graph-theoretic analyses identified four communities associated with directed causal influences in both the 2-back and 0-back working-memory task conditions: (i) SN consisting of lAI, rAI, and DMPFC nodes, (ii) left FPN consisting of lMFG, lFEF, and lIPL nodes, (iii) right FPN consisting of rMFG, rFEF and rIPL nodes, and (iv) DMN consisting of PCC and VMPFC nodes (p < 0.01, FDR-corrected, two-sided t-test). N = 737 participants. Yellow cells indicate that a pair of ROIs are grouped into the same community and cyan cells indicate that a pair of ROIs belong to different communities. B Significant directed causal influences between SN, FPN, and DMN ROIs in the 2-back and 0-back working-memory task conditions (p < 0.01, FDR-corrected, two-sided t-test). N = 737 participants. Red cells indicate significant positive influences and blue indicates significant negative influences. C Stability analyses revealed highly stable multivariate patterns of causal influences among SN, FPN, and DMN nodes in 2-back and 0-back task conditions (r > 0.8 for sample size >25). X-axis shows sample sizes ranging from 20 to 600. Y-axis shows stability, computed as the correlation of multivariate causal influence patterns between the original sample and random subsamples drawn from N = 737 participants. lAI left anterior insula, rAI right anterior insula, DMPFC dorsomedial prefrontal cortex, lMFG left middle frontal gyrus, rMFG right middle frontal gyrus, lFEF left frontal eye field, rFEF right frontal eye field, lIPL left intraparietal lobule, rIPL right intraparietal lobule, PCC posterior cingulate cortex, VMPFC ventromedial prefrontal cortex. Source data are provided as a Source data file.
Fig. 2 Working-memory load-specific dynamic causal influences. A MDSI and graph-theoretic analyses identified four communities associated with directed causal influences in both the 2-back and 0-back working-memory task conditions: (i) SN consisting of lAI, rAI, and DMPFC nodes, (ii) left FPN consisting of lMFG, lFEF, and lIPL nodes, (iii) right FPN consisting of rMFG, rFEF and rIPL nodes, and (iv) DMN consisting of PCC and VMPFC nodes (p < 0.01, FDR-corrected, two-sided t-test). N = 737 participants. Yellow cells indicate that a pair of ROIs are grouped into the same community and cyan cells indicate that a pair of ROIs belong to different communities. B Significant directed causal influences between SN, FPN, and DMN ROIs in the 2-back and 0-back working-memory task conditions (p < 0.01, FDR-corrected, two-sided t-test). N = 737 participants. Red cells indicate significant positive influences and blue indicates significant negative influences. C Stability analyses revealed highly stable multivariate patterns of causal influences among SN, FPN, and DMN nodes in 2-back and 0-back task conditions (r > 0.8 for sample size >25). X-axis shows sample sizes ranging from 20 to 600. Y-axis shows stability, computed as the correlation of multivariate causal influence patterns between the original sample and random subsamples drawn from N = 737 participants. lAI left anterior insula, rAI right anterior insula, DMPFC dorsomedial prefrontal cortex, lMFG left middle frontal gyrus, rMFG right middle frontal gyrus, lFEF left frontal eye field, rFEF right frontal eye field, lIPL left intraparietal lobule, rIPL right intraparietal lobule, PCC posterior cingulate cortex, VMPFC ventromedial prefrontal cortex. Source data are provided as a Source data file.CC BY · PubMed Central
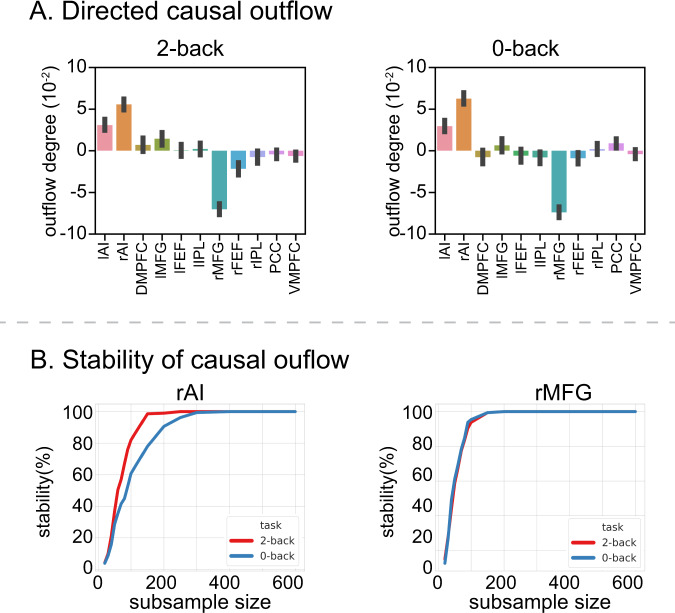
Fig. 3 Working-memory load-specific dynamic causal outflow. A AI showed the highest directed causal outflow between SN, FPN, and DMN nodes in both the 2-back and 0-back working-memory task conditions (p < 0.05, FDR-corrected, two-sided t-test). n = 737 participants. Data are presented as mean ± SEM. In contrast, the rMFG showed the highest directed causal inflow among all nodes in both task conditions (p < 0.05, FDR-corrected, two-sided t-test). n = 737 participants. Data are presented as mean ± SEM. B Stability analyses revealed highly stable directed causal outflow from the rAI and directed causal inflow into the rMFG in both the 2-back and 0-back working-memory task conditions. X-axis shows sample size, ranging from 20 to 600. Y-axis shows stability, computed as the probability that the rAI shows the highest positive directed causal outflow among SN, FPN, and DMN nodes, and the probability that the rMFG shows the highest causal inflow in random subsamples drawn from N = 737 participants. lAI left anterior insula, rAI right anterior insula, DMPFC dorsomedial prefrontal cortex, lMFG left middle frontal gyrus, rMFG right middle frontal gyrus, lFEF left frontal eye field, rFEF right frontal eye field, lIPL left intraparietal lobule, rIPL right intraparietal lobule, PCC posterior cingulate cortex, VMPFC ventromedial prefrontal cortex. Source data are provided as a Source data file.
Fig. 3 Working-memory load-specific dynamic causal outflow. A AI showed the highest directed causal outflow between SN, FPN, and DMN nodes in both the 2-back and 0-back working-memory task conditions (p < 0.05, FDR-corrected, two-sided t-test). n = 737 participants. Data are presented as mean ± SEM. In contrast, the rMFG showed the highest directed causal inflow among all nodes in both task conditions (p < 0.05, FDR-corrected, two-sided t-test). n = 737 participants. Data are presented as mean ± SEM. B Stability analyses revealed highly stable directed causal outflow from the rAI and directed causal inflow into the rMFG in both the 2-back and 0-back working-memory task conditions. X-axis shows sample size, ranging from 20 to 600. Y-axis shows stability, computed as the probability that the rAI shows the highest positive directed causal outflow among SN, FPN, and DMN nodes, and the probability that the rMFG shows the highest causal inflow in random subsamples drawn from N = 737 participants. lAI left anterior insula, rAI right anterior insula, DMPFC dorsomedial prefrontal cortex, lMFG left middle frontal gyrus, rMFG right middle frontal gyrus, lFEF left frontal eye field, rFEF right frontal eye field, lIPL left intraparietal lobule, rIPL right intraparietal lobule, PCC posterior cingulate cortex, VMPFC ventromedial prefrontal cortex. Source data are provided as a Source data file.CC BY · PubMed Central
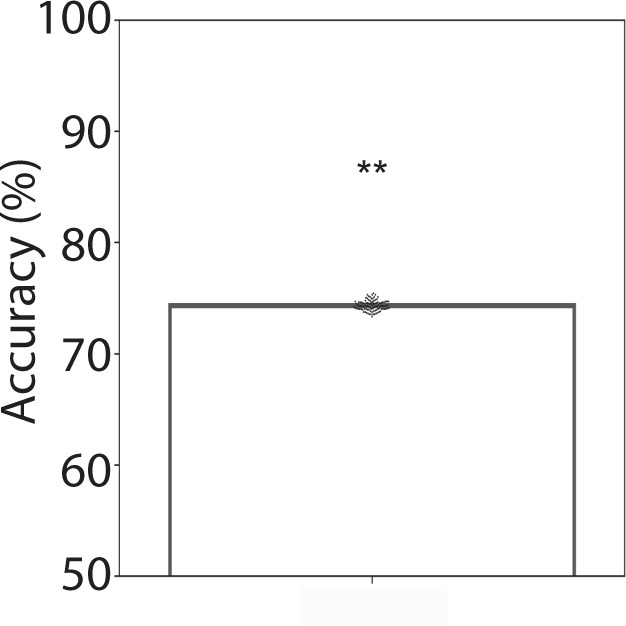
Fig. 4 Dynamic causal influences distinguish working-memory conditions. Linear SVM analyses with 10-fold cross-validation revealed that dynamic causal influences between SN, FPN, and DMN nodes distinguished the 2-back and 0-back working-memory task conditions (ps < 0.01, permutation test).
Fig. 4 Dynamic causal influences distinguish working-memory conditions. Linear SVM analyses with 10-fold cross-validation revealed that dynamic causal influences between SN, FPN, and DMN nodes distinguished the 2-back and 0-back working-memory task conditions (ps < 0.01, permutation test).CC BY · PubMed Central
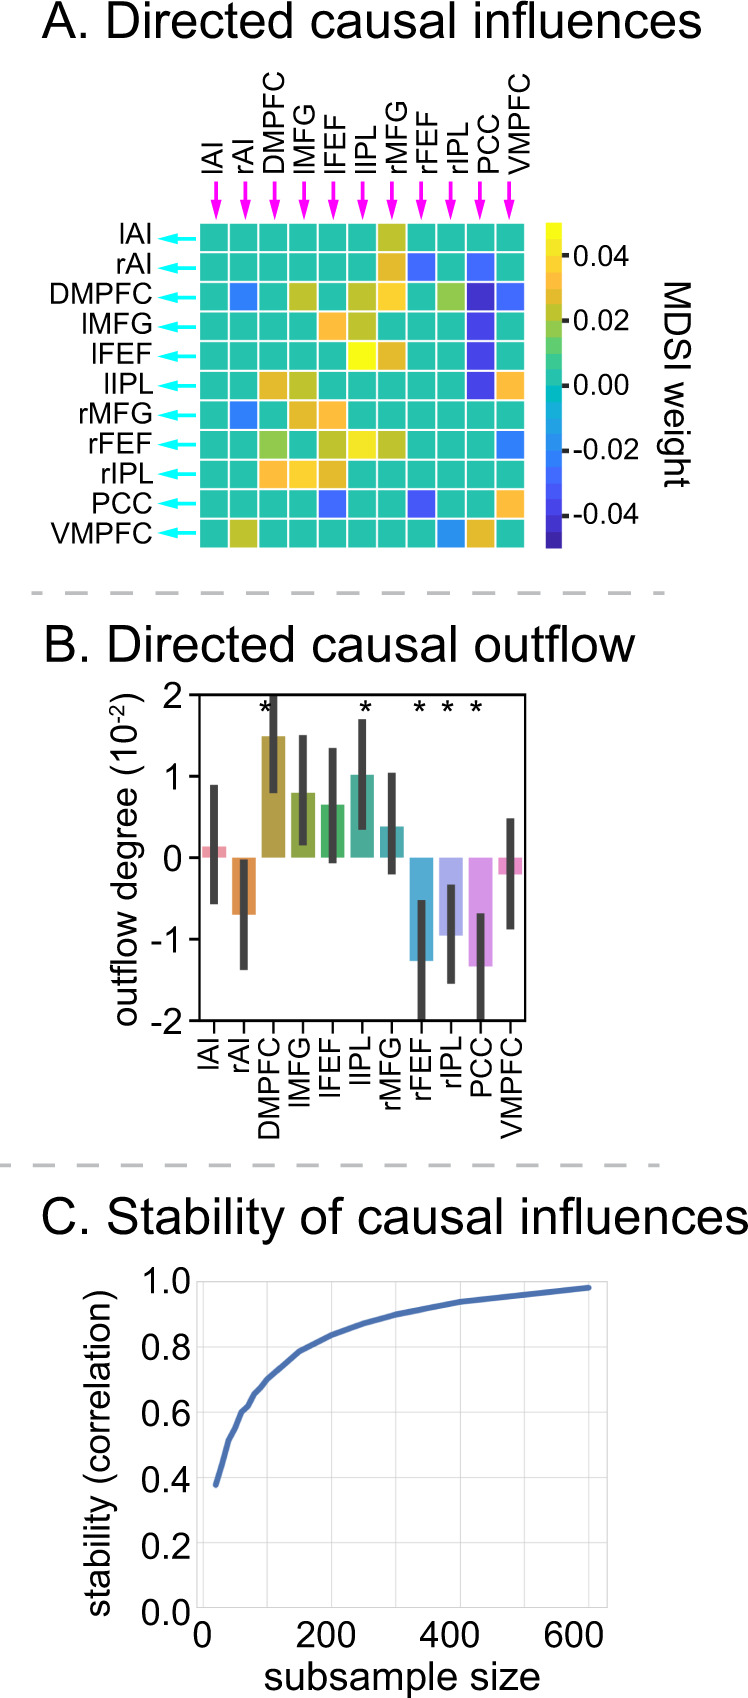
Fig. 5 Working-memory load-dependent dynamic causal influence and net outflow. A MDSI analysis revealed links with significantly greater directed causal influences between SN, FPN, and DMN nodes in the 2-back, compared to the 0-back, working-memory task condition (p < 0.05, FDR-corrected, two-sided t-test). n = 737 participants. B The DMPFC and lIPL showed significantly higher directed causal outflow in the 2-back, compared to the 0-back, task condition. In contrast, the PCC, rFEF and rIPL showed significantly higher directed causal inflow in the 2-back, compared to the 0-back, task condition (p < 0.05, FDR-corrected, two-sided t-test). n = 737 participants. Data are presented as mean ± SEM. C Stability analyses revealed highly stable multivariate patterns of causal influences between SN, FPN, and DMN nodes in 2-back versus 0-back (r > 0.8 with samples >200). X-axis is the subsample sizes, ranging from 20 to 600. Y-axis is the stability measures, which is the correlation of multivariate causal interaction patterns between subsamples and original dataset. lAI left anterior insula, rAI right anterior insula, DMPFC dorsomedial prefrontal cortex, lMFG left middle frontal gyrus, rMFG right middle frontal gyrus, lFEF left frontal eye field, rFEF right frontal eye field, lIPL left intraparietal lobule, rIPL right intraparietal lobule, PCC posterior cingulate cortex, VMPFC ventromedial prefrontal cortex. Source data are provided as a Source data file.
Fig. 5 Working-memory load-dependent dynamic causal influence and net outflow. A MDSI analysis revealed links with significantly greater directed causal influences between SN, FPN, and DMN nodes in the 2-back, compared to the 0-back, working-memory task condition (p < 0.05, FDR-corrected, two-sided t-test). n = 737 participants. B The DMPFC and lIPL showed significantly higher directed causal outflow in the 2-back, compared to the 0-back, task condition. In contrast, the PCC, rFEF and rIPL showed significantly higher directed causal inflow in the 2-back, compared to the 0-back, task condition (p < 0.05, FDR-corrected, two-sided t-test). n = 737 participants. Data are presented as mean ± SEM. C Stability analyses revealed highly stable multivariate patterns of causal influences between SN, FPN, and DMN nodes in 2-back versus 0-back (r > 0.8 with samples >200). X-axis is the subsample sizes, ranging from 20 to 600. Y-axis is the stability measures, which is the correlation of multivariate causal interaction patterns between subsamples and original dataset. lAI left anterior insula, rAI right anterior insula, DMPFC dorsomedial prefrontal cortex, lMFG left middle frontal gyrus, rMFG right middle frontal gyrus, lFEF left frontal eye field, rFEF right frontal eye field, lIPL left intraparietal lobule, rIPL right intraparietal lobule, PCC posterior cingulate cortex, VMPFC ventromedial prefrontal cortex. Source data are provided as a Source data file.CC BY · PubMed Central
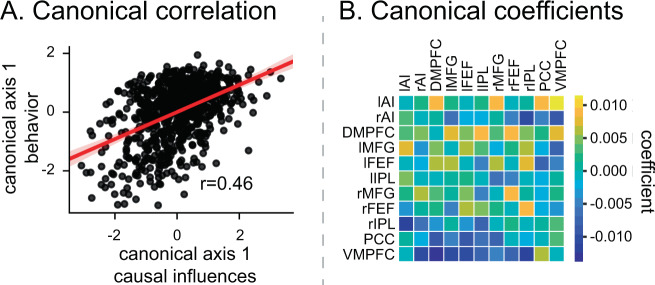
Fig. 6 Dynamic causal influence relation to behavioral performance. A Canonical correlation analysis revealed a significant relationship between directed SN, FPN, and DMN causal influences and behavioral performance in the 2-back working-memory task condition (r = 0.46, p < 0.001, Pearson’s correlation). B Correlation coefficients contributing to brain-behavior relations highlights positive influences between SN and FPN nodes and negative influences of SN and FPN nodes on PCC and VMPFC nodes of the DMN. lAI left anterior insula, rAI right anterior insula, DMPFC dorsomedial prefrontal cortex, lMFG left middle frontal gyrus, rMFG right middle frontal gyrus, lFEF left frontal eye field, rFEF right frontal eye field, lIPL left intraparietal lobule, rIPL right intraparietal lobule, PCC posterior cingulate cortex, VMPFC ventromedial prefrontal cortex. Source data are provided as a Source data file.
Fig. 6 Dynamic causal influence relation to behavioral performance. A Canonical correlation analysis revealed a significant relationship between directed SN, FPN, and DMN causal influences and behavioral performance in the 2-back working-memory task condition (r = 0.46, p < 0.001, Pearson’s correlation). B Correlation coefficients contributing to brain-behavior relations highlights positive influences between SN and FPN nodes and negative influences of SN and FPN nodes on PCC and VMPFC nodes of the DMN. lAI left anterior insula, rAI right anterior insula, DMPFC dorsomedial prefrontal cortex, lMFG left middle frontal gyrus, rMFG right middle frontal gyrus, lFEF left frontal eye field, rFEF right frontal eye field, lIPL left intraparietal lobule, rIPL right intraparietal lobule, PCC posterior cingulate cortex, VMPFC ventromedial prefrontal cortex. Source data are provided as a Source data file.CC BY · PubMed Central
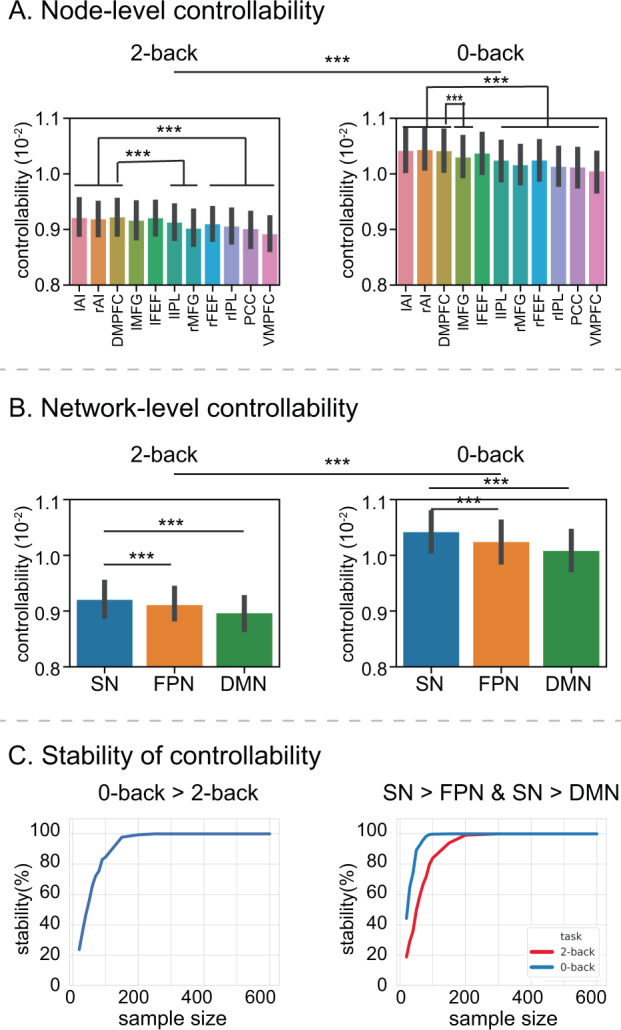
Fig. 7 Working-memory load-dependent functional controllability in SN, FPN, and DMN. A Functional network controllability, assessed in each brain node, was significantly lower in the 2-back, compared to the 0-back, working-memory task condition (p < 0.001, two-sided t-test). n = 737 participants. Data are presented as mean ± SEM. AI and DMPFC nodes in the SN have significantly higher controllability than FPN and DMN nodes, except for lFEF and lMFG nodes of the FPN in the 2-back task condition and lFEF in the 0-back task condition (p < 0.001, two-sided t-test). n = 737 participants. Data are presented as mean ± SEM. B Functional network controllability, assessed across SN, FPN, and DMN nodes, was significantly lower in the 2-back, compared to the 0-back, working-memory task condition (p < 0.001, two-sided t-test). N = 737 participants. Data are presented as mean ± SEM. The SN shows significantly higher controllability than the FPN (p = 4.61e−06, two-side paired t-test) and DMN (p = 9.84e−05, two-side paired t-test). N = 737 participants. Data are presented as mean ± SEM. C Stability analyses revealed stable load effect (0-back > 2-back) and network difference (SN > FPN and SN > DMN). X-axis shows sample size, ranging from 20 to 600. Y-axis shows stability, computed as the probability that the load effect of controllability is significantly different between 2-back and 0-back working-memory conditions, and the probability that the SN shows greater controllability than the FPN and DMN in both 2-back and 0-back working-memory conditions, in random subsamples drawn from N = 737 participants. lAI left anterior insula, rAI right anterior insula, DMPFC dorsomedial prefrontal cortex, lMFG left middle frontal gyrus, rMFG right middle frontal gyrus, lFEF left frontal eye field, rFEF right frontal eye field, lIPL left intraparietal lobule, rIPL right intraparietal lobule, PCC posterior cingulate cortex, VMPFC ventromedial prefrontal cortex. Source data are provided as a Source data file.
Fig. 7 Working-memory load-dependent functional controllability in SN, FPN, and DMN. A Functional network controllability, assessed in each brain node, was significantly lower in the 2-back, compared to the 0-back, working-memory task condition (p < 0.001, two-sided t-test). n = 737 participants. Data are presented as mean ± SEM. AI and DMPFC nodes in the SN have significantly higher controllability than FPN and DMN nodes, except for lFEF and lMFG nodes of the FPN in the 2-back task condition and lFEF in the 0-back task condition (p < 0.001, two-sided t-test). n = 737 participants. Data are presented as mean ± SEM. B Functional network controllability, assessed across SN, FPN, and DMN nodes, was significantly lower in the 2-back, compared to the 0-back, working-memory task condition (p < 0.001, two-sided t-test). N = 737 participants. Data are presented as mean ± SEM. The SN shows significantly higher controllability than the FPN (p = 4.61e−06, two-side paired t-test) and DMN (p = 9.84e−05, two-side paired t-test). N = 737 participants. Data are presented as mean ± SEM. C Stability analyses revealed stable load effect (0-back > 2-back) and network difference (SN > FPN and SN > DMN). X-axis shows sample size, ranging from 20 to 600. Y-axis shows stability, computed as the probability that the load effect of controllability is significantly different between 2-back and 0-back working-memory conditions, and the probability that the SN shows greater controllability than the FPN and DMN in both 2-back and 0-back working-memory conditions, in random subsamples drawn from N = 737 participants. lAI left anterior insula, rAI right anterior insula, DMPFC dorsomedial prefrontal cortex, lMFG left middle frontal gyrus, rMFG right middle frontal gyrus, lFEF left frontal eye field, rFEF right frontal eye field, lIPL left intraparietal lobule, rIPL right intraparietal lobule, PCC posterior cingulate cortex, VMPFC ventromedial prefrontal cortex. Source data are provided as a Source data file.CC BY · PubMed Central

Verification

Claims the paper makes

The claims and statistics of this paper haven’t been checked yet.

Run the check — free, no account needed. It reads the open-access text and checks the sources it cites.

A few free checks a day · papers already verified open instantly · results are public

Claims other papers make about this one

Each is checked against this paper’s own text: does it say what the citing paper says it does?

Self-check

Percentages, sums and reported differences re-computed from the paper’s own numbers.

The self-check needs the paper’s full text.

Citations

Cites

Show all 115 references

Research works printed but not linked: 1

  1. Baddeley, A. D. Working Memory (Clarendon Press; Oxford University Press, 1986).

Cited by

Sorted by citations

See all 105

Metadata

Authors
Cai, W., Ryali, S., Pasumarthy, R., Talasila, V., & Menon, V.
Affiliations
  • Stanford Medicine (US)
  • Indian Institute of Technology Madras (IN)
  • Ramaiah Institute of Technology (IN)
Corresponding author
  • Cai, Weidong
  • Menon, Vinod
Venue
Nature Communications
Published
2021-06-29
Volume
12
Issue
1
Pages
3314-3314
ISSN
2041-1723 (ISSN-L)
OpenAlex
W3176607719
Cited by
105
References
115
Citations by year
2026: 16 · 2025: 33 · 2024: 26 · 2023: 11 · 2022: 17 · 2021: 2
FWCI
7.36
Type
journal article
Language
en
Open access
Locations
  • Nature Communications (publishedVersion, cc-by)
  • PubMed Central (publishedVersion, cc-by)
  • PubMed (publishedVersion)
  • RePEc: Research Papers in Economics (submittedVersion)
  • DOAJ (DOAJ: Directory of Open Access Journals) (submittedVersion, cc-by-sa)
Funders
  • U.S. Department of Health & Human Services | NIH | National Institute of Mental Health (MH105625, MH121069)
  • U.S. Department of Health & Human Services | NIH | National Institute of Biomedical Imaging and Bioengineering (EB022907)
  • U.S. Department of Health & Human Services | NIH | National Institute of Neurological Disorders and Stroke (NS086085)
  • U.S. Department of Health & Human Services | NIH | Eunice Kennedy Shriver National Institute of Child Health and Human Development (HD074652)
Topics
  • Life Sciences › Neuroscience › Cognitive Neuroscience › Functional Brain Connectivity Studies
  • Life Sciences › Neuroscience › Cognitive Neuroscience › Neural dynamics and brain function
  • Life Sciences › Neuroscience › Cognitive Neuroscience › Neural and Behavioral Psychology Studies
Keywords
working memory, network controllability, salience network, frontoparietal network, default mode network, anterior insula, dorsolateral prefrontal cortex, working memory load, network hubs, cognitive control
MeSH terms
Adult, Brain, Brain Mapping, Cerebral Cortex, Female, Gyrus Cinguli, Humans, Male, Memory, Short-Term, Models, Neurological, Nerve Net, Neural Pathways, Reproducibility of Results, Prefrontal Cortex, Young Adult, Executive Function

About these checks

Registry, retraction, Cites and statistics results are computed, not judged, with one exception: a printed reference that no index lists is read once by a model before it counts as a citation error. Claims are extracted by a model and kept only when their quote appears verbatim in the text; each cited source is then checked, with a model’s help, for whether it says what the claim relies on. Those verdicts can be wrong — read the claim’s quote and the cited source before relying on one.

Statistics and arithmetic are recomputed, not judged.

Confidence bands are shown only for fields calibrated on our annotated test set. None is calibrated yet, so no band is shown.

What counts as a claim ›How we measure confidence ›How we check this ›

Are you an author, or do you see a problem with this page? Request a review