Cited by 89

The DOI matches its Crossref record; 2 of the 2 references it cites were found in a registry or an index.

Single-cell microRNA sequencing method comparison and application to cell lines and circulating lung tumor cells

Hücker, Sarah M., Fehlmann, Tobias, Werno, Christian, Weidele, Kathrin, Lüke, Florian, Schlenska-Lange, Anke, Klein, Christoph A., Keller, Andreas, Kirsch, Stefan·2021·Nature Communications

Abstract

Molecular single cell analyses provide insights into physiological and pathological processes. Here, in a stepwise approach, we first evaluate 19 protocols for single cell small RNA sequencing on MCF7 cells spiked with 1 pg of 1,006 miRNAs. Second, we analyze MCF7 single cell equivalents of the eight best protocols. Third, we sequence single cells from eight different cell lines and 67 circulating tumor cells (CTCs) from seven SCLC patients. Altogether, we analyze 244 different samples. We observe high reproducibility within protocols and reads covered a broad spectrum of RNAs. For the 67 CTCs, we detect a median of 68 miRNAs, with 10 miRNAs being expressed in 90% of tested cells. Enrichment analysis suggested the lung as the most likely organ of origin and enrichment of cancer-related categories. Even the identification of non-annotated candidate miRNAs was feasible, underlining the potential of single cell small RNA sequencing.

Overview

The claims and statistics of this paper haven’t been checked yet.

Run the check — free, no account needed. It reads the open-access text and checks the sources it cites.

A few free checks a day · papers already verified open instantly · results are public

Integrity signals

Registry

Crossref · 10.1038/s41467-021-24611-w

Cites

2 of 2 references verified0 citation errors · 0 not checkable

Statistics

Figures

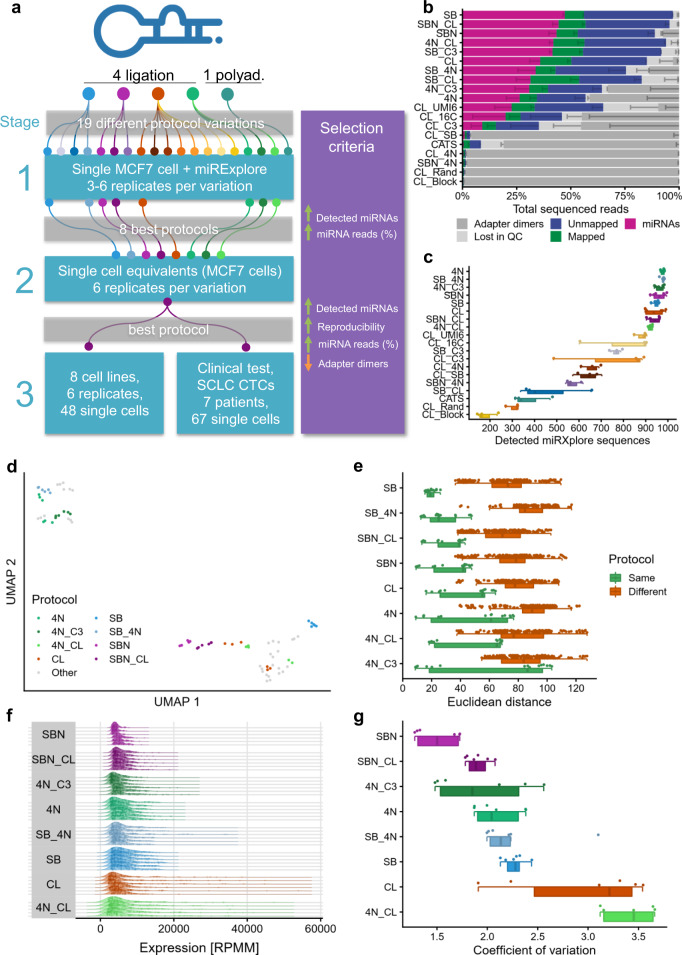
Fig. 1 Experimental setup and protocol comparison with miRXplore spike-in (stage 1). a Overview of the experimental setup consisting of three stages. SCLC CTCs = small cell lung cancer circulating tumor cells. b Read distribution for all tested protocols, sorted by miRNA reads proportion. The data are presented as mean values ± the standard deviation (n = 6 biologically independent samples for the top eight protocols, n = 3 for the others), which is shown as a smaller error bar in a darker color than its corresponding read group and only represented in one direction. c Detected miRXplore sequences for all tested protocols, sorted by decreasing average per protocol shown as boxplot (bottom) and dot plot (top). Each sample is shown as one dot and colored by protocol. The boxes span the first to the third quartile with the vertical line inside the box representing the median value. The whiskers show the minimum and maximum values or values up to 1.5 times the interquartile range below or above the first or third quartile if outliers are present. d UMAP embedding of all sequenced samples with miRXplore spike-in. The samples of the best eight protocols are highlighted in their respective color. The remaining protocols are grayed out. e Euclidean distance on the log2 transformed sequence expression showing the reproducibility between all replicates of the same protocol (green) and between all samples of one protocol variant compared to all other protocol variants (brown). Each dot represents the distance observed between two samples. Only nonredundant distances are shown (i.e., the distance of sample 1 to sample 2 is considered identical to the distance of sample 2 to sample 1). For each protocol, a dot plot (top), as well as a boxplot (bottom), is shown. The boxplot was defined in the same manner as for panel c. f Distribution of the top 100 highest expressed miRXplore sequences per sample, normalized as reads per million mapped (RPMM). The samples are grouped by protocol and ordered by ascending coefficient of variation. The vertical lines inside the areas delimit the quartiles. Every dot inside the area represents the expression level of one sequence. g Coefficient of variation for all samples grouped by the protocol in ascending order shown as dot plot (top) as well as boxplot (bottom). Each sample is represented by a dot. The boxplot was defined in the same manner as for panel c. Source data are provided in the Source Data file.
Fig. 1 Experimental setup and protocol comparison with miRXplore spike-in (stage 1). a Overview of the experimental setup consisting of three stages. SCLC CTCs = small cell lung cancer circulating tumor cells. b Read distribution for all tested protocols, sorted by miRNA reads proportion. The data are presented as mean values ± the standard deviation (n = 6 biologically independent samples for the top eight protocols, n = 3 for the others), which is shown as a smaller error bar in a darker color than its corresponding read group and only represented in one direction. c Detected miRXplore sequences for all tested protocols, sorted by decreasing average per protocol shown as boxplot (bottom) and dot plot (top). Each sample is shown as one dot and colored by protocol. The boxes span the first to the third quartile with the vertical line inside the box representing the median value. The whiskers show the minimum and maximum values or values up to 1.5 times the interquartile range below or above the first or third quartile if outliers are present. d UMAP embedding of all sequenced samples with miRXplore spike-in. The samples of the best eight protocols are highlighted in their respective color. The remaining protocols are grayed out. e Euclidean distance on the log2 transformed sequence expression showing the reproducibility between all replicates of the same protocol (green) and between all samples of one protocol variant compared to all other protocol variants (brown). Each dot represents the distance observed between two samples. Only nonredundant distances are shown (i.e., the distance of sample 1 to sample 2 is considered identical to the distance of sample 2 to sample 1). For each protocol, a dot plot (top), as well as a boxplot (bottom), is shown. The boxplot was defined in the same manner as for panel c. f Distribution of the top 100 highest expressed miRXplore sequences per sample, normalized as reads per million mapped (RPMM). The samples are grouped by protocol and ordered by ascending coefficient of variation. The vertical lines inside the areas delimit the quartiles. Every dot inside the area represents the expression level of one sequence. g Coefficient of variation for all samples grouped by the protocol in ascending order shown as dot plot (top) as well as boxplot (bottom). Each sample is represented by a dot. The boxplot was defined in the same manner as for panel c. Source data are provided in the Source Data file.CC BY · PubMed Central
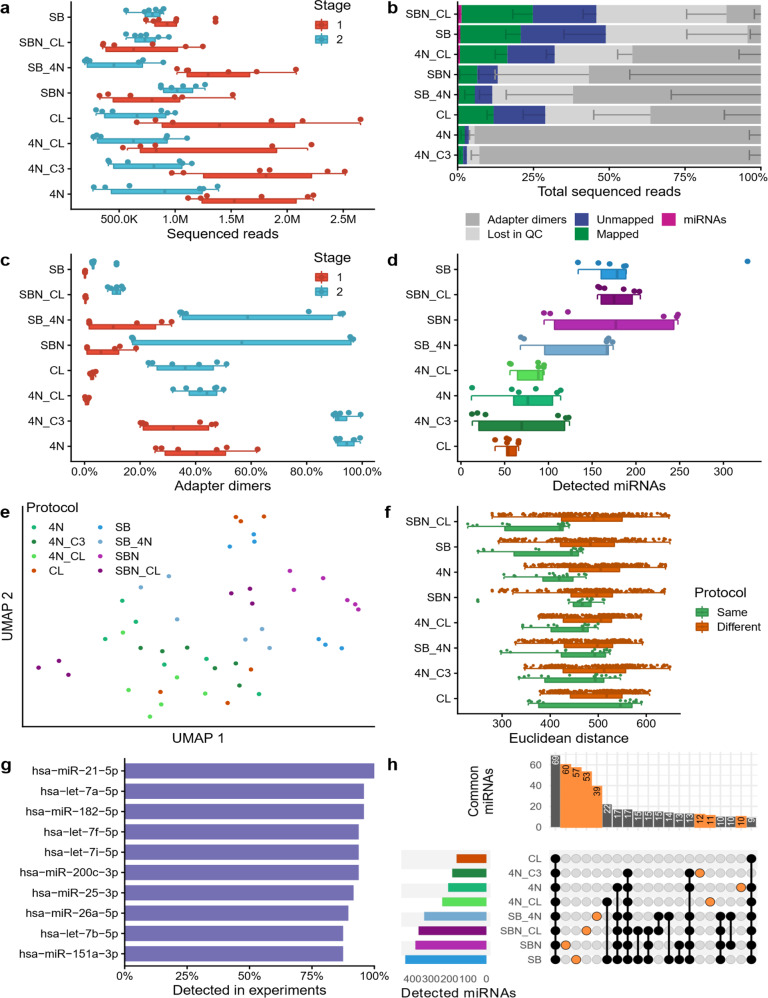
Fig. 2 Protocol comparison with single cell equivalents (stage 2). a Number of reads sequenced in stage 1 (miRXplore spike-in) and 2 (MCF7 single cell equivalents), shown as boxplot (bottom) and dot plot (top). Each dot represents one sample. The boxes span the first to the third quartile with the vertical line inside the box representing the median value. The whiskers show the minimum and maximum values or values up to 1.5 times the interquartile range below or above the first or third quartile if outliers are present. b Read distribution for all tested protocols, sorted by miRNA reads proportion. The data were presented as mean values ± the standard deviation (n = 6 biologically independent samples), which is shown as a smaller error bar in a darker color than its corresponding read group and only represented in one direction. c Adapter dimers found in stage 1 and stage 2, shown as boxplot (bottom) and dot plot (top). Each dot represents one sample. The boxplot was defined in the same manner as for panel a. d Detected miRNAs for every sample, sorted by decreasing average per protocol shown as boxplot (bottom) and dot plot (top). Each sample is shown as one dot and colored by protocol. The boxplot was defined in the same manner as for panel a. e UMAP embedding of all samples. Each sample (dot) is colored by its protocol. f Euclidean distance on the log2 transformed sequence expression showing the reproducibility between all replicates of the same protocol (green) and between all samples of different protocols (brown). Each dot represents the distance observed between two samples. Only nonredundant distances are shown (i.e., the distance of sample 1 to sample 2 is considered identical to the distance of sample 2 to sample 1). For each protocol a dot plot (top), as well as a boxplot (bottom), is shown. The boxplot was defined in the same manner as for panel a. g Top ten miRNAs detected in multiple experiments. h Upset plot showing the miRNAs jointly detected by multiple protocols, or exclusively found in only one protocol (orange). The bar plot at the top shows on the y-axis the number of miRNAs detected by the protocols highlighted by connected black or orange dots in the grid below. The bar plot on the left shows on the x-axis the total number of miRNAs detected in the least one of the replicates of the protocol shown on the y-axis. Source data are provided in the Source Data file.
Fig. 2 Protocol comparison with single cell equivalents (stage 2). a Number of reads sequenced in stage 1 (miRXplore spike-in) and 2 (MCF7 single cell equivalents), shown as boxplot (bottom) and dot plot (top). Each dot represents one sample. The boxes span the first to the third quartile with the vertical line inside the box representing the median value. The whiskers show the minimum and maximum values or values up to 1.5 times the interquartile range below or above the first or third quartile if outliers are present. b Read distribution for all tested protocols, sorted by miRNA reads proportion. The data were presented as mean values ± the standard deviation (n = 6 biologically independent samples), which is shown as a smaller error bar in a darker color than its corresponding read group and only represented in one direction. c Adapter dimers found in stage 1 and stage 2, shown as boxplot (bottom) and dot plot (top). Each dot represents one sample. The boxplot was defined in the same manner as for panel a. d Detected miRNAs for every sample, sorted by decreasing average per protocol shown as boxplot (bottom) and dot plot (top). Each sample is shown as one dot and colored by protocol. The boxplot was defined in the same manner as for panel a. e UMAP embedding of all samples. Each sample (dot) is colored by its protocol. f Euclidean distance on the log2 transformed sequence expression showing the reproducibility between all replicates of the same protocol (green) and between all samples of different protocols (brown). Each dot represents the distance observed between two samples. Only nonredundant distances are shown (i.e., the distance of sample 1 to sample 2 is considered identical to the distance of sample 2 to sample 1). For each protocol a dot plot (top), as well as a boxplot (bottom), is shown. The boxplot was defined in the same manner as for panel a. g Top ten miRNAs detected in multiple experiments. h Upset plot showing the miRNAs jointly detected by multiple protocols, or exclusively found in only one protocol (orange). The bar plot at the top shows on the y-axis the number of miRNAs detected by the protocols highlighted by connected black or orange dots in the grid below. The bar plot on the left shows on the x-axis the total number of miRNAs detected in the least one of the replicates of the protocol shown on the y-axis. Source data are provided in the Source Data file.CC BY · PubMed Central
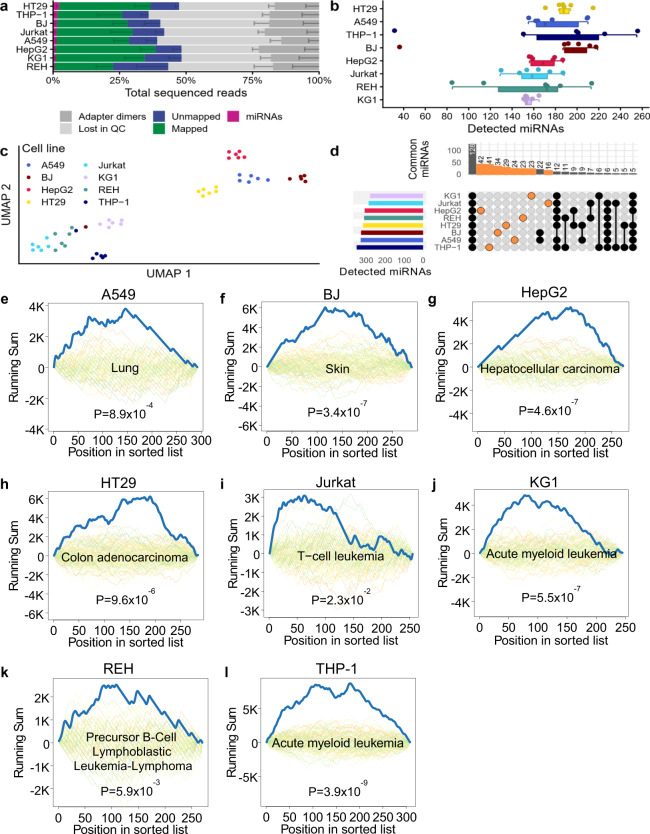
Fig. 3 Application of protocol SBN_CL to eight different cell lines. a Read distribution for all tested cell lines, sorted by miRNA reads proportion. The data were presented as mean values ± the standard deviation (n = 6 biologically independent samples), which is shown as a smaller error bar in a darker color than its corresponding read group and only represented in one direction. b Detected miRNAs for every sample, sorted by decreasing average per cell line shown as boxplot (bottom) and dot plot (top). Each sample is shown as one dot and colored by protocol. Each dot represents one sample. The boxes span the first to the third quartile with the vertical line inside the box representing the median value. The whiskers show the minimum and maximum values or values up to 1.5 times the interquartile range below or above the first or third quartile if outliers are present. c UMAP embedding of all samples. Each dot represents one sample. d Upset plot showing the miRNAs jointly detected in multiple cell lines, or exclusively found in only one cell line (orange). The bar plot at the top shows on the y-axis the number of miRNAs detected in the cell lines highlighted by connected black or orange dots in the grid below. The bar plot on the left shows on the x-axis the total number of miRNAs detected in at least one of the samples of the cell line shown on the y-axis. e–l Examples of significantly enriched categories for each of the analyzed cell lines. Each plot shows the computed running sum (blue), running sums of random permutations (background), and the FDR adjusted P value for the cell line specified in the title. Exact p values were computed by the gene set enrichment analysis implementation of miEAA for each enrichment and FDR adjusted, separately for each database. Source data are provided in the Source Data file.
Fig. 3 Application of protocol SBN_CL to eight different cell lines. a Read distribution for all tested cell lines, sorted by miRNA reads proportion. The data were presented as mean values ± the standard deviation (n = 6 biologically independent samples), which is shown as a smaller error bar in a darker color than its corresponding read group and only represented in one direction. b Detected miRNAs for every sample, sorted by decreasing average per cell line shown as boxplot (bottom) and dot plot (top). Each sample is shown as one dot and colored by protocol. Each dot represents one sample. The boxes span the first to the third quartile with the vertical line inside the box representing the median value. The whiskers show the minimum and maximum values or values up to 1.5 times the interquartile range below or above the first or third quartile if outliers are present. c UMAP embedding of all samples. Each dot represents one sample. d Upset plot showing the miRNAs jointly detected in multiple cell lines, or exclusively found in only one cell line (orange). The bar plot at the top shows on the y-axis the number of miRNAs detected in the cell lines highlighted by connected black or orange dots in the grid below. The bar plot on the left shows on the x-axis the total number of miRNAs detected in at least one of the samples of the cell line shown on the y-axis. e–l Examples of significantly enriched categories for each of the analyzed cell lines. Each plot shows the computed running sum (blue), running sums of random permutations (background), and the FDR adjusted P value for the cell line specified in the title. Exact p values were computed by the gene set enrichment analysis implementation of miEAA for each enrichment and FDR adjusted, separately for each database. Source data are provided in the Source Data file.CC BY · PubMed Central
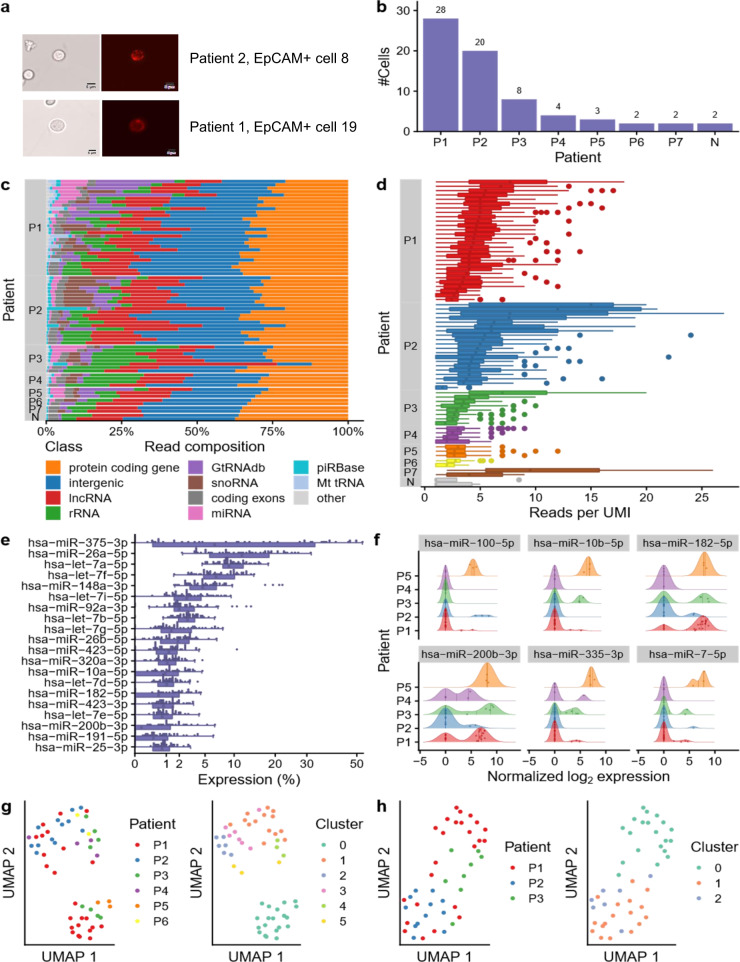
Fig. 4 Application of protocol SBN_CL to CTCs of small cell lung cancer (SCLC) patients. a Representative images of two EpCAM+ cells enriched from blood samples of two SCLC patients (20x). The cells were isolated by micromanipulation for miRNA sequencing. The scale bar is equivalent to 5 µm. b Number of cells sequenced per patient and the two empty negative controls. c Distribution of the mapped reads for each cell grouped per patient and ordered by descending miRNA proportion. d Boxplot showing the number of reads per UMI for each cell, grouped by the patient in descending order. Each miRNA is shown as one dot. The boxes span the first to the third quartile with the vertical line inside the box representing the median value. The whiskers show the minimum and maximum values or values up to 1.5 times the interquartile range below or above the first or third quartile if outliers are present. e Distribution of the top 20 most expressed miRNAs across all cells shown as boxplot (bottom) and dot plot (top). The boxes span the first to the third quartile with the vertical line inside the box representing the median value. The whiskers show the minimum and maximum values or values up to 1.5 times the interquartile range below or above the first or third quartile if outliers are present. f Expression distribution of the six most variable miRNAs. Patients with less than three cells were excluded. The vertical lines inside the areas delimit the quartiles. The dots inside the area represent the expression of a miRNA in the cell of the corresponding patient. g UMAP embedding of all samples colored by the patient (left) and colored by cluster (right). h UMAP embedding of the three patients with the highest number of CTCs colored by the patient (left) and colored by cluster (right). Source data are provided in the Source Data file.
Fig. 4 Application of protocol SBN_CL to CTCs of small cell lung cancer (SCLC) patients. a Representative images of two EpCAM+ cells enriched from blood samples of two SCLC patients (20x). The cells were isolated by micromanipulation for miRNA sequencing. The scale bar is equivalent to 5 µm. b Number of cells sequenced per patient and the two empty negative controls. c Distribution of the mapped reads for each cell grouped per patient and ordered by descending miRNA proportion. d Boxplot showing the number of reads per UMI for each cell, grouped by the patient in descending order. Each miRNA is shown as one dot. The boxes span the first to the third quartile with the vertical line inside the box representing the median value. The whiskers show the minimum and maximum values or values up to 1.5 times the interquartile range below or above the first or third quartile if outliers are present. e Distribution of the top 20 most expressed miRNAs across all cells shown as boxplot (bottom) and dot plot (top). The boxes span the first to the third quartile with the vertical line inside the box representing the median value. The whiskers show the minimum and maximum values or values up to 1.5 times the interquartile range below or above the first or third quartile if outliers are present. f Expression distribution of the six most variable miRNAs. Patients with less than three cells were excluded. The vertical lines inside the areas delimit the quartiles. The dots inside the area represent the expression of a miRNA in the cell of the corresponding patient. g UMAP embedding of all samples colored by the patient (left) and colored by cluster (right). h UMAP embedding of the three patients with the highest number of CTCs colored by the patient (left) and colored by cluster (right). Source data are provided in the Source Data file.CC BY · PubMed Central
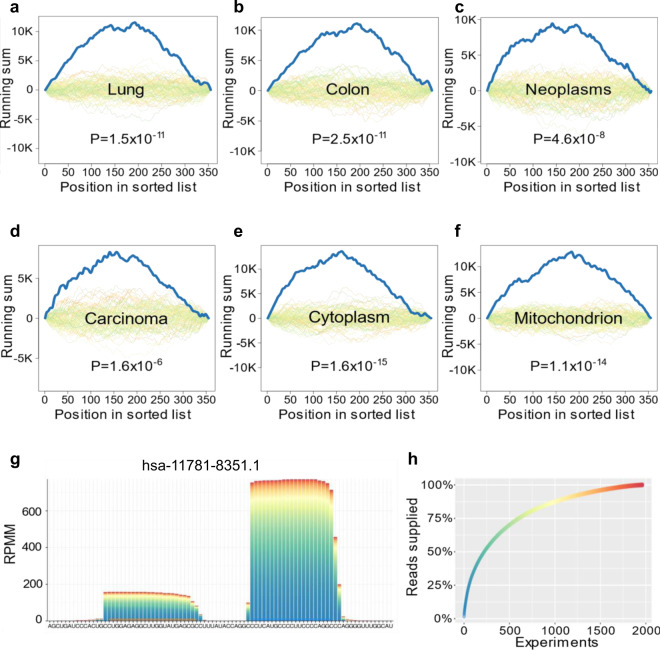
Fig. 5 Enrichment analysis of CTC miRNAs and miRNA candidates. a–f Top enriched organs, pathway categories, and cellular locations. Each plot shows the computed running sum (blue), running sums of random permutations (background), and the FDR adjusted P value. Exact p values were computed by the gene set enrichment analysis implementation of miEAA for each enrichment and FDR adjusted, separately for each database. g Pileup plot obtained from miRCarta for one of the overlapping miRNA candidates. The bars are colored according to the experiments the reads were contributed from. The expression is shown as reads per million mapped (RPMM). h Distribution of the read proportion supplied by each experiment that detected this miRNA.
Fig. 5 Enrichment analysis of CTC miRNAs and miRNA candidates. a–f Top enriched organs, pathway categories, and cellular locations. Each plot shows the computed running sum (blue), running sums of random permutations (background), and the FDR adjusted P value. Exact p values were computed by the gene set enrichment analysis implementation of miEAA for each enrichment and FDR adjusted, separately for each database. g Pileup plot obtained from miRCarta for one of the overlapping miRNA candidates. The bars are colored according to the experiments the reads were contributed from. The expression is shown as reads per million mapped (RPMM). h Distribution of the read proportion supplied by each experiment that detected this miRNA.CC BY · PubMed Central

Verification

Claims the paper makes

The claims and statistics of this paper haven’t been checked yet.

Run the check — free, no account needed. It reads the open-access text and checks the sources it cites.

A few free checks a day · papers already verified open instantly · results are public

Claims other papers make about this one

Each is checked against this paper’s own text: does it say what the citing paper says it does?

Self-check

Percentages, sums and reported differences re-computed from the paper’s own numbers.

The self-check needs the paper’s full text.

Citations

Cites

Research works printed but not linked: 51

  1. Bartel, D. P. MicroRNAs: target recognition and regulatory functions. Cell 136, 215–233 (2009). · DOI · Paper page
  2. Di Leva, G., Garofalo, M. & Croce, C. M. MicroRNAs in cancer. Annu. Rev. Pathol. 9, 287–314 (2014). · DOI
  3. Kozomara, A., Birgaoanu, M. & Griffiths-Jones, S. miRBase: from microRNA sequences to function. Nucleic Acids Res. 47, D155–D162 (2019). · DOI · Paper page
  4. Fromm, B. et al. Quo vadis microRNAs? Trends Genet. https://doi.org/10.1016/j.tig.2020.03.007 (2020). · DOI · Paper page
  5. Alles, J. et al. An estimate of the total number of true human miRNAs. Nucleic Acids Res. 47, 3353–3364 (2019). · DOI · Paper page
  6. Costales, M. G. et al. Small-molecule targeted recruitment of a nuclease to cleave an oncogenic RNA in a mouse model of metastatic cancer. Proc. Natl Acad. Sci. USA https://doi.org/10.1073/pnas.1914286117 (2020). · DOI
  7. Wright, C. et al. Comprehensive assessment of multiple biases in small RNA sequencing reveals significant differences in the performance of widely used methods. BMC Genomics 20, 513 (2019). · DOI · Paper page
  8. Dard-Dascot, C. et al. Systematic comparison of small RNA library preparation protocols for next-generation sequencing. BMC Genomics 19, 118 (2018). · DOI
  9. Giraldez, M. D. et al. Comprehensive multi-center assessment of small RNA-seq methods for quantitative miRNA profiling. Nat. Biotechnol. 36, 746–757 (2018). · DOI · Paper page
  10. Barberán-Soler, S. et al. Decreasing miRNA sequencing bias using a single adapter and circularization approach. Genome Biol. 19, 105 (2018). · DOI
  11. Herbert, Z. T. et al. Multisite evaluation of next-generation methods for small RNA quantification. J. Biomol. Tech. https://doi.org/10.7171/jbt.20-3102-001 (2020). · DOI
  12. Maguire, S., Lohman, G. J. S. & Guan, S. A low-bias and sensitive small RNA library preparation method using randomized splint ligation. Nucleic Acids Res. https://doi.org/10.1093/nar/gkaa480 (2020). · DOI
  13. Heinicke, F. et al. Systematic assessment of commercially available low-input miRNA library preparation kits. RNA Biol. 17, 75–86 (2020). · DOI
  14. Hu, J. F. et al. Sequencing-based quantitative mapping of the cellular small RNA landscape. Preprint at bioRxiv https://doi.org/10.1101/841130 (2019). · DOI
  15. Fuchs, R. T., Sun, Z., Zhuang, F. & Robb, G. B. Bias in ligation-based small RNA sequencing library construction is determined by adaptor and RNA structure. PLoS ONE 10, e0126049 (2015). · DOI
  16. Hardigan, A. A. et al. CRISPR/Cas9-targeted removal of unwanted sequences from small-RNA sequencing libraries. Nucleic Acids Res. 47, e84 (2019). · DOI · Paper page
  17. Baran-Gale, J. et al. Addressing bias in small RNA library preparation for sequencing: a new protocol recovers microRNAs that evade capture by current methods. Front. Genet. 6, 352 (2015). · DOI · Paper page
  18. Faridani, O. R. et al. Single-cell sequencing of the small-RNA transcriptome. Nat. Biotechnol. 34, 1264–1266 (2016). · DOI · Paper page
  19. Hagemann-Jensen, M., Abdullayev, I., Sandberg, R. & Faridani, O. R. Small-seq for single-cell small-RNA sequencing. Nat. Protoc. 13, 2407–2424 (2018). · DOI
  20. Shore, S. et al. Small RNA library preparationmethod for next-generation sequencing using chemical modifications to prevent adapter dimer formation. PLoS ONE 11, e0167009 (2016). · DOI
  21. Turchinovich, A. et al. Capture and amplification by tailing and switching (CATS). An ultrasensitive ligation-independent method for generation of DNA libraries for deep sequencing from picogram amounts of DNA and RNA. RNA Biol. 11, 817–828 (2014). · DOI
  22. Kern, F. et al. miEAA 2.0: integrating multi-species microRNA enrichment analysis and workflow management systems. Nucleic Acids Res. https://doi.org/10.1093/nar/gkaa309 (2020). · DOI
  23. Subelj, L. & Bajec, M. Unfolding communities in large complex networks: combining defensive and offensive label propagation for core extraction. Phys. Rev. E Stat. Nonlin. Soft Matter Phys. 83, 36103 (2011). · DOI
  24. Sticht, C., La Torre, C. D., Parveen, A. & Gretz, N. miRWalk: an online resource for prediction of microRNA binding sites. PLoS ONE 13, e0206239 (2018). · DOI · Paper page
  25. Backes, C. et al. miRCarta: a central repository for collecting miRNA candidates. Nucleic Acids Res. 46, D160–D167 (2018). · DOI
  26. Fehlmann, T. et al. A high-resolution map of the human small non-coding transcriptome. Bioinformatics 34, 1621–1628 (2018). · DOI · Paper page
  27. Belair, C. D. et al. High-throughput, efficient, and unbiased capture of small RNAs from low-input samples for sequencing. Sci. Rep. 9, 2262 (2019). · DOI
  28. Lama, L., Cobo, J., Buenaventura, D. & Ryan, K. Small RNA-seq: the RNA 5’-end adapter ligation problem and how to circumvent it. J. Biol. Methods https://doi.org/10.14440/jbm.2019.269 (2019). · DOI
  29. Wang, N. et al. Single-cell microRNA-mRNA co-sequencing reveals non-genetic heterogeneity and mechanisms of microRNA regulation. Nat. Commun. 10, 95 (2019). · DOI
  30. Isakova, A., Neff, N. & Quake, S. R. Single cell profiling of total RNA using Smart-seq-total. Preprint at bioRxiv https://doi.org/10.1101/2020.06.02.131060 (2020). · DOI
  31. Uddin, A. & Chakraborty, S. Role of miRNAs in lung cancer. J. Cell. Physiol. https://doi.org/10.1002/jcp.26607 (2018). · DOI
  32. Zhu, W., Wang, J.-P., Meng, Q.-Z., Zhu, F. & Hao, X.-F. MiR-142-5p reverses the resistance to gefitinib through targeting HOXD8 in lung cancer cells. Eur. Rev. Med. Pharmacol. Sci. 24, 4306–4313 (2020).
  33. Wang, Z., Liu, Z., Fang, X. & Yang, H. MiR-142-5p suppresses tumorigenesis by targeting PIK3CA in non-small cell lung cancer. Cell. Physiol. Biochem. 43, 2505–2515 (2017). · DOI
  34. Rijavec, E. et al. Liquid biopsy in non-small cell lung cancer: highlights and challenges. Cancers https://doi.org/10.3390/cancers12010017 (2019). · DOI
  35. Sethi, T. et al. Extracellular matrix proteins protect small cell lung cancer cells against apoptosis: a mechanism for small cell lung cancer growth and drug resistance in vivo. Nat. Med. 5, 662–668 (1999). · DOI
  36. Hartmann, T. N., Burger, J. A., Glodek, A., Fujii, N. & Burger, M. CXCR4 chemokine receptor and integrin signaling co-operate in mediating adhesion and chemoresistance in small cell lung cancer (SCLC) cells. Oncogene 24, 4462–4471 (2005). · DOI
  37. Oshita, F. et al. Increased expression of integrin beta1 is a poor prognostic factor in small-cell lung cancer. Anticancer Res. 22, 1065–1070 (2002).
  38. Kohmo, S. et al. Cell surface tetraspanin CD9 mediates chemoresistance in small cell lung cancer. Cancer Res. 70, 8025–8035 (2010). · DOI
  39. Hodkinson, P. S. et al. ECM overrides DNA damage-induced cell cycle arrest and apoptosis in small-cell lung cancer cells through beta1 integrin-dependent activation of PI3-kinase. Cell Death Differ. 13, 1776–1788 (2006). · DOI
  40. Kechin, A., Boyarskikh, U., Kel, A. & Filipenko, M. cutPrimers: a new tool for accurate cutting of primers from reads of targeted next generation sequencing. J. Comput. Biol. 24, 1138–1143 (2017). · DOI
  41. Dobin, A. et al. STAR: ultrafast universal RNA-seq aligner. Bioinformatics. (Oxf., Engl.) 29, 15–21 (2013). · DOI · Paper page
  42. Liao, Y., Smyth, G. K. & Shi, W. featureCounts: an efficient general purpose program for assigning sequence reads to genomic features. Bioinformatics 30, 923–930 (2014). · DOI · Paper page
  43. Frankish, A. et al. GENCODE reference annotation for the human and mouse genomes. Nucleic Acids Res. 47, D766–D773 (2019). · DOI
  44. Wang, J. et al. piRBase: a comprehensive database of piRNA sequences. Nucleic Acids Res. 47, D175–D180 (2019). · DOI
  45. Chan, P. P. & Lowe, T. M. GtRNAdb 2.0: an expanded database of transfer RNA genes identified in complete and draft genomes. Nucleic Acids Res. 44, D184–D189 (2016). · DOI
  46. Weese, D., Holtgrewe, M. & Reinert, K. RazerS 3: faster, fully sensitive read mapping. Bioinformatics 28, 2592–2599 (2012). · DOI
  47. Lorenz, R. et al. ViennaRNA Package 2.0. Algorithms Mol. Biol. 6, 26 (2011). · DOI · Paper page
  48. Fehlmann, T. et al. Web-based NGS data analysis using miRMaster: a large-scale meta-analysis of human miRNAs. Nucleic Acids Res. 45, 8731–8744 (2017). · DOI
  49. Smith, T., Heger, A. & Sudbery, I. UMI-tools: modeling sequencing errors in unique molecular identifiers to improve quantification accuracy. Genome Res. 27, 491–499 (2017). · DOI
  50. Wickham, H. ggplot2. Elegant Graphics for Data Analysis (Springer, 2016). · DOI
  51. Stuart, T. et al. Comprehensive integration of single-cell data. Cell 177, 1888–1902 (2019). · DOI · Paper page

Cited by

Sorted by citations

See all 89

Metadata

Authors
Hücker, S. M., Fehlmann, T., Werno, C., Weidele, K., Lüke, F., Schlenska-Lange, A., Klein, C. A., Keller, A., & Kirsch, S.
Venue
Nature Communications
Published
2021-07-14
Volume
12
Issue
1
ISSN
2041-1723
Cited by
89
References
2
Language
en
Funders
Bayerisches Staatsministerium für Wirtschaft, Infrastruktur, Verkehr und Technologie (AZ 20-3410.1-1-2)

About these checks

Registry, retraction, Cites and statistics results are computed, not judged, with one exception: a printed reference that no index lists is read once by a model before it counts as a citation error. Claims are extracted by a model and kept only when their quote appears verbatim in the text; each cited source is then checked, with a model’s help, for whether it says what the claim relies on. Those verdicts can be wrong — read the claim’s quote and the cited source before relying on one.

Statistics and arithmetic are recomputed, not judged.

Confidence bands are shown only for fields calibrated on our annotated test set. None is calibrated yet, so no band is shown.

What counts as a claim ›How we measure confidence ›How we check this ›

Are you an author, or do you see a problem with this page? Request a review