

The DOI matches its Crossref record; 8 of the 8 references it cites were found in a registry or an index.
Loss-of-function, gain-of-function and dominant-negative mutations have profoundly different effects on protein structure
Abstract
Most known pathogenic mutations occur in protein-coding regions of DNA and change the way proteins are made. Taking protein structure into account has therefore provided great insight into the molecular mechanisms underlying human genetic disease. While there has been much focus on how mutations can disrupt protein structure and thus cause a loss of function (LOF), alternative mechanisms, specifically dominant-negative (DN) and gain-of-function (GOF) effects, are less understood. Here, we investigate the protein-level effects of pathogenic missense mutations associated with different molecular mechanisms. We observe striking differences between recessive vs dominant, and LOF vs non-LOF mutations, with dominant, non-LOF disease mutations having much milder effects on protein structure, and DN mutations being highly enriched at protein interfaces. We also find that nearly all computational variant effect predictors, even those based solely on sequence conservation, underperform on non-LOF mutations. However, we do show that non-LOF mutations could potentially be identified by their tendency to cluster in three-dimensional space. Overall, our work suggests that many pathogenic mutations that act via DN and GOF mechanisms are likely being missed by current variant prioritisation strategies, but that there is considerable scope to improve computational predictions through consideration of molecular disease mechanisms.
Overview
The claims and statistics of this paper haven’t been checked yet.
Run the check — free, no account needed. It reads the open-access text and checks the sources it cites.
Integrity signals
Registry
Cites
Statistics
Figures
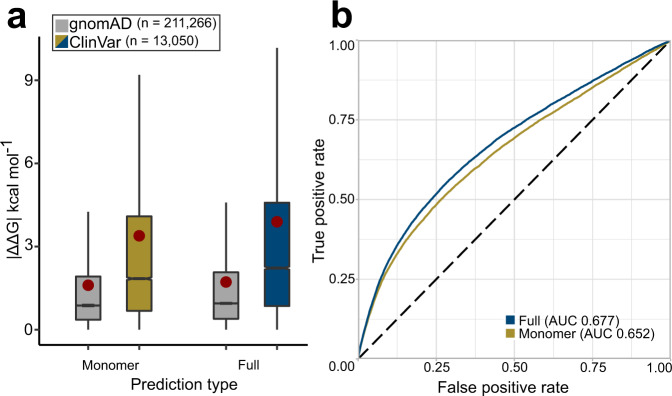
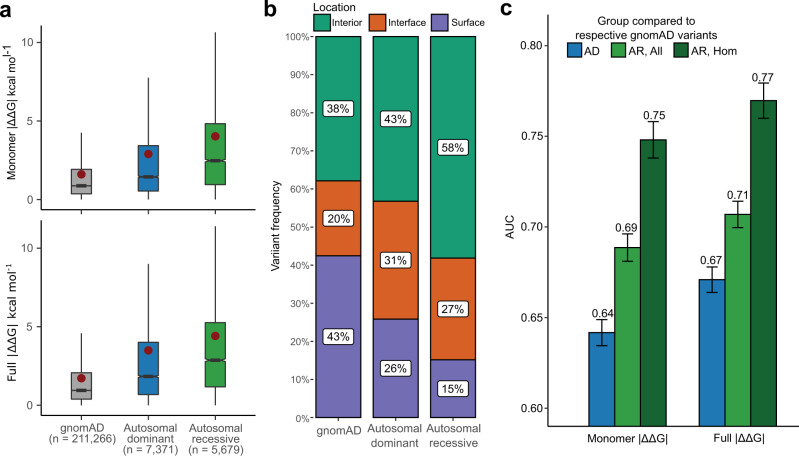
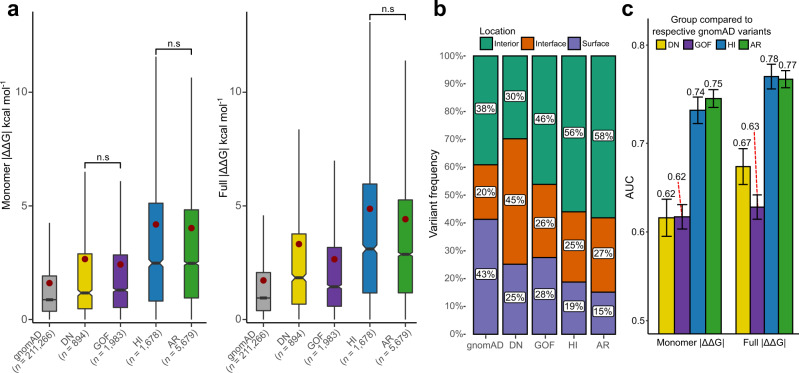
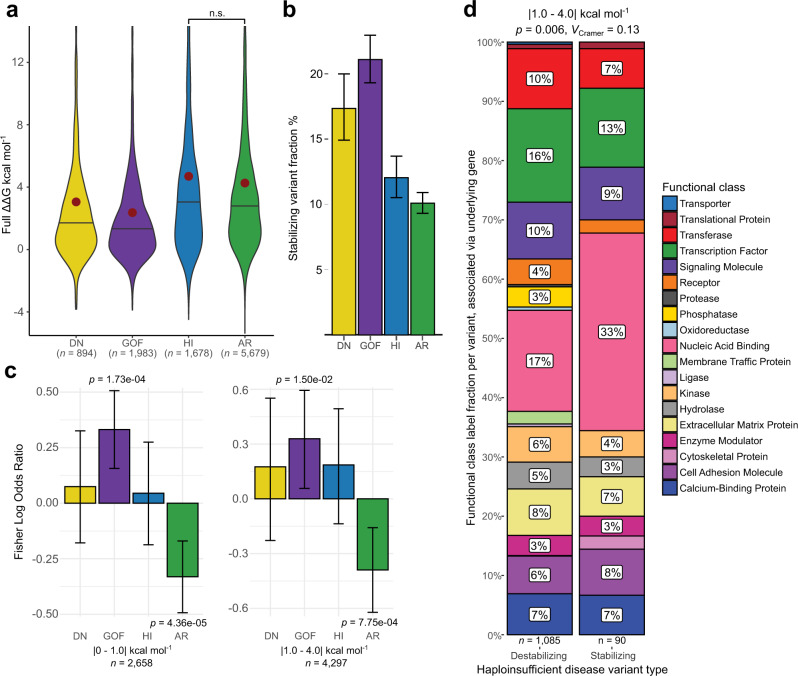
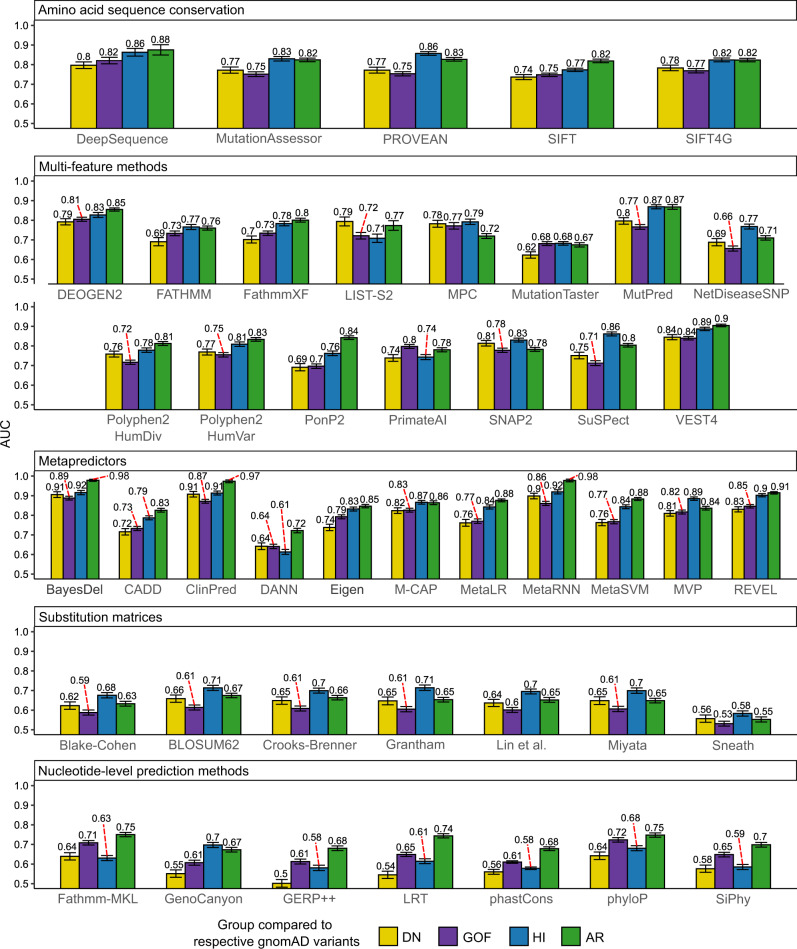
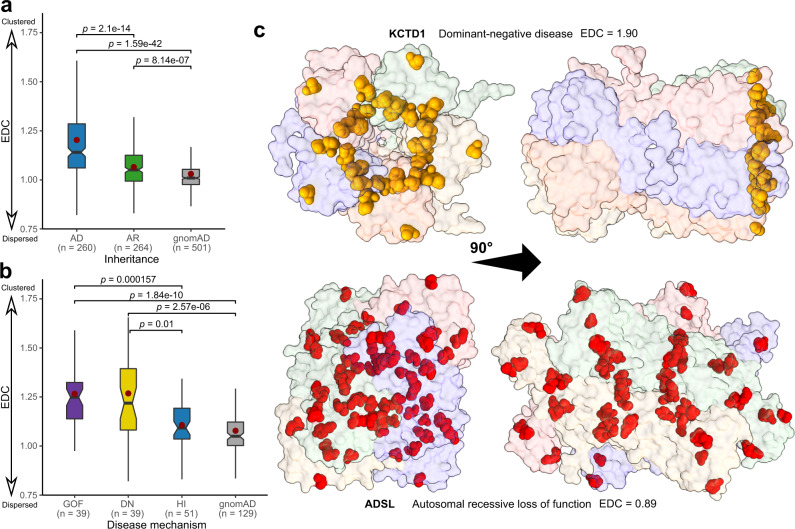
Verification
Claims the paper makes
The claims and statistics of this paper haven’t been checked yet.
Run the check — free, no account needed. It reads the open-access text and checks the sources it cites.
Claims other papers make about this one
Each is checked against this paper’s own text: does it say what the citing paper says it does?
In the citing paper
“The regulation of NRXN1 splicing, including the formation of aberrant splice sites by specific RBPs, is poorly understood; >100 RBPs are predicted to interact with NRXN1 mRNA in a cell-type42,43 and neuronal activity23 dependent-manner.”
From Phenotypic complexities of rare heterozygous neurexin-1 deletions (2025) · cites this paper as [43]
Self-check
Percentages, sums and reported differences re-computed from the paper’s own numbers.
The self-check needs the paper’s full text.
Citations
Cites
Highly accurate protein structure prediction with AlphaFold
Jumper, J., Evans, R., Pritzel, A., Green, T., Figurnov, M., Ronneberger, O., Tunyasuvunakool, K., Bates, R., Žídek, A., Potapenko, A., et al. (2021) · Nature · doi:10.1038/s41586-021-03819-2 · Cited by 43,764
Richards, S., Aziz, N., Bale, S., Bick, D., Das, S., Gastier-Foster, J., Grody, W. W., Hegde, M., Lyon, E., Spector, E., et al. (2015) · Genetics in Medicine · doi:10.1038/gim.2015.30 · Cited by 32,594
pROC: an open-source package for R and S+ to analyze and compare ROC curves
Robin, X., Turck, N., Hainard, A., Tiberti, N., Lisacek, F., Sanchez, J.-C., & Müller, M. (2011) · BMC Bioinformatics · doi:10.1186/1471-2105-12-77 · Cited by 13,697
Announcing the worldwide Protein Data Bank
Berman, H., Henrick, K., & Nakamura, H. (2003) · Nature Structural & Molecular Biology · doi:10.1038/nsb1203-980 · Cited by 3,093
Highly accurate protein structure prediction for the human proteome
Tunyasuvunakool, K., Adler, J., Wu, Z., Green, T., Zielinski, M., Žídek, A., Bridgland, A., Cowie, A., Meyer, C., Laydon, A., et al. (2021) · Nature · doi:10.1038/s41586-021-03828-1 · Cited by 3,025
ClinGen — The Clinical Genome Resource
Rehm, H. L., Berg, J. S., Brooks, L. D., Bustamante, C. D., Evans, J. P., Landrum, M. J., Ledbetter, D. H., Maglott, D. R., Martin, C. L., Nussbaum, R. L., et al. (2015) · New England Journal of Medicine · doi:10.1056/nejmsr1406261 · Cited by 1,496
Widespread macromolecular interaction perturbations in human genetic disorders
Sahni, N., Yi, S., Taipale, M., Fuxman Bass, J. I., Coulombe-Huntington, J., Yang, F., Peng, J., Weile, J., Karras, G. I., Wang, Y., et al. (2015) · Cell · doi:10.1016/j.cell.2015.04.013 · Cited by 594
Variant interpretation: functional assays to the rescue
Starita, L. M., Ahituv, N., Dunham, M. J., Kitzman, J. O., Roth, F. P., Seelig, G., Shendure, J., & Fowler, D. M. (2017) · The American Journal of Human Genetics · doi:10.1016/j.ajhg.2017.07.014 · Cited by 381
Research works printed but not linked: 77
- Stenson, P. D. et al. The Human Gene Mutation Database: towards a comprehensive repository of inherited mutation data for medical research, genetic diagnosis and next-generation sequencing studies. Hum. Genet. 136, 665–677 (2017). · DOI
- Katsonis, P. et al. Single nucleotide variations: Biological impact and theoretical interpretation. Protein Sci. 23, 1650–1666 (2014). · DOI
- Landrum, M. J. et al. ClinVar: Public archive of relationships among sequence variation and human phenotype. Nucleic Acids Res. 42, 980–985 (2014). · DOI · Paper page
- Karczewski, K. J. et al. The mutational constraint spectrum quantified from variation in 141,456 humans. Nature 581, 434–443 (2020). · DOI · Paper page
- Gudmundsson, S. et al. Variant interpretation using population databases: Lessons from gnomAD. Hum. Mutat. humu.24309 https://doi.org/10.1002/humu.24309 (2021). · DOI
- Miosge, L. A. et al. Comparison of predicted and actual consequences of missense mutations. Proc. Natl. Acad. Sci. USA 112, E5189–E5198 (2015). · DOI
- Livesey, B. J. & Marsh, J. A. Using deep mutational scanning to benchmark variant effect predictors and identify disease mutations. Mol. Syst. Biol. 16, 1–12 (2020). · DOI
- Gray, V. E., Hause, R. J., Luebeck, J., Shendure, J. & Fowler, D. M. Quantitative missense variant effect prediction using large-scale mutagenesis data. Cell Syst. 6, 116–124.e3 (2018). · DOI
- Sanavia, T. et al. Limitations and challenges in protein stability prediction upon genome variations: towards future applications in precision medicine. Comput. Struct. Biotechnol. J. 18, 1968–1979 (2020). · DOI
- Heyn, P. et al. Gain-of-function DNMT3A mutations cause microcephalic dwarfism and hypermethylation of Polycomb-regulated regions. Nat. Genet. 51, 96–105 (2019). · DOI
- Holt, R. J. et al. De novo missense variants in FBXW11 cause diverse developmental phenotypes including brain, eye, and digit anomalies. Am. Am. J. Hum. Genet. 105, 640–657 (2019). · DOI
- Williamson, K. A. et al. Recurrent heterozygous PAX6 missense variants cause severe bilateral microphthalmia via predictable effects on DNA–protein interaction. Genet. Med. 22, 598–609 (2020). · DOI
- McEntagart, M. et al. A Restricted Repertoire of de Novo Mutations in ITPR1 Cause Gillespie Syndrome with Evidence for Dominant-Negative Effect. Am. J. Hum. Genet. 98, 981–992 (2016). · DOI
- Yue, P., Li, Z. & Moult, J. Loss of protein structure stability as a major causative factor in monogenic disease. J. Mol. Biol. 353, 459–473 (2005). · DOI
- Glusman, G. et al. Mapping genetic variations to three-dimensional protein structures to enhance variant interpretation: A proposed framework. Genome Med. 9, 1–10 (2017). · DOI
- Bhattacharya, R., Rose, P. W., Burley, S. K. & Prlić, A. Impact of genetic variation on three dimensional structure and function of proteins. PLoS ONE 12, 1–22 (2017). · DOI
- Gerasimavicius, L., Liu, X. & Marsh, J. A. Identification of pathogenic missense mutations using protein stability predictors. Sci. Rep. 10, 1–10 (2020). · DOI
- Casadio, R., Vassura, M., Tiwari, S., Fariselli, P. & Luigi Martelli, P. Correlating disease-related mutations to their effect on protein stability: A large-scale analysis of the human proteome. Hum. Mutat. 32, 1161–1170 (2011). · DOI
- Birolo, G. et al. Protein Stability Perturbation Contributes to the Loss of Function in Haploinsufficient Genes. Front. Mol. Biosci. 8, 620793 (2021). · DOI
- Herskowitz, I. dominant negative mutations CS-G-CS. Nature 329, 1–4 (1987). · DOI
- Bergendahl, L. T. et al. The role of protein complexes in human genetic disease. Protein Sci. 28, 1400–1411 (2019). · DOI
- Veitia, R. A., Caburet, S. & Birchler, J. A. Mechanisms of Mendelian dominance. Clin. Genet. 93, 419–428 (2018). · DOI
- Delgado, J., Radusky, L. G., Cianferoni, D. & Serrano, L. FoldX 5.0: Working with RNA, small molecules and a new graphical interface. Bioinformatics 35, 4168–4169 (2019). · DOI
- Hanley, J. A. & McNeil, B. J. The meaning and use of the area under a receiver operating characteristic (ROC) curve. Radiology 143, 29–36 (1982). · DOI · Paper page
- Jubb, H. C. et al. Mutations at protein-protein interfaces: Small changes over big surfaces have large impacts on human health. Prog. Biophys. Mol. Biol. 128, 3–13 (2017). · DOI
- Amberger, J. S., Bocchini, C. A., Scott, A. F. & Hamosh, A. OMIM.org: Leveraging knowledge across phenotype-gene relationships. Nucleic Acids Res. 47, D1038–D1043 (2019). · DOI
- Tokuriki, N., Stricher, F., Schymkowitz, J., Serrano, L. & Tawfik, D. S. The stability effects of protein mutations appear to be universally distributed. J. Mol. Biol. 369, 1318–1332 (2007). · DOI
- Ferrer-Costa, C., Orozco, M. & de la Cruz, X. Characterization of disease-associated single amino acid polymorphisms in terms of sequence and structure properties. J. Mol. Biol. 315, 771–786 (2002). · DOI
- Livesey, B. J. & Marsh, J. A. The properties of human disease mutations at protein interfaces. PLOS Comput. Biol. 18, e1009858 (2022). · DOI
- Seifi, M. & Walter, M. A. Accurate prediction of functional, structural, and stability changes in PITX2 mutations using in silico bioinformatics algorithms. PLoS ONE 13, 1–23 (2018). · DOI
- Potapov, V., Cohen, M. & Schreiber, G. Assessing computational methods for predicting protein stability upon mutation: Good on average but not in the details. Protein Eng. Des. Sel. 22, 553–560 (2009). · DOI · Paper page
- Bromberg, Y. & Rost, B. Correlating protein function and stability through the analysis of single amino acid substitutions. BMC Bioinforma. 10, 1–9 (2009). · DOI
- Iqbal, S. et al. Comprehensive characterization of amino acid positions in protein structures reveals molecular effect of missense variants. Proc. Natl. Acad. Sci. 117, 28201–28211 (2020). · DOI
- Mi, H. et al. PANTHER version 16: A revised family classification, tree-based classification tool, enhancer regions and extensive API. Nucleic Acids Res. 49, D394–D403 (2021). · DOI · Paper page
- Backwell, L. & Marsh, J. A. Diverse molecular mechanisms underlying pathogenic protein mutations: Beyond the loss-of-function paradigm. Annu. Rev. Genomics Hum. Genet. 23, annurev-genom-111221-103208 (2022). · DOI
- Sevim Bayrak, C. et al. Identification of discriminative gene-level and protein-level features associated with pathogenic gain-of-function and loss-of-function variants. Am. J. Hum. Genet. 108, 2301–2318 (2021). · DOI
- Stenson, P. D. et al. Human Gene Mutation Database (HGMD®): 2003 update. Hum. Mutat. 21, 577–581 (2003). · DOI
- Li, X. H. & Babu, M. M. Human Diseases from Gain-of-Function Mutations in Disordered Protein Regions. Cell 175, 40–42 (2018). · DOI
- Witham, S., Takano, K., Schwartz, C. & Alexov, E. A missense mutation in CLIC2 associated with intellectual disability is predicted by in silico modeling to affect protein stability and dynamics. Proteins Struct. Funct. Bioinforma. 79, 2444–2454 (2011). · DOI
- Stefl, S., Nishi, H., Petukh, M., Panchenko, A. R. & Alexov, E. Molecular mechanisms of disease-causing missense mutations. J. Mol. Biol. 425, 3919–3936 (2013). · DOI
- Nishi, H. et al. Cancer Missense Mutations Alter Binding Properties of Proteins and Their Interaction Networks. PLoS One 8, e66273 (2013). · DOI
- Stein, A., Fowler, D. M., Hartmann-Petersen, R. & Lindorff-Larsen, K. Biophysical and Mechanistic Models for Disease-Causing Protein Variants. Trends Biochem. Sci. 44, 575–588 (2019). · DOI
- Cleary, M. A., Pendergrast, P. S. & Herr, W. Structural flexibility in transcription complex formation revealed by protein-DNA photocrosslinking. Proc. Natl Acad. Sci. 94, 8450–8455 (1997). · DOI
- Pan, Y., Tsai, C.-J., Ma, B. & Nussinov, R. Mechanisms of transcription factor selectivity. Trends Genet. 26, 75–83 (2010). · DOI
- Grimm, D. G. et al. The evaluation of tools used to predict the impact of missense variants is hindered by two types of circularity. Hum. Mutat. 36, 513–523 (2015). · DOI · Paper page
- Ng, P. C. SIFT: Predicting amino acid changes that affect protein function. Nucleic Acids Res. 31, 3812–3814 (2003). · DOI
- Riesselman, A. J., Ingraham, J. B. & Marks, D. S. Deep generative models of genetic variation capture the effects of mutations. Nat. Methods 15, 816–822 (2018). · DOI · Paper page
- Chen, J. W., Romero, P., Uversky, V. N. & Dunker, A. K. Conservation of intrinsic disorder in protein domains and families: I. A Database of Conserved Predicted Disordered Regions. J. Proteome Res. 5, 879–887 (2006). · DOI
- Lelieveld, S. H. et al. Spatial clustering of de novo missense mutations identifies candidate neurodevelopmental disorder-associated genes. Am. J. Hum. Genet. 101, 478–484 (2017). · DOI
- Sivley, R. M., Dou, X., Meiler, J., Bush, W. S. & Capra, J. A. Comprehensive analysis of constraint on the spatial distribution of missense variants in human protein structures. Am. J. Hum. Genet. 102, 415–426 (2018). · DOI
- Turner, T. N. et al. Proteins linked to autosomal dominant and autosomal recessive disorders harbor characteristic rare missense mutation distribution patterns. Hum. Mol. Genet. 24, 5995–6002 (2015). · DOI
- Stehr, H. et al. The structural impact of cancer-associated missense mutations in oncogenes and tumor suppressors. Mol. Cancer 10, 54 (2011). · DOI
- Mastrogiorgio, G. et al. Clinical and molecular characterization of patients with adenylosuccinate lyase deficiency. Orphanet J. Rare Dis. 16, 112 (2021). · DOI
- Hijikata, A., Tsuji, T., Shionyu, M. & Shirai, T. Decoding disease-causing mechanisms of missense mutations from supramolecular structures. Sci. Rep. 7, 1–8 (2017). · DOI
- Veitia, R. A. Exploring the molecular etiology of dominant-negative mutations. Plant Cell Online 19, 3843–3851 (2007). · DOI
- Chen, C.-H. et al. Novel and prevalent non-East Asian ALDH2 variants; Implications for global susceptibility to aldehydes’ toxicity. EBioMedicine 55, 102753 (2020). · DOI
- Prelich, G. Gene overexpression: Uses, mechanisms, and interpretation. Genetics 190, 841–854 (2012). · DOI
- De Baets, G., Van Doorn, L., Rousseau, F. & Schymkowitz, J. Increased Aggregation Is More Frequently Associated to Human Disease-Associated Mutations Than to Neutral Polymorphisms. PLOS Comput. Biol. 11, e1004374 (2015). · DOI
- Flanagan, S. E., Patch, A.-M. & Ellard, S. Using SIFT and Polyphen to predict loss-of-function and gain-of-function mutations. Genet. Test. Mol. Biomark. 14, 533–537 (2010). · DOI
- Rodrigues, C. H. M., Pires, D. E. V. & Ascher, D. B. DynaMut2: Assessing changes in stability and flexibility upon single and multiple point missense mutations. Protein Sci. 30, 60–69 (2021). · DOI
- Findlay, G. M. et al. Accurate classification of BRCA1 variants with saturation genome editing. Nature 562, 217–222 (2018). · DOI · Paper page
- Majithia, A. R. et al. Prospective functional classification of all possible missense variants in PPARG. Nat. Genet. 48, 1570–1575 (2016). · DOI · Paper page
- Nielsen, S. V., Hartmann-Petersen, R., Stein, A. & Lindorff-Larsen, K. Multiplexed assays reveal effects of missense variants in MSH2 and cancer predisposition. PLOS Genet 17, e1009496 (2021). · DOI
- Cagiada, M. et al. Understanding the origins of loss of protein function by analyzing the effects of thousands of variants on activity and abundance. Mol. Biol. Evol. 38, 3235–3246 (2021). · DOI
- Marneros, A. G. et al. Mutations in KCTD1 Cause Scalp-Ear-Nipple Syndrome. Am. J. Hum. Genet. 92, 621–626 (2013). · DOI
- Kumar, S. et al. Standardized, systemic phenotypic analysis reveals kidney dysfunction as main alteration of Kctd1 I27N mutant mice. J. Biomed. Sci. 24, 57 (2017). · DOI
- Hu, L. et al. KCTD1 mutants in scalp‑ear‑nipple syndrome and AP‑2α P59A in Char syndrome reciprocally abrogate their interactions, but can regulate Wnt/β‑catenin signaling. Mol. Med. Rep. https://doi.org/10.3892/mmr.2020.11457. (2020). · DOI
- Levy, E. D. A simple definition of structural regions in proteins and its use in analyzing interface evolution. J. Mol. Biol. 403, 660–670 (2010). · DOI · Paper page
- The UniProt Consortium. et al. UniProt: the universal protein knowledgebase in 2021. Nucleic Acids Res. 49, D480–D489 (2021). · DOI · Paper page
- Nightingale, A. et al. The Proteins API: Accessing key integrated protein and genome information. Nucleic Acids Res. 45, W539–W544 (2017). · DOI
- Liu, X., Li, C., Mou, C., Dong, Y. & Tu, Y. dbNSFP v4: a comprehensive database of transcript-specific functional predictions and annotations for human nonsynonymous and splice-site SNVs. Genome Med. 12, 103 (2020). · DOI
- Patil, I. Visualizations with statistical details: The ‘ggstatsplot’ approach. J. Open Source Softw. 6, 3167 (2021). · DOI
- Dunn, O. J. Multiple comparisons using rank sums. Technometrics 6, 241–252 (1964). · DOI
- Dinno, A. Nonparametric pairwise multiple comparisons in independent groups using Dunn’s Test. Stata J. Promot. Commun. Stat. Stata. 15, 292–300 (2015). · DOI
- Holm, S. A simple sequentially rejective multiple test procedure. Scand. J. Stat. 6, 65–70 (1979).
- Giacalone, M., Agata, Z., Cozzucoli, P. C. & Alibrandi, A. Bonferroni-Holm and permutation tests to compare health data: methodological and applicative issues. BMC Med. Res. Methodol. 18, 81 (2018). · DOI
- Greiner, M., Pfeiffer, D. & Smith, R. D. Principles and practical application of the receiver-operating characteristic analysis for diagnostic tests. Prev. Vet. Med. 45, 23–41 (2000). · DOI · Paper page
Cited by
Stein, D., Kars, M. E., Wu, Y., Bayrak, Ç. S., Stenson, P. D., Cooper, D. N., Schlessinger, A., & Itan, Y. (2023) · Genome Medicine · doi:10.1186/s13073-023-01261-9 · Cited by 53
Interpreting the molecular mechanisms of disease variants in human transmembrane proteins
Tiemann, J. K. S., Zschach, H., Lindorff-Larsen, K., & Stein, A. (2023) · Biophysical Journal · doi:10.1016/j.bpj.2022.12.031 · Cited by 35
Phenotypic complexities of rare heterozygous neurexin-1 deletions
Fernando, M. B., Fan, Y., Zhang, Y., Tokolyi, A., Murphy, A. N., Kammourh, S., Deans, P. J. M., Ghorbani, S., Onatzevitch, R., Pero, A., et al. (2025) · Nature · doi:10.1038/s41586-025-08864-9 · Cited by 30
Günaydin, C., Sondhi, D., Kaminsky, S. M., Lephart, H. C., Leopold, P. L., Hackett, N. R., Khanna, R., & Crystal, R. G. (2024) · Molecular Therapy · doi:10.1016/j.ymthe.2024.11.003 · Cited by 26
Metadata
- Authors
- Gerasimavicius, L., Livesey, B. J., & Marsh, J. A.
- Venue
- Nature Communications
- Published
- 2022-07-06
- Volume
- 13
- Issue
- 1
- ISSN
- 2041-1723
- PMC
- PMC9259657
- Cited by
- 338
- References
- 8
- Language
- en
About these checks
Registry, retraction, Cites and statistics results are computed, not judged, with one exception: a printed reference that no index lists is read once by a model before it counts as a citation error. Claims are extracted by a model and kept only when their quote appears verbatim in the text; each cited source is then checked, with a model’s help, for whether it says what the claim relies on. Those verdicts can be wrong — read the claim’s quote and the cited source before relying on one.
Statistics and arithmetic are recomputed, not judged.
Confidence bands are shown only for fields calibrated on our annotated test set. None is calibrated yet, so no band is shown.
What counts as a claim ›How we measure confidence ›How we check this ›
Are you an author, or do you see a problem with this page? Request a review
Data sources
Bibliographic data: Semantic Scholar, OpenAlex, Crossref.
Contains information from the Semantic Scholar Academic Graph Datasets, made available under the ODC Attribution License (ODC-BY 1.0).
Semantic Scholar’s data is described in: Kinney, R., et al. (2023). The Semantic Scholar Open Data Platform. arXiv:2301.10140.
