

The DOI matches its Crossref record; 41 of the 42 references it cites were found in a registry or an index; 17 of the 25 sources its claims cite were checked for support.
PRDM1/BLIMP1 induces cancer immune evasion by modulating the USP22-SPI1-PD-L1 axis in hepatocellular carcinoma cells
Open accessAbstract
Programmed death receptor-1 (PD-1) blockade have achieved some efficacy but only in a fraction of patients with hepatocellular carcinoma (HCC). Programmed cell death 1 ligand 1 (PD-L1) binds to its receptor PD1 on T cells to dampen antigen-tumor immune responses. However, the mechanisms underlying PD-L1 regulation are not fully elucidated. Herein, we identify that tumoral Prdm1 overexpression inhibits cell growth in immune-deficient mouse models. Further, tumoral Prdm1 overexpression upregulates PD-L1 levels, dampening anti-tumor immunity in vivo, and neutralizes the anti-tumor efficacy of Prdm1 overexpression in immune-competent mouse models. Mechanistically, PRDM1 enhances USP22 transcription, thus reducing SPI1 protein degradation through deubiquitination, which enhances PD-L1 transcription. Functionally, PD-1 mAb treatment reinforces the efficacy of Prdm1-overexpressing HCC immune-competent mouse models. Collectively, we demonstrate that the PRDM1-USP22-SPI1 axis regulates PD-L1 levels, resulting in infiltrated CD8+ T cell exhaustion. Furthermore, PRDM1 overexpression combined with PD-(L)1 mAb treatment provides a therapeutic strategy for HCC treatment.
Overview
AI snapshot
Written from the paper’s full text.
TL;DR
PRDM1/BLIMP1 promotes HCC immune evasion by transcriptionally inducing USP22, which deubiquitinates and stabilizes SPI1, increasing PD-L1 transcription and CD8+ T cell exhaustion. Combining Prdm1 overexpression with PD-1 mAb improves antitumor efficacy in mouse HCC models.
Key findings
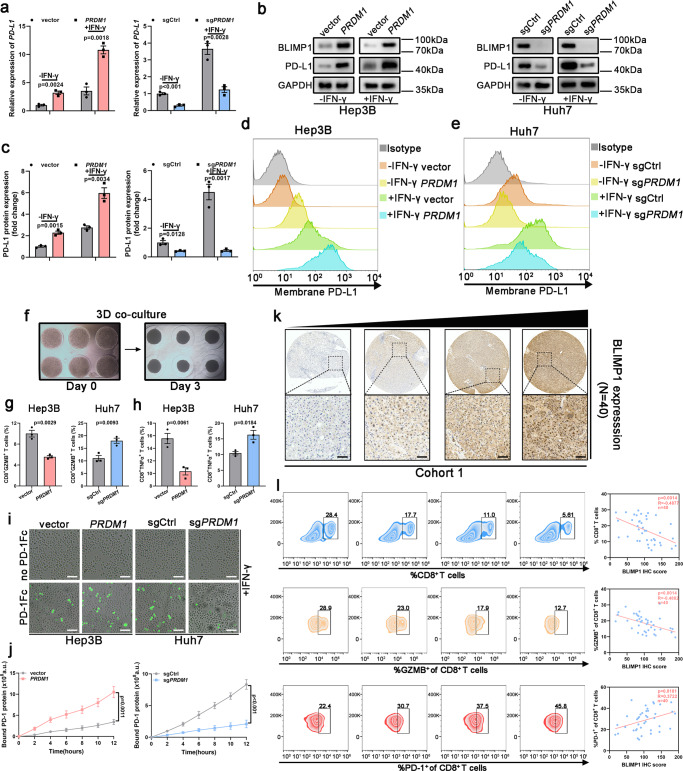
- PRDM1/BLIMP1 upregulates PD-L1 in HCC cells; in cohort 1 (40 patients with HCC), tumoral BLIMP1 was inversely correlated with CD8+ T cells (R = −0.4877, P = 0.0014) and GZMB+ CD8+ T cells (R = −0.4882, P = 0.0014), and positively correlated with PD1+ exhausted CD8+ TILs (R = 0.3722, P = 0.0181).
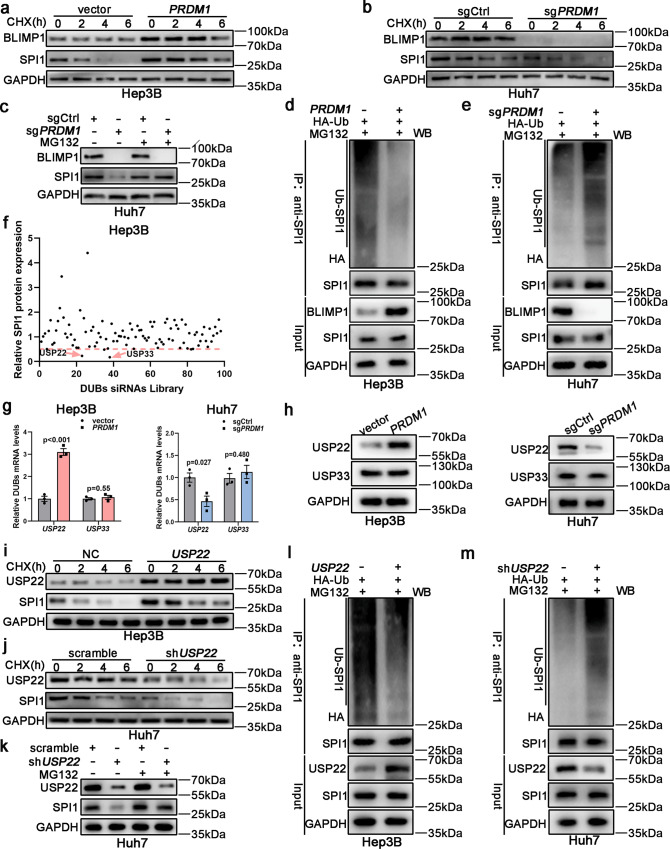
- Mechanistically, PRDM1 enhances USP22 transcription; a DUB siRNA library among 98 known human DUBs found that USP22 and USP33 suppression decreased SPI1 protein by more than 50%. USP22 deubiquitinates SPI1, and SPI1 binds PD-L1 promoter sites SBS 3 and 4 to enhance PD-L1 transcription.
- In immune-competent mice, Prdm1 overexpression alone did not reduce tumor size or overall survival but reduced infiltrated CD8+ T cells and their GZMB+ activity and increased PD-1+ exhaustion; in immunodeficient mice, Prdm1 overexpression slowed tumor growth and prolonged survival. PD-1 mAb plus Prdm1 overexpression further impaired tumor proliferation and prolonged survival versus either alone (n = 6 mice per group).
- In cohort 2 (90 patients with HCC), BLIMP1, USP22, and SPI1 were positively associated with PD-L1 and negatively associated with CD8+ T cell infiltration; scRNA-seq of 8,277 cells from two patients showed that the PRDM1-high tumor had more CD8+LAG3+ exhausted T cells and CD4+FOXP3+ Tregs.
Methods
- Human Hep3B/Huh7 and murine Hepa1-6/H22 HCC cells were used with PRDM1/Prdm1 overexpression or CRISPR knockout; assays included qRT-PCR, western blotting, flow cytometry, 3D co-culture, T cell-mediated killing, PD1 binding, luciferase reporter, ChIP, co-IP/mass spectrometry, TMT proteomics, and a DUB siRNA library.
- Mouse models used immune-competent C57BL/6 and immunodeficient BALB/c nude mice with subcutaneous or orthotopic tumors, plus a DEN/CCl4-induced HCC model; treatments included PD-1 mAb, IgG control, CD8α mAb, and AAV8-Prdm1, with n = 6 mice per group in tumor/survival experiments.
- Clinical samples included cohort 1 (40 fresh HCC tissues), cohort 2 (90 paired HCC and adjacent normal tissues), and cohort 3 (22 HCC biopsies before PD-1 mAb-based therapy); scRNA-seq analyzed 8,277 cells from two patients. Statistical analyses used Student’s t test, Pearson correlation, and Kaplan–Meier/log-rank methods.
Limitations
- Stated: the authors could not fully exclude that PRDM1 may also influence SPI1 protein stability through a specific E3 ligase; the mechanism separating PRDM1/BLIMP1’s growth-inhibitory and immune-evasion effects needs further investigation; and ideal therapeutic vectors such as AAV carrying PRDM1 still need safety and efficacy evaluation.
- Evident: the scRNA-seq analysis included only two patients; the clinical cohorts came from a single center; and the proposed PRDM1 overexpression plus PD-(L)1 combination was tested in preclinical models, not in a human trial.
Model-written summary. Check it against the paper before relying on it.
Integrity signals
Registry
Cites
Statistics
Figures
Verification
Claims the paper makes
112 Own result · 29 Own interpretation · 7 Own method · 4 Partly supported · 2 Supported so far · 2 No basis given · 1 Supported · 1 No full text of the sources · accuracy not yet measured
The sources with a verdict support this claim; the rest weren’t checked yet, have no full text we could read, or their verdicts aren’t rated yet.
In the paper
“However, most patients, especially patients with HCC, are unresponsive to the blockade of the PD-1/PD-L1 axis5,6.”
§ PRDM1/BLIMP1 induces cancer immune evasion by modulating the USP22-SPI1-PD-L1 axis in hepatocellular carcinoma cells > Introduction
What the sources say
- Supportedcites [5] Sangro, B. et al. Association of inflammatory biomarkers with clinical outcomes in nivolumab-treated patients with advanced hepatocellular carcinoma. J. Hepatol. 73, 1460–1469 (2020). source
In Results (“BOR by PD-L1 and PD-1 status”; page not provided), 34 nivolumab-treated patients with advanced HCC had a complete or partial response, versus 71 with stable disease and 73 with progressive disease. Thus, most patients in the reported cohort did not have an objective response to PD-1 blockade. The evidence concerns advanced HCC treated with nivolumab, not every PD-1/PD-L1 therapy. (LLM, conf=0.90)
- Not checked — no full text of the sourcecites [6] Yang, W. et al. A selective HDAC8 inhibitor potentiates antitumor immunity and efficacy of immune checkpoint blockade in hepatocellular carcinoma. Sci. Transl. Med. 13, eaaz6804 (2021). source
plain- Asserted: passes — The authors put it forward as true.
- Checkable: passes — It can be checked against evidence.
- Load-bearing: passes — The paper’s conclusions depend on it.
- Based: passes — The paper gives a reason why it holds.
- Supported
The cited sources support only part of this claim — read each source’s verdict below.
In the paper
“In addition, tumoral PD-L1 expression alone is not a reliable predictive biomarker of immunotherapy in most patients with HCC5.”
§ PRDM1/BLIMP1 induces cancer immune evasion by modulating the USP22-SPI1-PD-L1 axis in hepatocellular carcinoma cells > Introduction
What the sources say
- Partly supportedcites [5] Sangro, B. et al. Association of inflammatory biomarkers with clinical outcomes in nivolumab-treated patients with advanced hepatocellular carcinoma. J. Hepatol. 73, 1460–1469 (2020). sourceExperimental — accuracy not yet measured
The Discussion reports responses and changes in target-lesion size regardless of tumour PD-L1 expression, concluding that PD-L1 expression alone may not be an adequate biomarker. That is tentative evidence from nivolumab-treated patients with advanced HCC; it does not establish the claim's definitive conclusion about immunotherapy in most patients with HCC. (LLM, conf=0.86)
plain- Asserted: passes — The authors put it forward as true.
- Checkable: passes — It can be checked against evidence.
- Load-bearing: passes — The paper’s conclusions depend on it.
- Based: passes — The paper gives a reason why it holds.
- Partly supported
A result the paper reports from its own data — it cites no other source for it, so there is none to check. The quote shows it is in the paper.
In the paper
“PRDM1 upregulation impaired the CD8+ T cell activation (CD8+GZMB+ T cells) and T cell-mediated tumor cell killing activity (CD8+TNFα+ T cells) in the co-culture”
§ PRDM1/BLIMP1 induces cancer immune evasion by modulating the USP22-SPI1-PD-L1 axis in hepatocellular carcinoma cells > Results > PRDM1/BLIMP1 is a prominent regulator of PD-L1 in HCC
plaindirect- Asserted: passes — The authors put it forward as true.
- Checkable: passes — It can be checked against evidence.
- Load-bearing: passes — The paper’s conclusions depend on it.
- Based: passes — The paper gives a reason why it holds.
A result the paper reports from its own data — it cites no other source for it, so there is none to check. The quote shows it is in the paper.
In the paper
“Among these, PRDM1 showed the highest correlation with PD-L1 expression (Supplementary Fig. 1a).”
§ PRDM1/BLIMP1 induces cancer immune evasion by modulating the USP22-SPI1-PD-L1 axis in hepatocellular carcinoma cells > Results > PRDM1/BLIMP1 is a prominent regulator of PD-L1 in HCC
plaincorrelational- Asserted: passes — The authors put it forward as true.
- Checkable: passes — It can be checked against evidence.
- Load-bearing: passes — The paper’s conclusions depend on it.
- Based: passes — The paper gives a reason why it holds.
A result the paper reports from its own data — it cites no other source for it, so there is none to check. The quote shows it is in the paper.
In the paper
“whereas PRDM1 knockout had contrasting effects (Fig. 1g, h).”
§ PRDM1/BLIMP1 induces cancer immune evasion by modulating the USP22-SPI1-PD-L1 axis in hepatocellular carcinoma cells > Results > PRDM1/BLIMP1 is a prominent regulator of PD-L1 in HCC
plaindirect- Asserted: passes — The authors put it forward as true.
- Checkable: passes — It can be checked against evidence.
- Load-bearing: passes — The paper’s conclusions depend on it.
- Based: passes — The paper gives a reason why it holds.
A result the paper reports from its own data — it cites no other source for it, so there is none to check. The quote shows it is in the paper.
In the paper
“PD-L1 upregulation at both mRNA and total and cell surface protein levels after PRDM1 overexpression was confirmed in PRDM1-overexpressing Hep3B cells, with or without IFN-γ stimulation”
§ PRDM1/BLIMP1 induces cancer immune evasion by modulating the USP22-SPI1-PD-L1 axis in hepatocellular carcinoma cells > Results > PRDM1/BLIMP1 is a prominent regulator of PD-L1 in HCC
plaindirect- Asserted: passes — The authors put it forward as true.
- Checkable: passes — It can be checked against evidence.
- Load-bearing: passes — The paper’s conclusions depend on it.
- Based: passes — The paper gives a reason why it holds.
A result the paper reports from its own data — it cites no other source for it, so there is none to check. The quote shows it is in the paper.
In the paper
“and the opposite effect was observed in PRDM1-knockout Huh7 cells (Fig. 1a–e).”
§ PRDM1/BLIMP1 induces cancer immune evasion by modulating the USP22-SPI1-PD-L1 axis in hepatocellular carcinoma cells > Results > PRDM1/BLIMP1 is a prominent regulator of PD-L1 in HCC
plaindirect- Asserted: passes — The authors put it forward as true.
- Checkable: passes — It can be checked against evidence.
- Load-bearing: passes — The paper’s conclusions depend on it.
- Based: passes — The paper gives a reason why it holds.
A result the paper reports from its own data — it cites no other source for it, so there is none to check. The quote shows it is in the paper.
In the paper
“PRDM1, PRDM2, PRDM3, PRDM4, PRDM5, PRDM6, PRDM8, PRDM10, PRDM11, and PRDM13 were identified as PD-L1 expression regulators.”
§ PRDM1/BLIMP1 induces cancer immune evasion by modulating the USP22-SPI1-PD-L1 axis in hepatocellular carcinoma cells > Results > PRDM1/BLIMP1 is a prominent regulator of PD-L1 in HCC
plaincorrelational- Asserted: passes — The authors put it forward as true.
- Checkable: passes — It can be checked against evidence.
- Load-bearing: passes — The paper’s conclusions depend on it.
- Based: passes — The paper gives a reason why it holds.
A result the paper reports from its own data — it cites no other source for it, so there is none to check. The quote shows it is in the paper.
In the paper
“PRDM1 upregulation impaired the CD8+ T cell activation (CD8+GZMB+ T cells) and T cell-mediated tumor cell killing activity (CD8+TNFα+ T cells) in the co-culture”
§ PRDM1/BLIMP1 induces cancer immune evasion by modulating the USP22-SPI1-PD-L1 axis in hepatocellular carcinoma cells > Results > PRDM1/BLIMP1 is a prominent regulator of PD-L1 in HCC
plaindirect- Asserted: passes — The authors put it forward as true.
- Checkable: passes — It can be checked against evidence.
- Load-bearing: passes — The paper’s conclusions depend on it.
- Based: passes — The paper gives a reason why it holds.
A result the paper reports from its own data — it cites no other source for it, so there is none to check. The quote shows it is in the paper.
In the paper
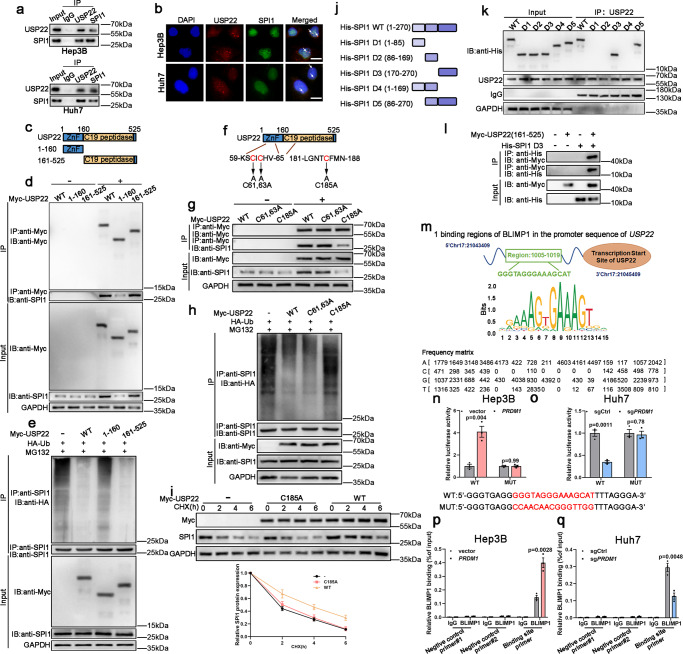
“following CHX treatment, USP22 overexpression significantly attenuated SPI1 degradation”
§ PRDM1/BLIMP1 induces cancer immune evasion by modulating the USP22-SPI1-PD-L1 axis in hepatocellular carcinoma cells > Results > USP22 inhibits ubiquitin-mediated proteasomal degradation of SPI1
plaindirect- Asserted: passes — The authors put it forward as true.
- Checkable: passes — It can be checked against evidence.
- Load-bearing: passes — The paper’s conclusions depend on it.
- Based: passes — The paper gives a reason why it holds.
- Probably not a substantial claim. 13
- It may state two separate claims as one. 19
- The quote only partly states this claim. 1
The sources with a verdict support this claim; the rest weren’t checked yet, have no full text we could read, or their verdicts aren’t rated yet.
In the paper
“Programmed death ligand 1 (PD-L1, namely CD274) is widely expressed in various malignancies”
§ PRDM1/BLIMP1 induces cancer immune evasion by modulating the USP22-SPI1-PD-L1 axis in hepatocellular carcinoma cells > Introduction
What the sources say
- Supportedcites [1] Papalexi, E. et al. Characterizing the molecular regulation of inhibitory immune checkpoints with multimodal single-cell screens. Nat. Genet. 53, 322–331 (2021). source
The Introduction (page not provided) identifies CD274 as PD-L1 and states that it is overexpressed in many cancers. This supports the claim that PD-L1 is widely expressed across malignancies. (LLM, conf=0.92)
- Not checked — no full text of the sourcecites [2] Yu, M. et al. Interferon-gamma induces tumor resistance to anti-PD-1 immunotherapy by promoting YAP phase separation. Mol. cell 81, 1216.e9–1230.e9 (2021). source
- Not checked — no full text of the sourcecites [3] Pinato, D. J., Fessas, P., Sapisochin, G. & Marron, T. U. Perspectives on the neoadjuvant use of immunotherapy in hepatocellular carcinoma. Hepatology 74, 483–490 (2021). source
- Supportedcites [4] Li, Z. et al. Clinical benefit of neoadjuvant anti-PD-1/PD-L1 utilization among different tumors. MedComm 2, 60–68 (2021). source
The Discussion states that PD-L1 is constitutively upregulated in various tumors, including melanoma, non-small-cell lung cancer, and head and neck squamous cell carcinoma. The Methods search strategy also identifies CD274 as a term for PD-L1. Page numbers are not available in the supplied passages. (LLM, conf=0.91)
plain- Asserted: passes — The authors put it forward as true.
- Checkable: passes — It can be checked against evidence.
- Load-bearing: fails — The paper’s conclusions may not depend on it.
- Based: passes — The paper gives a reason why it holds.
Probably not a substantial claim. The paper’s conclusions may not depend on it.
- Supported
The cited sources support only part of this claim — read each source’s verdict below.
In the paper
“induces immune evasion by targeting its ligand, programmed cell death 1 (PD-1) on activated T cells, resulting in T cell exhaustion1–4.”
§ PRDM1/BLIMP1 induces cancer immune evasion by modulating the USP22-SPI1-PD-L1 axis in hepatocellular carcinoma cells > Introduction
What the sources say
- Partly supportedcites [1] Papalexi, E. et al. Characterizing the molecular regulation of inhibitory immune checkpoints with multimodal single-cell screens. Nat. Genet. 53, 322–331 (2021). sourceExperimental — accuracy not yet measured
The Introduction (page unavailable) says PD-L1 interacts with the PD-1 receptor on T cells to inhibit T-cell activation, and the Results (page unavailable) say cancer cells up-regulate PD-L1 to escape immune surveillance. Our copy does not specify activated T cells or say that this interaction results in T-cell exhaustion; a search for exhaustion found no supporting passage. (LLM, conf=0.88)
- Not checked — no full text of the sourcecites [2] Yu, M. et al. Interferon-gamma induces tumor resistance to anti-PD-1 immunotherapy by promoting YAP phase separation. Mol. cell 81, 1216.e9–1230.e9 (2021). source
- Not checked — no full text of the sourcecites [3] Pinato, D. J., Fessas, P., Sapisochin, G. & Marron, T. U. Perspectives on the neoadjuvant use of immunotherapy in hepatocellular carcinoma. Hepatology 74, 483–490 (2021). source
- Partly supportedcites [4] Li, Z. et al. Clinical benefit of neoadjuvant anti-PD-1/PD-L1 utilization among different tumors. MedComm 2, 60–68 (2021). sourceExperimental — accuracy not yet measured
The Introduction (page not provided) says PD-L1 binds PD-1 on T cells, suppresses their activity, and enhances tumor immune escape. The Discussion (page not provided) identifies activated T cells as expressing PD-1. Neither passage says this interaction results in T-cell exhaustion, so that part of the claim is not supported by our copy. (LLM, conf=0.87)
plaindirect- Asserted: passes — The authors put it forward as true.
- Checkable: passes — It can be checked against evidence.
- Load-bearing: passes — The paper’s conclusions depend on it.
- Based: passes — The paper gives a reason why it holds.
Probably not a substantial claim.
- Partly supported
The cited sources support only part of this claim — read each source’s verdict below.
In the paper
“Moreover, several critical proteins including CMTM4, CMTM6, GSK3β, CSN5, CDK4, CDK6, and palmitoylated B3GNT3 have been shown to affect post-translational PD-L1 stability31–36.”
§ PRDM1/BLIMP1 induces cancer immune evasion by modulating the USP22-SPI1-PD-L1 axis in hepatocellular carcinoma cells > Discussion
What the sources say
- Supportedcites [31] Mezzadra, R. et al. Identification of CMTM6 and CMTM4 as PD-L1 protein regulators. Nature 549, 106–110 (2017). source
The paper’s Abstract identifies CMTM4 and CMTM6 as regulators of PD-L1 protein stability. This paper is one of citations 31–36, so its support is assessed for CMTM4 and CMTM6, not for every protein in the list. No page number is provided in our copy. (LLM, conf=0.92)
- Not checked — no full text of the sourcecites [32] Visan, I. CMTM6 controls PD-L1. Nat. Immunol. 18, 1067 (2017). source
- Supportedcites [33] Burr, M. L. et al. CMTM6 maintains the expression of PD-L1 and regulates anti-tumour immunity. Nature 549, 101–105 (2017). source
This paper supports the CMTM6 portion of the multi-citation claim. Its main text reports accelerated degradation of PD-L1 after CMTM6 knockout, and Extended Data Figure 7 describes selective destabilisation of PD-L1 when CMTM6 is lost. No page number is available in our copy. (LLM, conf=0.90)
- Not checked — no full text of the sourcecites [34] Borden, B. A. et al. The landscape of glycogen synthase kinase-3 beta genomic alterations in cancer. Mol. Cancer Ther. 20, 183–190 (2021). source
- Supportedcites [35] Lim, S. O. et al. Deubiquitination and stabilization of PD-L1 by CSN5. Cancer Cell 30, 925–939 (2016). source
This source supports the CSN5 part of the multiply cited list. In Results, under “TNF-α Upregulates CSN5 Expression to Stabilize PD-L1,” CSN5 downregulation shortened PD-L1 protein half-life, while wild-type CSN5 overexpression stabilized PD-L1. (LLM, conf=0.93)
- Partly supportedcites [36] Zhang, J. et al. Cyclin D-CDK4 kinase destabilizes PD-L1 via cullin 3-SPOP to control cancer immune surveillance. Nature 553, 91–95 (2018). sourceExperimental — accuracy not yet measured
The SUMMARY (page not provided) shows that CDK4 affects PD-L1 protein abundance and that CDK4/6 inhibitors increase its stability. It also reports that CDK6 depletion did not increase PD-L1; this paper therefore does not support listing CDK6 as an independently demonstrated regulator. The other listed proteins are not established by this paper’s findings. (LLM, conf=0.89)
plaindirect- Asserted: passes — The authors put it forward as true.
- Checkable: passes — It can be checked against evidence.
- Load-bearing: fails — The paper’s conclusions may not depend on it.
- Based: passes — The paper gives a reason why it holds.
Probably not a substantial claim. The paper’s conclusions may not depend on it.
- Supported
The cited sources support only part of this claim — read each source’s verdict below.
In the paper
“Various critical transcription factors, including HIF-1α, c-MYC, NF-kB, STAT3, c-JUN, and miR-138-5p have been shown to transcriptionally regulate PD-L1 expression25–30.”
§ PRDM1/BLIMP1 induces cancer immune evasion by modulating the USP22-SPI1-PD-L1 axis in hepatocellular carcinoma cells > Discussion
What the sources say
- Partly supportedcites [25] Wang, J. et al. LncRNA NUTM2A-AS1 positively modulates TET1 and HIF-1A to enhance gastric cancer tumorigenesis and drug resistance by sponging miR-376a. Cancer Med. 9, 9499–9510 (2020). sourceExperimental — accuracy not yet measured
The Results section ('TET1 interacts with HIF-1A to regulate PD-L1'; page unavailable) reports that HIF-1A enhanced PD-L1 expression in gastric cancer cells. The copy does not establish PD-L1 regulation by the other listed factors—c-MYC, NF-kB, STAT3, c-JUN, or miR-138-5p—so it supports only the HIF-1α part of the sentence. (LLM, conf=0.88)
- Supportedcites [26] Casey, S. C. et al. MYC regulates the antitumor immune response through CD47 and PD-L1. Science 352, 227–231 (2016). source
The cited paper supports the c-MYC portion of the multi-citation claim. In the passage labeled Abstract (no page number provided), it reports that MYC binds the PD-L1 gene promoter and directly regulates its expression. (LLM, conf=0.93)
- Could not verifycites [27] Gu, S. S. et al. Therapeutically increasing MHC-I expression potentiates immune checkpoint blockade. Cancer Discov. 11, 1524–1541 (2021). sourceExperimental — accuracy not yet measured
The Introduction (page unavailable) says IFNγ induces PD-L1, but does not identify the listed factors as its transcriptional regulators. The Results section on TRAF3 depletion discusses NF-κB regulation of MHC-I and reports no change in PD-L1 transcription after TRAF3 knockout. Searches for the listed factors and PD-L1 transcriptional regulation found no passage establishing the attributed claim. (LLM, conf=0.76)
- Supportedcites [28] Song, T. L. et al. Oncogenic activation of the STAT3 pathway drives PD-L1 expression in natural killer/T-cell lymphoma. Blood 132, 1146–1158 (2018). source
This paper supports the STAT3 portion of the list of regulators cited collectively as references 25–30. In “STAT3 activation directly drives PD-L1 expression in NKTL,” the authors report increased STAT3 occupancy at the PD-L1 promoter and link it to increased transcriptional activity and PD-L1 expression. No page number is available in our copy. (LLM, conf=0.91)
- Supportedcites [29] Cui, L. et al. Activation of JUN in fibroblasts promotes pro-fibrotic programme and modulates protective immunity. Nat. Commun. 11, 2795 (2020). source
The Results section, “JUN controls pro-fibrotic and immune-checkpoint genes” (page not provided), reports JUN binding at a PD-L1 enhancer and increased PD-L1 RNA and protein after JUN overexpression in lung fibroblasts. This supports the c-JUN portion of the multi-citation sentence; the paper is not needed to support the other factors listed. (LLM, conf=0.91)
- Partly supportedcites [30] Song, N. et al. MicroRNA-138-5p suppresses non-small cell lung cancer cells by targeting PD-L1/PD-1 to regulate tumor microenvironment. Front. Cell Dev. Biol. 8, 540 (2020). sourceExperimental — accuracy not yet measured
The Results section reports that miR-138-5p targets and down-regulates PD-L1, supporting its inclusion as a regulator. But the same section reports no significant change in PD-L1 gene expression despite lower protein expression, while the Introduction describes microRNAs as acting through mRNA degradation or translation inhibition. The paper therefore does not support calling miR-138-5p a transcription factor or saying it transcriptionally regulates PD-L1; it does not establish the other listed factors. (LLM, conf=0.88)
plaindirect- Asserted: passes — The authors put it forward as true.
- Checkable: passes — It can be checked against evidence.
- Load-bearing: fails — The paper’s conclusions may not depend on it.
- Based: passes — The paper gives a reason why it holds.
Probably not a substantial claim. The paper’s conclusions may not depend on it.
- Partly supported
Every source the paper cites for this claim was checked and supports it.
In the paper
“Supporting this view, a recent study revealed that USP22 could regulate PD-L1 expression in a direct and indirect way37.”
§ PRDM1/BLIMP1 induces cancer immune evasion by modulating the USP22-SPI1-PD-L1 axis in hepatocellular carcinoma cells > Discussion
What the sources say
- Supportedcites [37] Wang, Y. et al. The deubiquitinase USP22 regulates PD-L1 degradation in human cancer cells. Cell Commun. Signal. 18, 112 (2020). source
The Conclusions explicitly describe two routes by which USP22 regulates PD-L1 protein levels: direct deubiquitination of PD-L1 and an indirect route through the USP22–CSN5–PD-L1 axis. The Background states the same distinction, supporting the citing sentence’s paraphrase. (LLM, conf=0.95)
hedgeddirect- Asserted: passes — The authors put it forward as true.
- Checkable: passes — It can be checked against evidence.
- Load-bearing: fails — The paper’s conclusions may not depend on it.
- Based: passes — The paper gives a reason why it holds.
Probably not a substantial claim. The paper’s conclusions may not depend on it.
- Supported
A result the paper reports from its own data — it cites no other source for it, so there is none to check. The quote shows it is in the paper.
In the paper
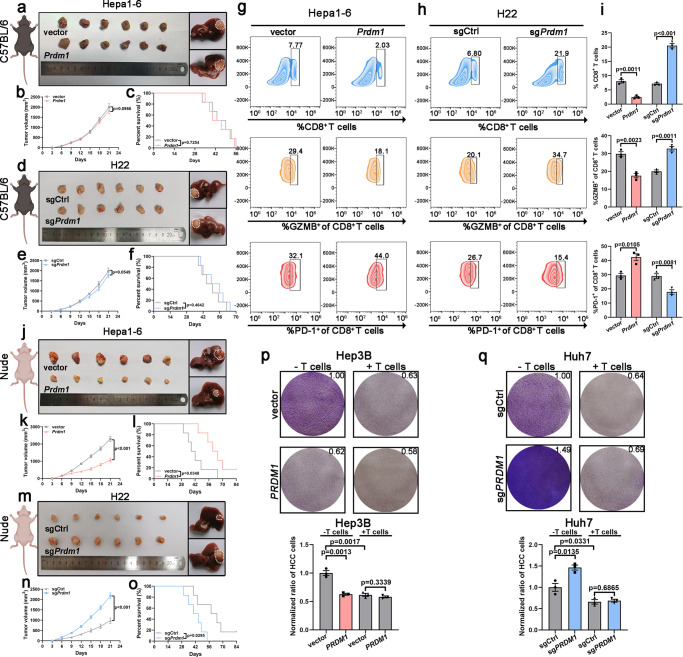
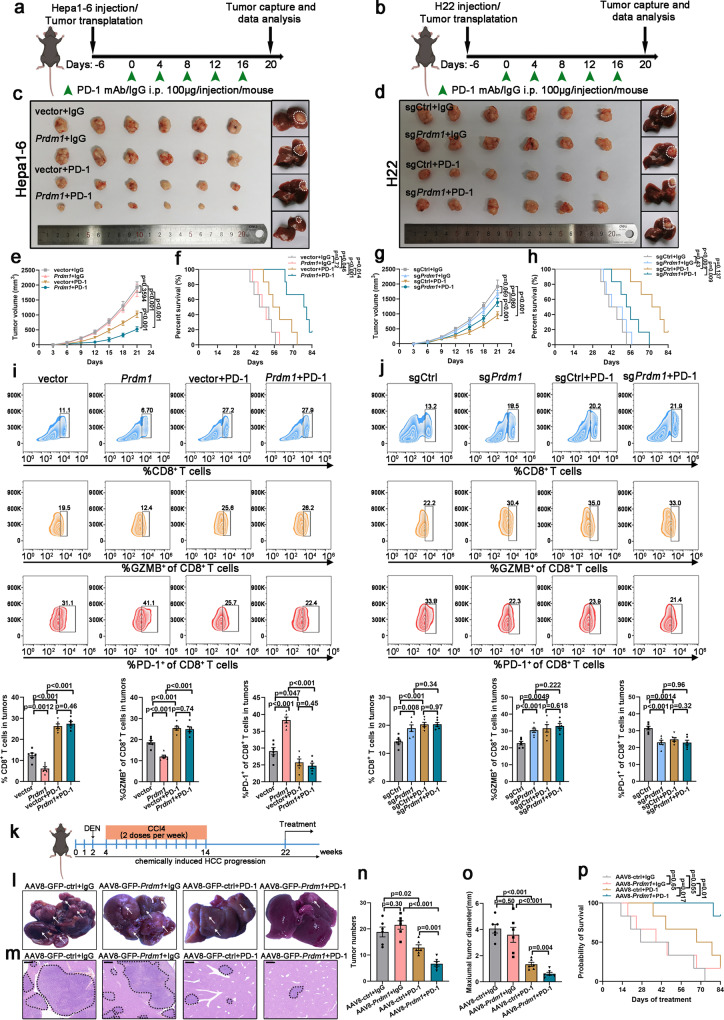
“Infiltrated CD8+ T cells and the activity (GZMB+) of infiltrated CD8+ T cells was obviously increased, and infiltrated CD8+ T cell exhaustion was significantly reduced in the sgPrdm1 groups (Fig. 2g–i).”
§ PRDM1/BLIMP1 induces cancer immune evasion by modulating the USP22-SPI1-PD-L1 axis in hepatocellular carcinoma cells > Results > Prdm1 promotes immune evasion by upregulating PD-L1 expression in immune-competent mice and HCC cells
plaincorrelational- Asserted: passes — The authors put it forward as true.
- Checkable: passes — It can be checked against evidence.
- Load-bearing: passes — The paper’s conclusions depend on it.
- Based: passes — The paper gives a reason why it holds.
It may state two separate claims as one.
A result the paper reports from its own data — it cites no other source for it, so there is none to check. The quote shows it is in the paper.
In the paper
“Further, site-directed mutagenesis abolished the increased promoter activity in Hep3B cells with PRDM1 overexpression and the decreased promoter activity in PRDM1-knockout Huh7 cells (Fig. 5n, o).”
§ PRDM1/BLIMP1 induces cancer immune evasion by modulating the USP22-SPI1-PD-L1 axis in hepatocellular carcinoma cells > Results > PRDM1/BLIMP1 regulates USP22 transcription
plaindirect- Asserted: passes — The authors put it forward as true.
- Checkable: passes — It can be checked against evidence.
- Load-bearing: passes — The paper’s conclusions depend on it.
- Based: passes — The paper gives a reason why it holds.
It may state two separate claims as one.
A result the paper reports from its own data — it cites no other source for it, so there is none to check. The quote shows it is in the paper.
In the paper
“The results revealed that Prdm1 overexpression in immune-competent mice inhibited tumor proliferation and that Prdm1 knockout contributed to tumor proliferation (Supplementary Fig. 3i–n).”
§ PRDM1/BLIMP1 induces cancer immune evasion by modulating the USP22-SPI1-PD-L1 axis in hepatocellular carcinoma cells > Results > Prdm1 promotes immune evasion by upregulating PD-L1 expression in immune-competent mice and HCC cells
plaindirect- Asserted: passes — The authors put it forward as true.
- Checkable: passes — It can be checked against evidence.
- Load-bearing: passes — The paper’s conclusions depend on it.
- Based: passes — The paper gives a reason why it holds.
The quote only partly states this claim.
A result the paper reports from its own data — it cites no other source for it, so there is none to check. The quote shows it is in the paper.
In the paper
“Meanwhile, patients with high tumoral BLIMP1 protein expression showed significant tumor shrinkage after treatment, whereas patients with low tumoral BLIMP1 protein expression showed tumor progression after treatment (Supplementary Fig. 9c, d).”
§ PRDM1/BLIMP1 induces cancer immune evasion by modulating the USP22-SPI1-PD-L1 axis in hepatocellular carcinoma cells > Results > Single-cell analysis of intra-tumoral immune cell populations confirmed that PRDM1 overexpression potentiates T cell exhaustion
plaincorrelational- Asserted: passes — The authors put it forward as true.
- Checkable: passes — It can be checked against evidence.
- Load-bearing: passes — The paper’s conclusions depend on it.
- Based: passes — The paper gives a reason why it holds.
It may state two separate claims as one.
A result the paper reports from its own data — it cites no other source for it, so there is none to check. The quote shows it is in the paper.
In the paper
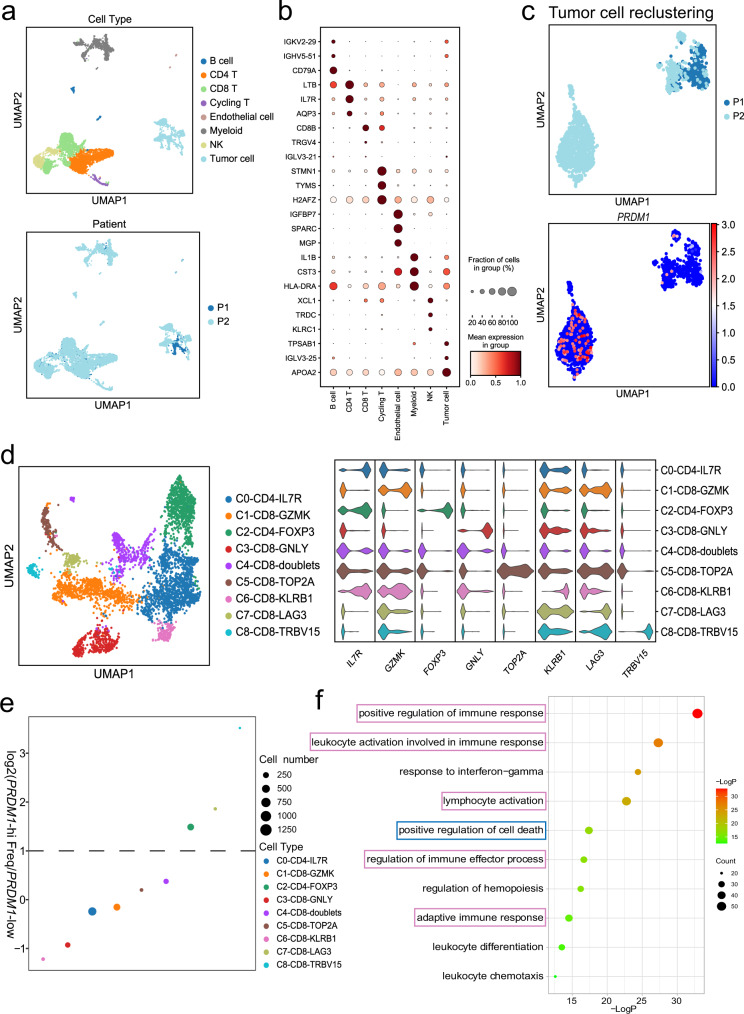
“We noticed that CD8+ cytotoxic T cell subpopulations were predominant in patient 1, who showed low expression of PRDM1 in tumor cells, whereas patient 2 showed a higher percentage of CD8+LAG3+ exhausted T cells and CD4+FOXP3+ Tregs, supporting the notion that PRDM1 overexpression potentiates T cell exhaustion (Fig. 8e).”
§ PRDM1/BLIMP1 induces cancer immune evasion by modulating the USP22-SPI1-PD-L1 axis in hepatocellular carcinoma cells > Results > Single-cell analysis of intra-tumoral immune cell populations confirmed that PRDM1 overexpression potentiates T cell exhaustion
plaincorrelational- Asserted: passes — The authors put it forward as true.
- Checkable: passes — It can be checked against evidence.
- Load-bearing: passes — The paper’s conclusions depend on it.
- Based: passes — The paper gives a reason why it holds.
It may state two separate claims as one.
A result the paper reports from its own data — it cites no other source for it, so there is none to check. The quote shows it is in the paper.
In the paper
“Flow cytometry analysis and IF staining confirmed that co-treatment with Prdm1 knockout and PD-1 displayed comparable percentages of infiltrated CD8+ T cells, activities (GZMB+) of infiltrated CD8+ T cells, and exhaustion of infiltrated CD8+ T cells compared with those in Prdm1 knockout alone (Fig. 6j and Supplementary Fig. 7d–f).”
§ PRDM1/BLIMP1 induces cancer immune evasion by modulating the USP22-SPI1-PD-L1 axis in hepatocellular carcinoma cells > Results > Prdm1 overexpression increases the efficacy of PD-1 mAb therapy in mice
plain- Asserted: passes — The authors put it forward as true.
- Checkable: passes — It can be checked against evidence.
- Load-bearing: passes — The paper’s conclusions depend on it.
- Based: passes — The paper gives a reason why it holds.
It may state two separate claims as one.
A result the paper reports from its own data — it cites no other source for it, so there is none to check. The quote shows it is in the paper.
In the paper
“Our preclinical animal experiments including subcutaneous tumor models, orthotopic tumor models, and the DEN-induced HCC model, validated the synergistic effect of Prdm1 overexpression and PD-1 mAb treatment, in terms of a distinct reduction in tumor size/number and extended overall survival, which was attributed to the reinforcement of TILs in the tumors.”
§ PRDM1/BLIMP1 induces cancer immune evasion by modulating the USP22-SPI1-PD-L1 axis in hepatocellular carcinoma cells > Discussion
boosteddirect- Asserted: passes — The authors put it forward as true.
- Checkable: passes — It can be checked against evidence.
- Load-bearing: passes — The paper’s conclusions depend on it.
- Based: passes — The paper gives a reason why it holds.
It may state two separate claims as one.
A result the paper reports from its own data — it cites no other source for it, so there is none to check. The quote shows it is in the paper.
In the paper
“Here, we found that PRDM1-overexpressing HCC cells upregulated PD-L1 expression and inhibited T cell-mediated anti-tumor immunity, thus dampening its role as a tumor growth suppressor in immunocompetent mice.”
§ PRDM1/BLIMP1 induces cancer immune evasion by modulating the USP22-SPI1-PD-L1 axis in hepatocellular carcinoma cells > Discussion
plaindirect- Asserted: passes — The authors put it forward as true.
- Checkable: passes — It can be checked against evidence.
- Load-bearing: passes — The paper’s conclusions depend on it.
- Based: passes — The paper gives a reason why it holds.
It may state two separate claims as one.
A result the paper reports from its own data — it cites no other source for it, so there is none to check. The quote shows it is in the paper.
In the paper
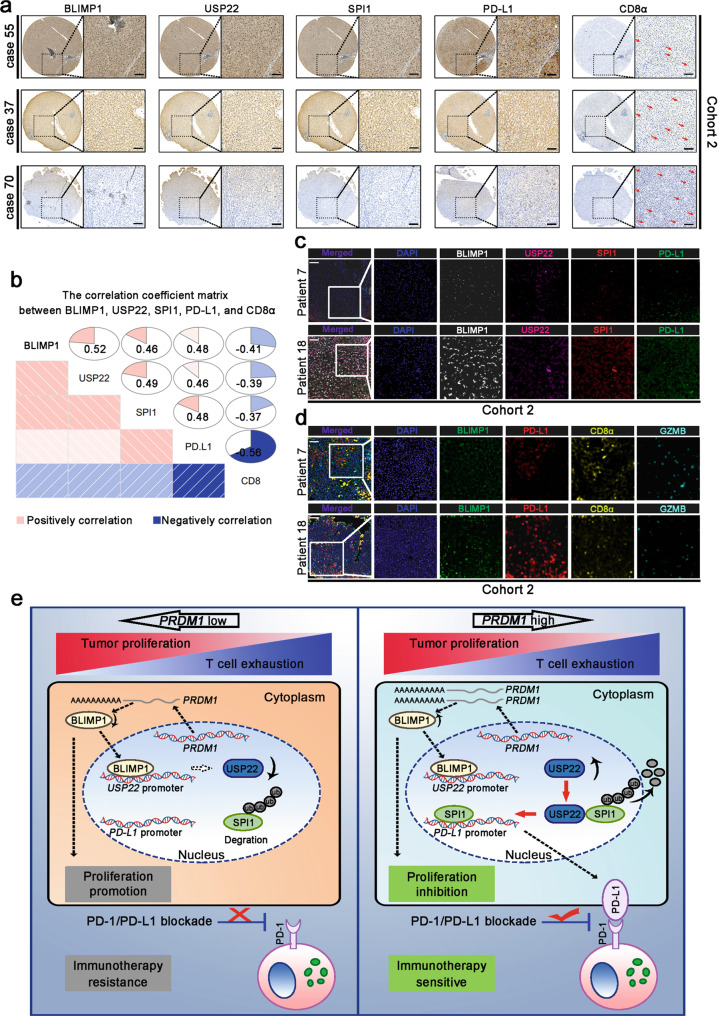
“Moreover, BLIMP1 and PD-L1 levels were negatively correlated with CD8+ T cells, and the activity (GZMB+) of infiltrated CD8+ T cells (Fig. 7d).”
§ PRDM1/BLIMP1 induces cancer immune evasion by modulating the USP22-SPI1-PD-L1 axis in hepatocellular carcinoma cells > Results > PRDM1-USP22-SPI1 axis regulates PD-L1 levels in patients with HCC
plaincorrelationaln = 90- Asserted: passes — The authors put it forward as true.
- Checkable: passes — It can be checked against evidence.
- Load-bearing: passes — The paper’s conclusions depend on it.
- Based: passes — The paper gives a reason why it holds.
It may state two separate claims as one.
A result the paper reports from its own data — it cites no other source for it, so there is none to check. The quote shows it is in the paper.
In the paper
“Ultimately, as expected, patient 2 with high tumoral PRDM1 expression showed significant tumor shrinkage after treatment, whereas patient 1 with low tumoral PRDM1 expression showed tumor progression after treatment.”
§ PRDM1/BLIMP1 induces cancer immune evasion by modulating the USP22-SPI1-PD-L1 axis in hepatocellular carcinoma cells > Results > Single-cell analysis of intra-tumoral immune cell populations confirmed that PRDM1 overexpression potentiates T cell exhaustion
plaincorrelational- Asserted: passes — The authors put it forward as true.
- Checkable: passes — It can be checked against evidence.
- Load-bearing: unclear — It is unclear whether the paper’s conclusions depend on it.
- Based: passes — The paper gives a reason why it holds.
It may state two separate claims as one.
A result the paper reports from its own data — it cites no other source for it, so there is none to check. The quote shows it is in the paper.
In the paper
“Immune regulatory parameters such as positive regulation of immune response, response to interferon-gamma, and lymphocyte activation, were significantly enriched. Regulation of the cell death pathway was also significantly enriched, indicating that PRDM1 might suppress the proliferation ability of HCC cell lines by mediating tumor cell death (Fig. 8f).”
§ PRDM1/BLIMP1 induces cancer immune evasion by modulating the USP22-SPI1-PD-L1 axis in hepatocellular carcinoma cells > Results > Single-cell analysis of intra-tumoral immune cell populations confirmed that PRDM1 overexpression potentiates T cell exhaustion
hedgedcorrelationalSingle case- Asserted: passes — The authors put it forward as true.
- Checkable: passes — It can be checked against evidence.
- Load-bearing: unclear — It is unclear whether the paper’s conclusions depend on it.
- Based: passes — The paper gives a reason why it holds.
It may state two separate claims as one.
A conclusion the paper draws from its own results — it cites no other source for it, so there is none to check. The quote shows it is in the paper.
In the paper
“These results indicate that USP22 interacts with SPI1 and enhances SPI1 stability through deubiquitination.”
§ PRDM1/BLIMP1 induces cancer immune evasion by modulating the USP22-SPI1-PD-L1 axis in hepatocellular carcinoma cells > Results > USP22 interacts with SPI1
hedgeddirect- Asserted: passes — The authors put it forward as true.
- Checkable: passes — It can be checked against evidence.
- Load-bearing: passes — The paper’s conclusions depend on it.
- Based: passes — The paper gives a reason why it holds.
It may state two separate claims as one.
- Rests on an assumption: The ubiquitin-proteasome system enhances proteasomal degradation of its target proteins.
- Rests on an assumption: Deubiquitinating enzymes control ubiquitin-dependent pathways by separating protein-ubiquitin bonds.
A conclusion the paper draws from its own results — it cites no other source for it, so there is none to check. The quote shows it is in the paper.
In the paper
“Thus, Prdm1 fails to impede tumor proliferation in immunocompetent mice but impairs tumor progression in immunodeficient mice.”
§ PRDM1/BLIMP1 induces cancer immune evasion by modulating the USP22-SPI1-PD-L1 axis in hepatocellular carcinoma cells > Results > Prdm1 promotes immune evasion by upregulating PD-L1 expression in immune-competent mice and HCC cells
plaindirect- Asserted: passes — The authors put it forward as true.
- Checkable: passes — It can be checked against evidence.
- Load-bearing: passes — The paper’s conclusions depend on it.
- Based: passes — The paper gives a reason why it holds.
It may state two separate claims as one.
A conclusion the paper draws from its own results — it cites no other source for it, so there is none to check. The quote shows it is in the paper.
In the paper
“Thus, above results confirmed that Prdm1 may promote tumor immune evasion by driving PD-L1 upregulation and neutralizing the anti-tumor efficacy of Prdm1 overexpression.”
§ PRDM1/BLIMP1 induces cancer immune evasion by modulating the USP22-SPI1-PD-L1 axis in hepatocellular carcinoma cells > Results > Prdm1 promotes immune evasion by upregulating PD-L1 expression in immune-competent mice and HCC cells
hedgedconditional- Asserted: passes — The authors put it forward as true.
- Checkable: passes — It can be checked against evidence.
- Load-bearing: passes — The paper’s conclusions depend on it.
- Based: passes — The paper gives a reason why it holds.
It may state two separate claims as one.
- Rests on an assumption: T cell exhaustion due to PD-L1/PD1 inhibitory receptor signaling impairs T cell proliferation and effector functions.
A conclusion the paper draws from its own results — it cites no other source for it, so there is none to check. The quote shows it is in the paper.
In the paper
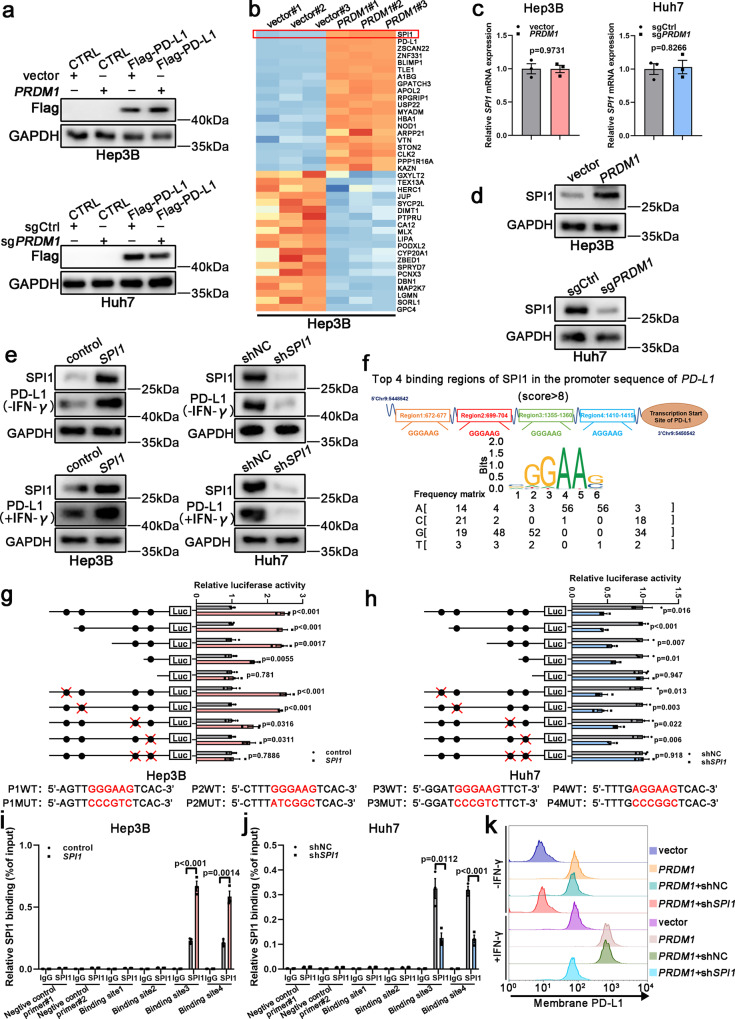
“Taken together, SPI1 is a downstream effector of PRDM1 and directly binds the PD-L1 promoter to enhance its mRNA expression.”
§ PRDM1/BLIMP1 induces cancer immune evasion by modulating the USP22-SPI1-PD-L1 axis in hepatocellular carcinoma cells > Results > SPI1 serves as a downstream effector of PRDM1 to enhance PD-L1 transcription
plaindirect- Asserted: passes — The authors put it forward as true.
- Checkable: passes — It can be checked against evidence.
- Load-bearing: passes — The paper’s conclusions depend on it.
- Based: passes — The paper gives a reason why it holds.
It may state two separate claims as one.
- Rests on an assumption: SPI1 is a transcription factor for PD-L1.
What the paper did — it cites no source for this, so there is none to check. The quote shows it is in the paper.
In the paper
“Each specimen was histologically and pathologically examined and graded by two experienced pathologists.”
§ PRDM1/BLIMP1 induces cancer immune evasion by modulating the USP22-SPI1-PD-L1 axis in hepatocellular carcinoma cells > Methods > Clinical tissue samples
plain- Asserted: passes — The authors put it forward as true.
- Checkable: passes — It can be checked against evidence.
- Load-bearing: fails — The paper’s conclusions may not depend on it.
- Based: passes — The paper gives a reason why it holds.
Probably not a substantial claim. The paper’s conclusions may not depend on it.
What the paper did — it cites no source for this, so there is none to check. The quote shows it is in the paper.
In the paper
“Gating strategies used for flow cytometry staining was provided in Supplementary Fig. 10.”
§ PRDM1/BLIMP1 induces cancer immune evasion by modulating the USP22-SPI1-PD-L1 axis in hepatocellular carcinoma cells > Methods > Flow cytometry
plain- Asserted: passes — The authors put it forward as true.
- Checkable: passes — It can be checked against evidence.
- Load-bearing: fails — The paper’s conclusions may not depend on it.
- Based: passes — The paper gives a reason why it holds.
Probably not a substantial claim. The paper’s conclusions may not depend on it.
What the paper did — it cites no source for this, so there is none to check. The quote shows it is in the paper.
In the paper
“Uncropped and unprocessed scans of blots are included in a Source Data file.”
§ PRDM1/BLIMP1 induces cancer immune evasion by modulating the USP22-SPI1-PD-L1 axis in hepatocellular carcinoma cells > Methods > Western blotting
plain- Asserted: passes — The authors put it forward as true.
- Checkable: passes — It can be checked against evidence.
- Load-bearing: fails — The paper’s conclusions may not depend on it.
- Based: passes — The paper gives a reason why it holds.
Probably not a substantial claim. The paper’s conclusions may not depend on it.
In the paper
“Tumor sizes were calculated by the volume formula π/6(L × W × H) [L: the length (longest dimension); W: width (shorter dimension, parallel to the mouse body); H: height (diameter of tumor perpendicular to the length and width)], which is confirmed to be the best formula represented the actual volume of a wide spectrum of tumor shapes and sizes38.”
§ PRDM1/BLIMP1 induces cancer immune evasion by modulating the USP22-SPI1-PD-L1 axis in hepatocellular carcinoma cells > Methods > Animal models
What the sources say
- Not checked — no full text of the sourcecites [38] Tomayko, M. M. & Reynolds, C. P. Determination of subcutaneous tumor size in athymic (nude) mice. Cancer Chemother. Pharmacol. 24, 148–154 (1989). source
boosted- Asserted: passes — The authors put it forward as true.
- Checkable: passes — It can be checked against evidence.
- Load-bearing: fails — The paper’s conclusions may not depend on it.
- Based: passes — The paper gives a reason why it holds.
Probably not a substantial claim. The paper’s conclusions may not depend on it.
What the paper did — it cites no source for this, so there is none to check. The quote shows it is in the paper.
In the paper
“All the animal studies were approved by the Institutional Animal Care and Use Committee of Nanjing Medical University and conducted according to protocols approved by the Ethical Committee of Nanjing Medical university.”
§ PRDM1/BLIMP1 induces cancer immune evasion by modulating the USP22-SPI1-PD-L1 axis in hepatocellular carcinoma cells > Methods > Animal models
plain- Asserted: passes — The authors put it forward as true.
- Checkable: passes — It can be checked against evidence.
- Load-bearing: fails — The paper’s conclusions may not depend on it.
- Based: passes — The paper gives a reason why it holds.
Probably not a substantial claim. The paper’s conclusions may not depend on it. It may state two separate claims as one.
What the paper did — it cites no source for this, so there is none to check. The quote shows it is in the paper.
In the paper
“P value was determined by unpaired two-sided Student’s t test (e, g, i, j, n, o) and Kaplan–Meier method (f, h, p) with no correction for multiple comparisons.”
§ PRDM1/BLIMP1 induces cancer immune evasion by modulating the USP22-SPI1-PD-L1 axis in hepatocellular carcinoma cells > Results > Prdm1 overexpression increases the efficacy of PD-1 mAb therapy in mice
plainn = 6 ·- Asserted: passes — The authors put it forward as true.
- Checkable: passes — It can be checked against evidence.
- Load-bearing: fails — The paper’s conclusions may not depend on it.
- Based: passes — The paper gives a reason why it holds.
Probably not a substantial claim. The paper’s conclusions may not depend on it. It may state two separate claims as one.
What the paper did — it cites no source for this, so there is none to check. The quote shows it is in the paper.
In the paper
“No patient in Cohort 1 and Cohort 2 received any other HCC treatment prior to surgery.”
§ PRDM1/BLIMP1 induces cancer immune evasion by modulating the USP22-SPI1-PD-L1 axis in hepatocellular carcinoma cells > Methods > Clinical tissue samples
plain- Asserted: passes — The authors put it forward as true.
- Checkable: passes — It can be checked against evidence.
- Load-bearing: passes — The paper’s conclusions depend on it.
- Based: passes — The paper gives a reason why it holds.
Probably not a substantial claim.
A conclusion the paper draws from its own results — it cites no other source for it, so there is none to check. The quote shows it is in the paper.
In the paper
“Collectively, we demonstrate that the PRDM1-USP22-SPI1 axis regulates PD-L1 levels, resulting in infiltrated CD8+ T cell exhaustion.”
§ PRDM1/BLIMP1 induces cancer immune evasion by modulating the USP22-SPI1-PD-L1 axis in hepatocellular carcinoma cells > Abstract
boosteddirect- Asserted: passes — The authors put it forward as true.
- Checkable: passes — It can be checked against evidence.
- Load-bearing: passes — The paper’s conclusions depend on it.
- Based: passes — The paper gives a reason why it holds.
It may state two separate claims as one.
- Rests on an assumption: The mechanisms underlying PD-L1 regulation are not fully elucidated.
- Rests on an assumption: The role of the PRDM family in regulating anti-tumor immunity and immune molecules in HCC cells remains largely unknown.
- Rests on an assumption: SPI1 is a transcription factor for PD-L1.
- Rests on an assumption: T cell exhaustion due to PD-L1/PD1 inhibitory receptor signaling impairs T cell proliferation and effector functions.
- Rests on an assumption: The ubiquitin-proteasome system enhances proteasomal degradation of its target proteins.
- Rests on an assumption: Deubiquitinating enzymes control ubiquitin-dependent pathways by separating protein-ubiquitin bonds.
A conclusion the paper draws from its own results — it cites no other source for it, so there is none to check. The quote shows it is in the paper.
In the paper
“Herein, we identified that PRDM1 may upregulate SPI1 expression, thus contributing to PD-L1 expression.”
§ PRDM1/BLIMP1 induces cancer immune evasion by modulating the USP22-SPI1-PD-L1 axis in hepatocellular carcinoma cells > Discussion
hedgedconditional- Asserted: passes — The authors put it forward as true.
- Checkable: passes — It can be checked against evidence.
- Load-bearing: passes — The paper’s conclusions depend on it.
- Based: passes — The paper gives a reason why it holds.
It may state two separate claims as one.
What the paper did — it cites no source for this, so there is none to check. The quote shows it is in the paper.
In the paper
“Our study was approved by the Ethics Committee of the First Affiliated Hospital of Nanjing Medical University, and informed consent was obtained from each patient.”
§ PRDM1/BLIMP1 induces cancer immune evasion by modulating the USP22-SPI1-PD-L1 axis in hepatocellular carcinoma cells > Methods > Clinical tissue samples
plain- Asserted: passes — The authors put it forward as true.
- Checkable: passes — It can be checked against evidence.
- Load-bearing: fails — The paper’s conclusions may not depend on it.
- Based: passes — The paper gives a reason why it holds.
Probably not a substantial claim. The paper’s conclusions may not depend on it. It may state two separate claims as one.
The paper relies on this without support.
The mechanisms underlying PD-L1 regulation are not fully elucidated.
“However, the mechanisms underlying PD-L1 regulation are not fully elucidated.”
The paper relies on this without support.
The role of the PRDM family in regulating anti-tumor immunity and immune molecules in HCC cells remains largely unknown.
“However, the role of the PRDM family in regulating anti-tumor immunity and immune molecules in HCC cells remains largely unknown.”
The paper relies on this without support.
SPI1 is a transcription factor for PD-L1.
“SPI1, a transcription factor for PD-L1, was the most likely candidate based on fold change (Fig. 3b).”
The paper relies on this without support.
T cell exhaustion due to PD-L1/PD1 inhibitory receptor signaling impairs T cell proliferation and effector functions.
“As T cell exhaustion due to PD-L1/PD1 inhibitory receptor signaling impairs T cell proliferation and effector functions, the relationship between tumoral BLIMP1 protein expression and exhausted T cells in HCC specimens was examined by profiling the content and function of CD8+ T cells in tumor-infiltrating T lymphocytes (TILs) using flow cytometry in cohort 1”
The paper relies on this without support.
The ubiquitin-proteasome system enhances proteasomal degradation of its target proteins.
“The ubiquitin-proteasome system (UPS) enhances proteasomal degradation of its target proteins.”
The paper relies on this without support.
Deubiquitinating enzymes control ubiquitin-dependent pathways by separating protein-ubiquitin bonds.
“Deubiquitinating enzymes (DUBs) control ubiquitin-dependent pathways by separating protein-ubiquitin bonds.”
The paper relies on this without support.
Only a fraction of patients with HCC respond to PD-(L)1 mAb therapy.
“However, only a fraction of patients with HCC respond to PD-(L)1 mAb therapy.”
The paper relies on this without support.
PD-(L)1 mAb has been proven to be beneficial for patients with various advanced malignancies.
“PD-(L)1 mAb has been proven to be beneficial for patients with various advanced malignancies.”
Self-check
Percentages, sums and reported differences re-computed from the paper’s own numbers.
Each contradiction between two passages listed here was confirmed by an independent check.
Rated minor: it would not touch a result — a value no result rests on, a p-value that stays on the same side of the significance level, or a conflict that is clerical, resolved elsewhere in the paper, or outside its own findings.
In the paper
§ PRDM1/BLIMP1 induces cancer immune evasion by modulating the USP22-SPI1-PD-L1 axis in hepatocellular carcinoma cells > Results > SPI1 serves as a downstream effector of PRDM1 to enhance PD-L1 transcription
“To further confirm that PRDM1 enhances PD-L1 mRNA but not protein expression, CMV-driven Flag-PD-L1-overexpressing HCC cell lines were established.”
§ PRDM1/BLIMP1 induces cancer immune evasion by modulating the USP22-SPI1-PD-L1 axis in hepatocellular carcinoma cells > Results > PRDM1/BLIMP1 is a prominent regulator of PD-L1 in HCC
“PD-L1 upregulation at both mRNA and total and cell surface protein levels after PRDM1 overexpression was confirmed in PRDM1-overexpressing Hep3B cells”
Rated minor: it would not touch a result — a value no result rests on, a p-value that stays on the same side of the significance level, or a conflict that is clerical, resolved elsewhere in the paper, or outside its own findings.
In the paper
§ PRDM1/BLIMP1 induces cancer immune evasion by modulating the USP22-SPI1-PD-L1 axis in hepatocellular carcinoma cells > Results > Prdm1 promotes immune evasion by upregulating PD-L1 expression in immune-competent mice and HCC cells
“To confirm the functional association between Prdm1-induced PD-L1 upregulation and in vivo tumor enlargement, we have also established Pd-l1−/− Hepa1-6 and H22 cell lines and performed the same in vivo experiment in Fig. 2a, d.”
§ PRDM1/BLIMP1 induces cancer immune evasion by modulating the USP22-SPI1-PD-L1 axis in hepatocellular carcinoma cells > Results > Prdm1 promotes immune evasion by upregulating PD-L1 expression in immune-competent mice and HCC cells
“However, no obvious differences were observed between the Prdm1 or sgPrdm1 groups and their corresponding controls in terms of tumor size and OS.”
Citations
Cites
Determination of subcutaneous tumor size in athymic (nude) mice
Tomayko, M. M., & Reynolds, C. P. (1989) · Cancer Chemotherapy and Pharmacology · doi:10.1007/bf00300234 · Cited by 1,830
MYC regulates the antitumor immune response through CD47 and PD-L1
Casey, S. C., Tong, L., Li, Y., Do, R., Walz, S., Fitzgerald, K. N., Gouw, A. M., Baylot, V., Gütgemann, I., Eilers, M., et al. (2016) · Science · doi:10.1126/science.aac9935 · Cited by 1,403
Cyclin D–CDK4 kinase destabilizes PD-L1 via cullin 3–SPOP to control cancer immune surveillance
Zhang, J., Bu, X., Wang, H., Zhu, Y., Geng, Y., Nihira, N. T., Tan, Y., Ci, Y., Wu, F., Dai, X., et al. (2018) · Nature · doi:10.1038/nature25015 · Cited by 1,013 · cited 1×
“Moreover, several critical proteins including CMTM4, CMTM6, GSK3 β , CSN5, CDK4, CDK6, and palmitoylated B3GNT3 have been shown to affect post-translational PD-L1 stability 31 – 36 .”
CMTM6 maintains the expression of PD-L1 and regulates anti-tumour immunity
Burr, M. L., Sparbier, C. E., Chan, Y.-C., Williamson, J. C., Woods, K., Beavis, P. A., Lam, E. Y. N., Henderson, M. A., Bell, C. C., Stolzenburg, S., et al. (2017) · Nature · doi:10.1038/nature23643 · Cited by 946
Deubiquitination and Stabilization of PD-L1 by CSN5
Lim, S.-O., Li, C.-W., Xia, W., Cha, J.-H., Chan, L.-C., Wu, Y., Chang, S.-S., Lin, W.-C., Hsu, J.-M., Hsu, Y.-H., et al. (2016) · Cancer Cell · doi:10.1016/j.ccell.2016.10.010 · Cited by 793
Identification of CMTM6 and CMTM4 as PD-L1 protein regulators
Mezzadra, R., Sun, C., Jae, L. T., Gomez-Eerland, R., de Vries, E., Wu, W., Logtenberg, M. E. W., Slagter, M., Rozeman, E. A., Hofland, I., et al. (2017) · Nature · doi:10.1038/nature23669 · Cited by 697 · cited 1×
“Moreover, several critical proteins including CMTM4, CMTM6, GSK3 β , CSN5, CDK4, CDK6, and palmitoylated B3GNT3 have been shown to affect post-translational PD-L1 stability 31 – 36 .”
Sangro, B., Melero, I., Wadhawan, S., Finn, R. S., Abou-Alfa, G. K., Cheng, A.-L., Yau, T., Furuse, J., Park, J.-W., Boyd, Z., et al. (2020) · Journal of Hepatology · doi:10.1016/j.jhep.2020.07.026 · Cited by 407
Inactivation of the PRDM1/BLIMP1 gene in diffuse large B cell lymphoma
Pasqualucci, L., Compagno, M., Houldsworth, J., Monti, S., Grunn, A., Nandula, S. V., Aster, J. C., Murty, V. V., Shipp, M. A., & Dalla‐Favera, R. (2006) · The Journal of Experimental Medicine · doi:10.1084/jem.20052204 · Cited by 380
Oncogenic activation of the STAT3 pathway drives PD-L1 expression in natural killer/T-cell lymphoma
Song, T. L., Nairismägi, M.-L., Laurensia, Y., Lim, J.-Q., Tan, J., Li, Z.-M., Pang, W.-L., Kizhakeyil, A., Wijaya, G.-C., Huang, D.-C., et al. (2018) · Blood · doi:10.1182/blood-2018-01-829424 · Cited by 326
Therapeutically Increasing MHC-I Expression Potentiates Immune Checkpoint Blockade
Gu, S. S., Zhang, W., Wang, X., Jiang, P., Traugh, N., Li, Z., Meyer, C., Stewig, B., Xie, Y., Bu, X., et al. (2021) · Cancer Discovery · doi:10.1158/2159-8290.cd-20-0812 · Cited by 273
Self-citation
Cited by
Sorted by citations
Nanoparticles in tumor microenvironment remodeling and cancer immunotherapy
Lu, Q., Kou, D., Lou, S., Ashrafizadeh, M., Aref, A. R., Canadas, I., Tian, Y., Niu, X., Wang, Y., Torabian, P., et al. (2024) · Journal of Hematology & Oncology · doi:10.1186/s13045-024-01535-8 · Cited by 373
“This, in turn, results in increased PD-L1 expression, promoting immune evasion [227].”
BackgroundZhang, M., Liu, C.-J., Tu, J., Tang, M., Ashrafizadeh, M., Nabavi, N., Sethi, G., Zhao, P., & Liu, S. (2025) · Molecular Cancer · doi:10.1186/s12943-025-02305-x · Cited by 324
Osr2 functions as a biomechanical checkpoint to aggravate CD8+ T cell exhaustion in tumor
Zhang, J., Li, J., Hou, Y., Lin, Y., Zhao, H., Shi, Y., Chen, K., Nian, C., Tang, J., Pan, L., et al. (2024) · Cell · doi:10.1016/j.cell.2024.04.023 · Cited by 214
Self-citationEpigenetic regulation in cancer therapy: From mechanisms to clinical advances
Tao, L., Zhou, Y., Luo, Y., Qiu, J., Xiao, Y., Zou, J., Zhang, Y., Liu, X., Yang, X., Gou, K., et al. (2024) · MedComm – Oncology · doi:10.1002/mog2.59 · Cited by 95
Self-citationLi, B., Ashrafizadeh, M., & Jiao, T. (2024) · International Journal of Biological Macromolecules · doi:10.1016/j.ijbiomac.2024.129391 · Cited by 92
Metadata
- Authors
- Li, Q., Zhang, L., You, W., Xu, J., Dai, J., Hua, D., Zhang, R., Yao, F., Zhou, S., Huang, W., Dai, Y., Zhang, Y., Baheti, T., Qian, X., Pu, L., Xu, J., Xia, Y., Zhang, C., Tang, J., & Wang, X.
- Affiliations
- Chinese Academy of Medical Sciences & Peking Union Medical College (CN)
- Southeast University (CN)
- Jiangsu Province Hospital (CN)
- Nanjing Medical University (CN)
- Corresponding author
- Xu, Jiali
- Xia, Yongxiang
- Zhang, Chuanyong
- Tang, Jinhai
- Wang, Xuehao
- ORCID
- Venue
- Nature Communications
- Published
- 2022-12-12
- Volume
- 13
- Issue
- 1
- Pages
- 7677-7677
- ISSN
- 2041-1723 (ISSN-L)
- PMC
- PMC9744896
- OpenAlex
- W4311824088
- Semantic Scholar
- 8cc67529818e6c3235226e246230d27027fa9130
- Cited by
- 120
- References
- 42
- Citations by year
- 2026: 27 · 2025: 39 · 2024: 47 · 2023: 7
- FWCI
- 10.60
- Type
- journal article
- Language
- en
- Open access
- gold
- doi.org
- Locations
- Nature Communications (publishedVersion, cc-by)
- PubMed Central (publishedVersion, cc-by)
- PubMed (publishedVersion)
- RePEc: Research Papers in Economics (submittedVersion)
- DOAJ (DOAJ: Directory of Open Access Journals) (submittedVersion, cc-by-sa)
- Funders
- National Natural Science Foundation of China (82103440, 82272791, 31930020, 82203659)
- China Postdoctoral Science Foundation
- Government of Jiangsu Province
- Natural Science Foundation of Jiangsu Province (BK20220731, 31930020)
- Nanjing Medical University
- Topics
- Health Sciences › Medicine › Oncology › Cancer Immunotherapy and Biomarkers
- Health Sciences › Medicine › Hepatology › Hepatocellular Carcinoma Treatment and Prognosis
- Life Sciences › Immunology and Microbiology › Immunology › T-cell and B-cell Immunology
- Keywords
- Blimp-1, hepatocellular carcinoma, tumor immune evasion, PD-L1, PD-1, USP22, PU.1, deubiquitination, CD8+ T cell exhaustion, anti-PD-1 therapy, antitumor immunity, transcriptional regulation
- MeSH terms
- Positive Regulatory Domain I-Binding Factor 1, Animals, Carcinoma, Hepatocellular, Liver Neoplasms, CD8-Positive T-Lymphocytes, Mice, Immune Evasion, B7-H1 Antigen, Programmed Cell Death 1 Receptor
About these checks
Registry, retraction, Cites and statistics results are computed, not judged, with one exception: a printed reference that no index lists is read once by a model before it counts as a citation error. Claims are extracted by a model and kept only when their quote appears verbatim in the text; each cited source is then checked, with a model’s help, for whether it says what the claim relies on. Those verdicts can be wrong — read the claim’s quote and the cited source before relying on one.
A language model drew the claims from the paper on 2026-10-07, under version 3 of the claim definition (model deepseek-v4.1-flash, prompt extract-v3).
A second model labelled each claim on 2026-10-07 (model jev-1.13-20260917, definition revision gold-guideline-v0.2).
Cited sources are checked with a language model’s help (gpt-6-sol).
Statistics and arithmetic are recomputed, not judged.
Confidence bands are shown only for fields calibrated on our annotated test set. None is calibrated yet, so no band is shown.
What counts as a claim ›How we measure confidence ›How we check this ›
Are you an author, or do you see a problem with this page? Request a review
