

The DOI matches its Crossref record; 76 of the 78 references it cites were found in a registry or an index, and 2 are not checked yet.
Quantifying the local adaptive landscape of a nascent bacterial community
Open accessPublished version of a preprint
Abstract
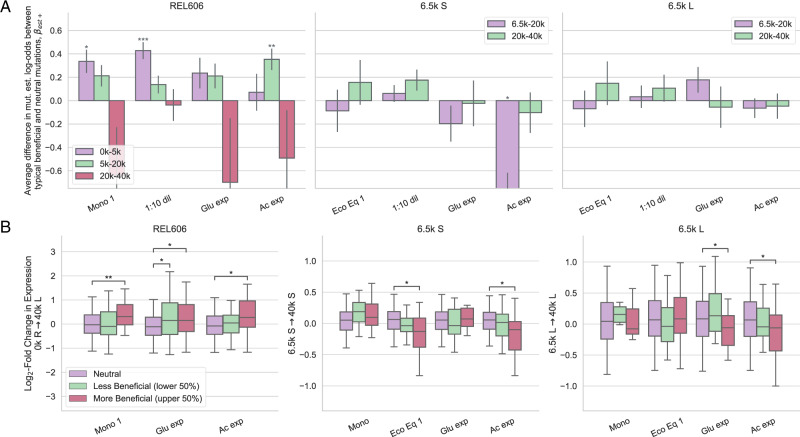
The fitness effects of all possible mutations available to an organism largely shape the dynamics of evolutionary adaptation. Yet, whether and how this adaptive landscape changes over evolutionary times, especially upon ecological diversification and changes in community composition, remains poorly understood. We sought to fill this gap by analyzing a stable community of two closely related ecotypes (“L” and “S”) shortly after they emerged within the E. coli Long-Term Evolution Experiment (LTEE). We engineered genome-wide barcoded transposon libraries to measure the invasion fitness effects of all possible gene knockouts in the coexisting strains as well as their ancestor, for many different, ecologically relevant conditions. We find consistent statistical patterns of fitness effect variation across both genetic background and community composition, despite the idiosyncratic behavior of individual knockouts. Additionally, fitness effects are correlated with evolutionary outcomes for a number of conditions, possibly revealing shifting patterns of adaptation. Together, our results reveal how ecological and epistatic effects combine to shape the adaptive landscape in a nascent ecological community.
Overview
The claims and statistics of this paper haven’t been checked yet.
Run the check — free, no account needed. It reads the open-access text and checks the sources it cites.
Integrity signals
Registry
Cites
Statistics
Figures
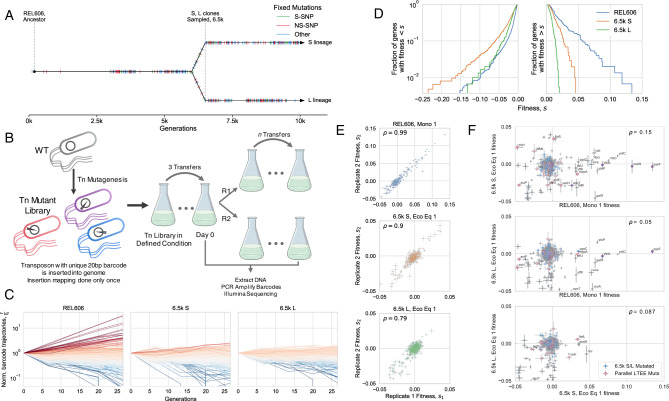
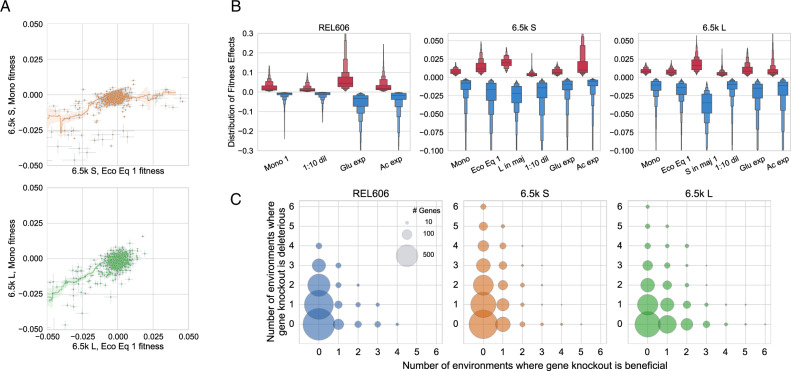
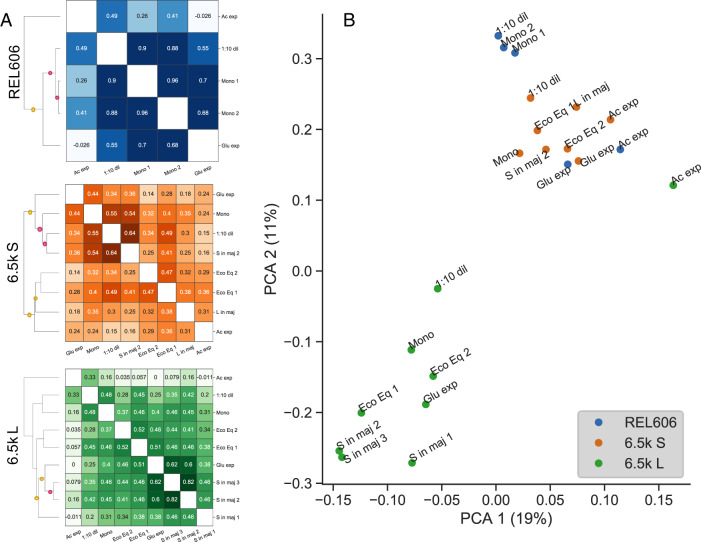
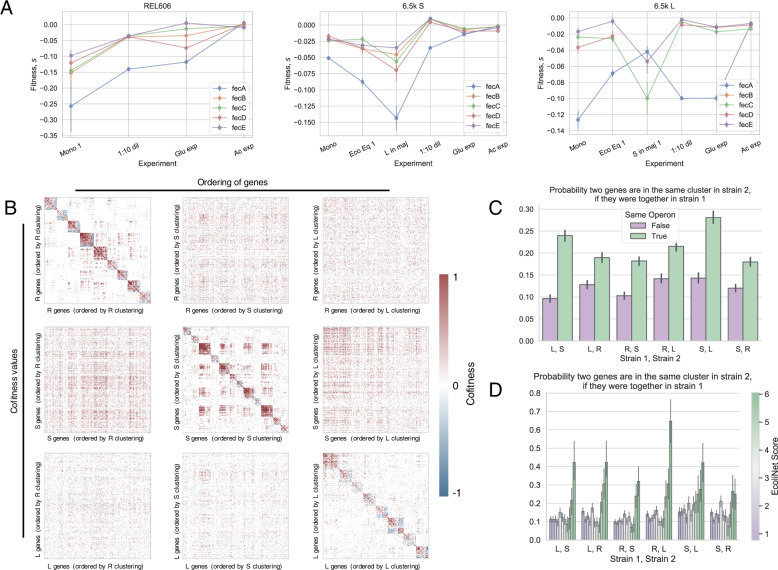
Verification
Claims the paper makes
The claims and statistics of this paper haven’t been checked yet.
Run the check — free, no account needed. It reads the open-access text and checks the sources it cites.
Claims other papers make about this one
Each is checked against this paper’s own text: does it say what the citing paper says it does?
The check wasn’t confident either way, so it gives no verdict — never disputed.
In the citing paper
“In line with SHIP1’s role as a brake on inflammation, we recently identified SHIP1 as a regulator of the NLRP3 inflammasome in human microglia, as both the CRISPR/Cas9-mediated knockdown of INPP5D and acute inhibition of SHIP1 led to the activation of the inflammasome11.”
From INPP5D/SHIP1 regulates endo-lysosomal function and cargo-selective phagocytosis in human microglia (2025) · cites this paper as [11]
Experimental — accuracy not yet measuredThe check wasn’t confident either way, so it gives no verdict — never disputed.
In the citing paper
“AD risk SNPs at the INPP5D locus are intronic and it is unclear how they influence INPP5D levels11,12.”
From INPP5D/SHIP1 regulates endo-lysosomal function and cargo-selective phagocytosis in human microglia (2025) · cites this paper as [11]
Experimental — accuracy not yet measuredThe check wasn’t confident either way, so it gives no verdict — never disputed.
In the citing paper
“we previously reported a reduction in autophagic flux upon INPP5D loss-of-function in iMGs11”
From INPP5D/SHIP1 regulates endo-lysosomal function and cargo-selective phagocytosis in human microglia (2025) · cites this paper as [11]
Experimental — accuracy not yet measuredThe check wasn’t confident either way, so it gives no verdict — never disputed.
In the citing paper
“In accord, while overall protein levels of SHIP1 are elevated in brain tissue from individuals with AD, the levels of full length SHIP1 containing the phosphatase domain are reduced11.”
From INPP5D/SHIP1 regulates endo-lysosomal function and cargo-selective phagocytosis in human microglia (2025) · cites this paper as [11]
Experimental — accuracy not yet measuredThe check wasn’t confident either way, so it gives no verdict — never disputed.
In the citing paper
“We previously reported that the NLRP3 inflammasome is activated in INPP5D HET microglia and in microglia following acute inhibition of SHIP111,15.”
From INPP5D/SHIP1 regulates endo-lysosomal function and cargo-selective phagocytosis in human microglia (2025) · cites this paper as [11]
Experimental — accuracy not yet measured
The check wasn’t confident either way, so it gives no verdict — never disputed.
In the citing paper
“3AC, which we previously showed to robustly induce the secretion of IL-1β and IL-18 upon activation of the NLRP3 inflammasome11”
From INPP5D/SHIP1 regulates endo-lysosomal function and cargo-selective phagocytosis in human microglia (2025) · cites this paper as [11]
Experimental — accuracy not yet measured
Self-check
Percentages, sums and reported differences re-computed from the paper’s own numbers.
The self-check needs the paper’s full text.
Citations
Cites
Smyth, G. K. (2004) · Statistical Applications in Genetics and Molecular Biology · doi:10.2202/1544-6115.1027 · Cited by 11,829
Exploring Network Structure, Dynamics, and Function Using NetworkX
Hagberg, A. A., Schult, D. A., & Swart, P. J. (2008) · Proceedings of the Python in Science Conference · doi:10.25080/tcwv9851 · Cited by 7,477
Statsmodels: Econometric and Statistical Modeling with Python
Seabold, S., & Perktold, J. (2010) · Proceedings of the Python in Science Conferences · doi:10.25080/majora-92bf1922-011 · Cited by 6,968
Robust Regression and Outlier Detection
Rousseeuw, P. J., & Leroy, A. M. (1987) · Wiley Series in Probability and Statistics · doi:10.1002/0471725382 · Cited by 5,609
Bioinformatics and Computational Biology Solutions Using R and Bioconductor
Gentleman, R. C., Carey, V. J., Huber, W. K., Irizarry, R. A., & Dudoit, S. (2005) · Statistics in the health sciences · doi:10.1007/0-387-29362-0 · Cited by 3,470
The Microbial Engines That Drive Earth's Biogeochemical Cycles
Falkowski, P. G., Fenchel, T., & Delong, E. F. (2008) · Science · doi:10.1126/science.1153213 · Cited by 3,379
GEOquery: a bridge between the Gene Expression Omnibus (GEO) and BioConductor
Davis, S. R., & Meltzer, P. S. (2007) · Bioinformatics · doi:10.1093/bioinformatics/btm254 · Cited by 3,316
Khalifa, A. A. Z., Ichikawa, M., Dai, D., Kubo, S., Black, C. S., Peri, K., McAlear, T. S., Veyron, S., Yang, S. K., Vargas, J., et al. (2020) · eLife · doi:10.7554/elife.52760 · Cited by 1,676
GOATOOLS: A Python library for Gene Ontology analyses
Klopfenstein, D. V., Zhang, L., Pedersen, B. S., Ramírez, F., Vesztrocy, A. W., Naldi, A., Mungall, C., Yunes, J. M., Botvinnik, O. B., Weigel, M., et al. (2018) · Scientific Reports · doi:10.1038/s41598-018-28948-z · Cited by 1,314
Brandes, U., Delling, D., Gaertler, M., Görke, R., Hoefer, M., Nikoloski, Z., & Wagner, D. (2008) · IEEE Transactions on Knowledge and Data Engineering · doi:10.1109/tkde.2007.190689 · Cited by 1,243
Performance of modularity maximization in practical contexts
Good, B. H., de Montjoye, Y.-A., & Clauset, A. (2010) · Physical Review E · doi:10.1103/physreve.81.046106 · Cited by 937
Self-citationTHE POPULATION GENETICS OF ADAPTATION: THE DISTRIBUTION OF FACTORS FIXED DURING ADAPTIVE EVOLUTION
Orr, H. A. (1998) · Evolution · doi:10.1111/j.1558-5646.1998.tb01823.x · Cited by 896
Evolution of high mutation rates in experimental populations of E. coli
Sniegowski, P. D., Gerrish, P. J., & Lenski, R. E. (1997) · Nature · doi:10.1038/42701 · Cited by 879
Blount, Z. D., Borland, C. Z., & Lenski, R. E. (2008) · Proceedings of the National Academy of Sciences · doi:10.1073/pnas.0803151105 · Cited by 840
The dynamics of molecular evolution over 60,000 generations
Good, B. H., McDonald, M. J., Barrick, J. E., Lenski, R. E., & Desai, M. M. (2017) · Nature · doi:10.1038/nature24287 · Cited by 733
Self-citationRenewing Felsenstein’s phylogenetic bootstrap in the era of big data
Lemoine, F., Entfellner, J.-B. D., Wilkinson, E., Correia, D., Felipe, M. D., de Oliveira, T., & Gascuel, O. (2018) · Nature · doi:10.1038/s41586-018-0043-0 · Cited by 733
Graham, E. B., Knelman, J. E., Schindlbacher, A., Siciliano, S. D., Breulmann, M., Yannarell, A. C., Beman, J. M., Abell, G. C. J., Philippot, L., Prosser, J. I., et al. (2016) · Frontiers in Microbiology · doi:10.3389/fmicb.2016.00214 · Cited by 713
Adaptation of Pseudomonas aeruginosa to the cystic fibrosis airway: an evolutionary perspective
Folkesson, A., Jelsbak, L., Yang, L., Johansen, H. K., Ciofu, O., Høiby, N., & Molin, S. (2012) · Nature Reviews Microbiology · doi:10.1038/nrmicro2907 · Cited by 699
Post, D. M., & Palkovacs, E. P. (2009) · Philosophical Transactions of the Royal Society B Biological Sciences · doi:10.1098/rstb.2009.0012 · Cited by 646
Evolutionary consequences of niche construction and their implications for ecology
Laland, K. N., Odling-Smee, F. J., & Feldman, M. W. (1999) · Proceedings of the National Academy of Sciences · doi:10.1073/pnas.96.18.10242 · Cited by 624
Prochlorococcus: the structure and function of collective diversity
Biller, S. J., Berube, P. M., Lindell, D., & Chisholm, S. W. (2014) · Nature Reviews Microbiology · doi:10.1038/nrmicro3378 · Cited by 602
Negative Epistasis Between Beneficial Mutations in an Evolving Bacterial Population
Khan, A., Dinh, D. M., Schneider, D., Lenski, R. E., & Cooper, T. F. (2011) · Science · doi:10.1126/science.1203801 · Cited by 602
Long-Term Dynamics of Adaptation in Asexual Populations
Wiser, M. J., Ribeck, N., & Lenski, R. E. (2013) · Science · doi:10.1126/science.1243357 · Cited by 592
Beneficial Mutation–Selection Balance and the Effect of Linkage on Positive Selection
Desai, M. M., & Fisher, D. S. (2007) · Genetics · doi:10.1534/genetics.106.067678 · Cited by 590
Mutant phenotypes for thousands of bacterial genes of unknown function
Price, M. N., Wetmore, K. M., Waters, R. J., Callaghan, M., Ray, J., Liu, H., Kuehl, J. V., Melnyk, R. A., Lamson, J. S., Suh, Y., et al. (2018) · Nature · doi:10.1038/s41586-018-0124-0 · Cited by 576
Self-citationTempo and mode of genome evolution in a 50,000-generation experiment
Tenaillon, O., Barrick, J. E., Ribeck, N., Deatherage, D. E., Blanchard, J. L., Dasgupta, A., Wu, G. C., Wielgoss, S., Cruveiller, S., Médigue, C., et al. (2016) · Nature · doi:10.1038/nature18959 · Cited by 507
Global epistasis makes adaptation predictable despite sequence-level stochasticity
Kryazhimskiy, S., Rice, D. P., Jerison, E. R., & Desai, M. M. (2014) · Science · doi:10.1126/science.1250939 · Cited by 504
MOLECULAR EVOLUTION OVER THE MUTATIONAL LANDSCAPE
Gillespie, J. H. (1984) · Evolution · doi:10.1111/j.1558-5646.1984.tb00380.x · Cited by 500
Wetmore, K. M., Price, M. N., Waters, R. J., Lamson, J. S., He, J., Hoover, C. A., Blow, M. J., Bristow, J. D., Butland, G. P., Arkin, A. P., et al. (2015) · mBio · doi:10.1128/mbio.00306-15 · Cited by 480
Self-citationQuantitative evolutionary dynamics using high-resolution lineage tracking
Levy, S. F., Blundell, J. R., Venkataram, S., Petrov, D. A., Fisher, D. S., & Sherlock, G. (2015) · Nature · doi:10.1038/nature14279 · Cited by 461
Takahashi, Y., & Tokumoto, U. (2002) · Journal of Biological Chemistry · doi:10.1074/jbc.c200365200 · Cited by 456
Adaptive Evolution within Gut Microbiomes of Healthy People
Zhao, S., Lieberman, T. D., Poyet, M., Kauffman, K. M., Gibbons, S. M., Groussin, M., Xavier, R. J., & Alm, E. J. (2019) · Cell Host & Microbe · doi:10.1016/j.chom.2019.03.007 · Cited by 434
The Population Genetics of Adaptation: The Distribution of Factors Fixed during Adaptive Evolution
Orr, H. A. (1998) · Evolution · doi:10.2307/2411226 · Cited by 402
Evolutionary dynamics of bacteria in the gut microbiome within and across hosts
Garud, N. R., Good, B. H., Hallatschek, O., & Pollard, K. S. (2019) · PLoS Biology · doi:10.1371/journal.pbio.3000102 · Cited by 353
Self-citationMicrobial ecology of the cystic fibrosis lung
Harrison, F. (2007) · Microbiology · doi:10.1099/mic.0.2006/004077-0 · Cited by 345
The Speed of Evolution and Maintenance of Variation in Asexual Populations
Desai, M. M., Fisher, D. S., & Murray, A. W. (2007) · Current Biology · doi:10.1016/j.cub.2007.01.072 · Cited by 319
Molecular Evolution Over the Mutational Landscape
Gillespie, J. H. (1984) · Evolution · doi:10.2307/2408444 · Cited by 294
Long-Term Experimental Evolution in Escherichia coli. VIII. Dynamics of a Balanced Polymorphism
Rozen, D. E., & Lenski, R. E. (2000) · The American Naturalist · doi:10.1086/303299 · Cited by 291
Diversity and asynchrony in soil microbial communities stabilizes ecosystem functioning
Wagg, C., Hautier, Y., Pellkofer, S., Banerjee, S., Schmid, B., & van der Heijden, M. G. A. (2021) · eLife · doi:10.7554/elife.62813 · Cited by 286
Evolution of Escherichia coli During Growth in a Constant Environment
Helling, R. B., Vargas, C. N., & Adams, J. (1987) · Genetics · doi:10.1093/genetics/116.3.349 · Cited by 283
The Distribution of Fitness Effects Among Beneficial Mutations
Orr, H. A. (2003) · Genetics · doi:10.1093/genetics/163.4.1519 · Cited by 271
Development of a Comprehensive Genotype-to-Fitness Map of Adaptation-Driving Mutations in Yeast
Venkataram, S., Dunn, B. L., Li, Y., Agarwala, A., Chang, J. K., Ebel, E. R., Geiler‐Samerotte, K., Hérissant, L., Blundell, J. R., Levy, S. F., et al. (2016) · Cell · doi:10.1016/j.cell.2016.08.002 · Cited by 263
Vasi, F., Travisano, M., & Lenski, R. E. (1994) · The American Naturalist · doi:10.1086/285685 · Cited by 253
Distribution of fixed beneficial mutations and the rate of adaptation in asexual populations
Good, B. H., Rouzine, I. M., Balick, D. J., Hallatschek, O., & Desai, M. M. (2012) · Proceedings of the National Academy of Sciences · doi:10.1073/pnas.1119910109 · Cited by 242
Self-citationParallel Evolutionary Dynamics of Adaptive Diversification in Escherichia coli
Herron, M. D., & Doebeli, M. (2013) · PLoS Biology · doi:10.1371/journal.pbio.1001490 · Cited by 203
SELECTIVE MECHANISMS IN BACTERIAPreprint
Atwood, K. C., Schneider, L. K., & Rryan, F. J. (1951) · Cold Spring Harbor Symposia on Quantitative Biology · doi:10.1101/sqb.1951.016.01.026 · Cited by 196
High-resolution lineage tracking reveals travelling wave of adaptation in laboratory yeast
Ba, A. N. N., Cvijović, I., Echenique, J. I. R., Lawrence, K. R., Rego‐Costa, A., Liu, X., Levy, S. F., & Desai, M. M. (2019) · Nature · doi:10.1038/s41586-019-1749-3 · Cited by 160
Human Gut Microbiota: Toward an Ecology of Disease
Selber‐Hnatiw, S., Rukundo, B., Ahmadi, M., Akoubi, H., Al-Bizri, H., Aliu, A. F., Ambeaghen, T. U., Avetisyan, L., Bahar, I., Baird, A., et al. (2017) · Frontiers in Microbiology · doi:10.3389/fmicb.2017.01265 · Cited by 151
Death and cannibalism in a seasonal environment facilitate bacterial coexistence
Rozen, D. E., Philippe, N., de Visser, J. A. G. M., Lenski, R. E., & Schneider, D. (2008) · Ecology Letters · doi:10.1111/j.1461-0248.2008.01257.x · Cited by 138
Fluid Communities: A Competitive, Scalable and Diverse Community Detection Algorithm
Parés, F., García-Gasulla, D., Vilalta, A., Moreno, J., Ayguadé, E., Labarta, J., Cortés, U., & Suzumura, T. (2017) · Studies in computational intelligence · doi:10.1007/978-3-319-72150-7_19 · Cited by 131
Epistasis and Allele Specificity in the Emergence of a Stable Polymorphism in Escherichia coli
Plucain, J., Hindré, T., Gac, M. L., Tenaillon, O., Cruveiller, S., Médigue, C., Leiby, N., Harcombe, W. R., Marx, C. J., Lenski, R. E., et al. (2014) · Science · doi:10.1126/science.1248688 · Cited by 128
Kinsler, G., Geiler‐Samerotte, K., & Petrov, D. A. (2020) · eLife · doi:10.7554/elife.61271 · Cited by 114
Global epistasis emerges from a generic model of a complex trait
Reddy, G., & Desai, M. M. (2021) · eLife · doi:10.7554/elife.64740 · Cited by 111
Single nucleotide mapping of trait space reveals Pareto fronts that constrain adaptation
Li, Y., Petrov, D. A., & Sherlock, G. J. (2019) · Nature Ecology & Evolution · doi:10.1038/s41559-019-0993-0 · Cited by 107
Gac, M. L., Plucain, J., Hindré, T., Lenski, R. E., & Schneider, D. (2012) · Proceedings of the National Academy of Sciences · doi:10.1073/pnas.1207091109 · Cited by 104
Idiosyncratic epistasis leads to global fitness–correlated trends
Bakerlee, C. W., Ba, A. N. N., Shulgina, Y., Echenique, J. I. R., & Desai, M. M. (2022) · Science · doi:10.1126/science.abm4774 · Cited by 100
Higher-fitness yeast genotypes are less robust to deleterious mutations
Johnson, M. S., Martsul, A., Kryazhimskiy, S., & Desai, M. M. (2019) · Science · doi:10.1126/science.aay4199 · Cited by 98
High-Throughput Identification of Adaptive Mutations in Experimentally Evolved Yeast Populations
Payen, C., Sunshine, A. B., Ong, G. T., Pogachar, J. L., Zhao, W. D., & Dunham, M. J. (2016) · PLoS Genetics · doi:10.1371/journal.pgen.1006339 · Cited by 87
The Impact of Macroscopic Epistasis on Long-Term Evolutionary Dynamics
Good, B. H., & Desai, M. M. (2014) · Genetics · doi:10.1534/genetics.114.172460 · Cited by 78
Self-citationRozen, D. E., Schneider, D., & Lenski, R. E. (2005) · Journal of Molecular Evolution · doi:10.1007/s00239-004-0322-2 · Cited by 78
Hidden Complexity of Yeast Adaptation under Simple Evolutionary Conditions
Li, Y., Venkataram, S., Agarwala, A., Dunn, B. L., Petrov, D. A., Sherlock, G., & Fisher, D. S. (2018) · Current Biology · doi:10.1016/j.cub.2018.01.009 · Cited by 71
Großkopf, T., Consuegra, J., Gaffé, J., Willison, J. C., Lenski, R. E., Soyer, O. S., & Schneider, D. (2016) · BMC Evolutionary Biology · doi:10.1186/s12862-016-0733-x · Cited by 69
Good, B. H., Martis, S., & Hallatschek, O. (2018) · Proceedings of the National Academy of Sciences · doi:10.1073/pnas.1807530115 · Cited by 68
Self-citationCore Genes Evolve Rapidly in the Long-Term Evolution Experiment with Escherichia coli
Maddamsetti, R., Hatcher, P. J., Green, A. G., Williams, B. L., Marks, D. S., & Lenski, R. E. (2017) · Genome Biology and Evolution · doi:10.1093/gbe/evx064 · Cited by 55
Sousa, A., Ramiro, R. S., Barroso-Batista, J., Güleresi, D., Lourenço, M., & Gordo, I. (2017) · Molecular Biology and Evolution · doi:10.1093/molbev/msx221 · Cited by 54
The dynamics of adaptive genetic diversity during the early stages of clonal evolution
Blundell, J. R., Schwartz, K., Francois, D., Fisher, D. S., Sherlock, G. J., & Levy, S. F. (2018) · Nature Ecology & Evolution · doi:10.1038/s41559-018-0758-1 · Cited by 54
Quantifying rapid bacterial evolution and transmission within the mouse intestine
Vasquez, K. S., Willis, L., Cira, N., Ng, K. M., Pedro, M. F., Aranda-Díaz, A., Rajendram, M., Yu, F. B., Higginbottom, S. K., Neff, N. F., et al. (2021) · Cell Host & Microbe · doi:10.1016/j.chom.2021.08.003 · Cited by 51
Self-citationEx Uno Plures: Clonal Reinforcement Drives Evolution of a Simple Microbial Community
Kinnersley, M. A., Wenger, J. W., Kroll, E., Adams, J., Sherlock, G., & Rosenzweig, F. (2014) · PLoS Genetics · doi:10.1371/journal.pgen.1004430 · Cited by 50
Frenkel, E. M., McDonald, M. J., Dyken, J. D. V., Kosheleva, K., Lang, G. I., & Desai, M. M. (2015) · Proceedings of the National Academy of Sciences · doi:10.1073/pnas.1506184112 · Cited by 50
The Evolutionarily Stable Distribution of Fitness Effects
Rice, D. P., Good, B. H., & Desai, M. M. (2015) · Genetics · doi:10.1534/genetics.114.173815 · Cited by 43
Self-citationMutualism-enhancing mutations dominate early adaptation in a two-species microbial community
Venkataram, S., Kuo, H.-Y., Hom, E. F. Y., & Kryazhimskiy, S. (2023) · Nature Ecology & Evolution · doi:10.1038/s41559-022-01923-8 · Cited by 42
Bayesian point null hypothesis testing via the posterior likelihood ratio
Aitkin, M. A., Boys, R. J., & Chadwick, T. J. (2005) · Statistics and Computing · doi:10.1007/s11222-005-1310-0 · Cited by 41
EcoliNet: a database of cofunctional gene network for Escherichia coli
Kim, H., Shim, J. E., Shin, J., & Lee, I. (2015) · Database · doi:10.1093/database/bav001 · Cited by 39
Eco-evolutionary dynamics of complex social strategies in microbial communities
Harrington, K., & Sánchez, Á. (2014) · Communicative & Integrative Biology · doi:10.4161/cib.28230 · Cited by 37
Peng, F., Widmann, S., Wünsche, A., Duan, K., Donovan, K. A., Dobson, R. C. J., Lenski, R. E., & Cooper, T. F. (2017) · Molecular Biology and Evolution · doi:10.1093/molbev/msx279 · Cited by 28
Amicone, M., & Gordo, I. (2021) · Evolution · doi:10.1111/evo.14315 · Cited by 26
Mutualism-enhancing mutations dominate early adaptation in a microbial communityPreprint
Venkataram, S., Kuo, H.-Y., Hom, E. F. Y., & Kryazhimskiy, S. (2021) · bioRxiv (Cold Spring Harbor Laboratory) · doi:10.1101/2021.07.07.451547 · Cited by 8
Smith, I., & Ferrari, A. (2014) · Bayesian Analysis · doi:10.1214/14-ba877 · Cited by 6
Research works printed but not linked: 1
- NCBI GEO. Evolution of gene expression during long term coexistence in a bacterial evolution experiment. https://www.ncbi.nlm.nih.gov/geo/query/acc.cgi?acc=GSE30639 (2012).
Cited by
Sorted by citations
Whole-brain annotation and multi-connectome cell typing of Drosophila
Schlegel, P., Yin, Y., Bates, A. S., Dorkenwald, S., Eichler, K., Brooks, P., Han, D. S., Gkantia, M., dos Santos, M., Munnelly, E. J., et al. (2024) · Nature · doi:10.1038/s41586-024-07686-5 · Cited by 413
Zeng, A. G. X., Iacobucci, I., Shah, S., Mitchell, A., Wong, G., Bansal, S., Chen, D., Gao, Q., Kim, H., Kennedy, J. A., et al. (2025) · Blood Cancer Discovery · doi:10.1158/2643-3230.bcd-24-0342 · Cited by 126
Whole-brain annotation and multi-connectome cell typing quantifies circuit stereotypy in Drosophila
Schlegel, P., Yin, Y., Bates, A. S., Dorkenwald, S., Eichler, K., Brooks, P., Han, D. S., Gkantia, M., dos Santos, M., Munnelly, E. J., et al. (2023) · doi:10.1101/2023.06.27.546055 · Cited by 102
Epistasis and evolution: recent advances and an outlook for prediction
Johnson, M. S., Reddy, G., & Desai, M. M. (2023) · BMC Biology · doi:10.1186/s12915-023-01585-3 · Cited by 105
Spatial transcriptomic clocks reveal cell proximity effects in brain ageing
Sun, E., Zhou, O. Y., Hauptschein, M., Rappoport, N., Xu, L., Negredo, P. N., Liu, L. A., Rando, T. A., Zou, J., & Brunet, A. (2024) · Nature · doi:10.1038/s41586-024-08334-8 · Cited by 106
Metadata
- Authors
- Ascensao, J. A., Wetmore, K. M., Good, B. H., Arkin, A. P., & Hallatschek, O.
- Affiliations
- University of California, Berkeley (US)
- Lawrence Berkeley National Laboratory (US)
- Stanford University (US)
- Leipzig University (DE)
- Corresponding author
- Hallatschek, Oskar
- Venue
- Nature Communications
- Published
- 2023-01-16
- Volume
- 14
- Issue
- 1
- Pages
- 248-248
- ISSN
- 2041-1723 (ISSN-L)
- PMC
- PMC9842643
- OpenAlex
- W4316511358
- Cited by
- 447
- References
- 76
- Citations by year
- 2026: 74 · 2025: 172 · 2024: 145 · 2023: 53
- FWCI
- 73.88
- Type
- journal article
- Language
- en
- Open access
- gold
- doi.org
- Locations
- Nature Communications (publishedVersion, cc-by)
- bioRxiv (Cold Spring Harbor Laboratory) (acceptedVersion, cc-by-nc)
- PubMed Central (publishedVersion, cc-by)
- PubMed (publishedVersion)
- eScholarship (California Digital Library) (submittedVersion, cc-by)
- RePEc: Research Papers in Economics (submittedVersion)
- DOAJ (DOAJ: Directory of Open Access Journals) (submittedVersion, cc-by-sa)
- OSTI OAI (U.S. Department of Energy Office of Scientific and Technical Information) (submittedVersion)
- Funders
- U.S. Department of Energy (DE-AC02-05CH11231)
- National Science Foundation (1555330)
- Topics
- Life Sciences › Biochemistry, Genetics and Molecular Biology › Genetics › Evolution and Genetic Dynamics
- Life Sciences › Biochemistry, Genetics and Molecular Biology › Genetics › Bacterial Genetics and Biotechnology
- Physical Sciences › Environmental Science › Ecology › Microbial Community Ecology and Physiology
- Keywords
- fitness landscape, Escherichia coli, long-term evolution experiment, gene knockout, transposon mutagenesis, invasion fitness, epistasis, ecological diversification, community composition, fitness effects, adaptive evolution
- MeSH terms
- Adaptation, Physiological, Escherichia coli, Mutation, Genetic Fitness, Ecotype
About these checks
Registry, retraction, Cites and statistics results are computed, not judged, with one exception: a printed reference that no index lists is read once by a model before it counts as a citation error. Claims are extracted by a model and kept only when their quote appears verbatim in the text; each cited source is then checked, with a model’s help, for whether it says what the claim relies on. Those verdicts can be wrong — read the claim’s quote and the cited source before relying on one.
Statistics and arithmetic are recomputed, not judged.
Confidence bands are shown only for fields calibrated on our annotated test set. None is calibrated yet, so no band is shown.
What counts as a claim ›How we measure confidence ›How we check this ›
Are you an author, or do you see a problem with this page? Request a review
