Cited by 63

The DOI matches its Crossref record; 11 of the 11 references it cites were found in a registry or an index.

Dual targeted extracellular vesicles regulate oncogenic genes in advanced pancreatic cancer

Chiang, Chi-Ling, Ma, Yifan, Hou, Ya-Chin, Pan, Junjie, Chen, Sin-Yu, Chien, Ming-Hsien, Zhang, Zhi-Xuan, Hsu, Wei-Hsiang, Wang, Xinyu, Zhang, Jingjing, Li, Hong, Sun, Lili, Fallen, Shannon, Lee, Inyoul, Chen, Xing-Yu, Chu, Yeh-Shiu, Zhang, Chi, Cheng, Tai-Shan, Jiang, Wen, Kim, Betty Y. S., Reategui, Eduardo, Lee, Robert, Yuan, Yuan, Liu, Hsiao-Chun, Wang, Kai, Hsiao, Michael, Huang, Chi-Ying F., Shan, Yan-Shen, Lee, Andrew S., James Lee, L.·2023·Nature Communications

Abstract

Pancreatic ductal adenocarcinoma (PDAC) tumours carry multiple gene mutations and respond poorly to treatments. There is currently an unmet need for drug carriers that can deliver multiple gene cargoes to target high solid tumour burden like PDAC. Here, we report a dual targeted extracellular vesicle (dtEV) carrying high loads of therapeutic RNA that effectively suppresses large PDAC tumours in mice. The EV surface contains a CD64 protein that has a tissue targeting peptide and a humanized monoclonal antibody. Cells sequentially transfected with plasmid DNAs encoding for the RNA and protein of interest by Transwell®-based asymmetric cell electroporation release abundant targeted EVs with high RNA loading. Together with a low dose chemotherapy drug, Gemcitabine, dtEVs suppress large orthotopic PANC-1 and patient derived xenograft tumours and metastasis in mice and extended animal survival. Our work presents a clinically accessible and scalable way to produce abundant EVs for delivering multiple gene cargoes to large solid tumours.

Overview

The claims and statistics of this paper haven’t been checked yet.

Run the check — free, no account needed. It reads the open-access text and checks the sources it cites.

A few free checks a day · papers already verified open instantly · results are public

Integrity signals

Registry

Crossref · 10.1038/s41467-023-42402-3

Cites

11 of 11 references verified0 citation errors · 0 not checkable

Statistics

Figures

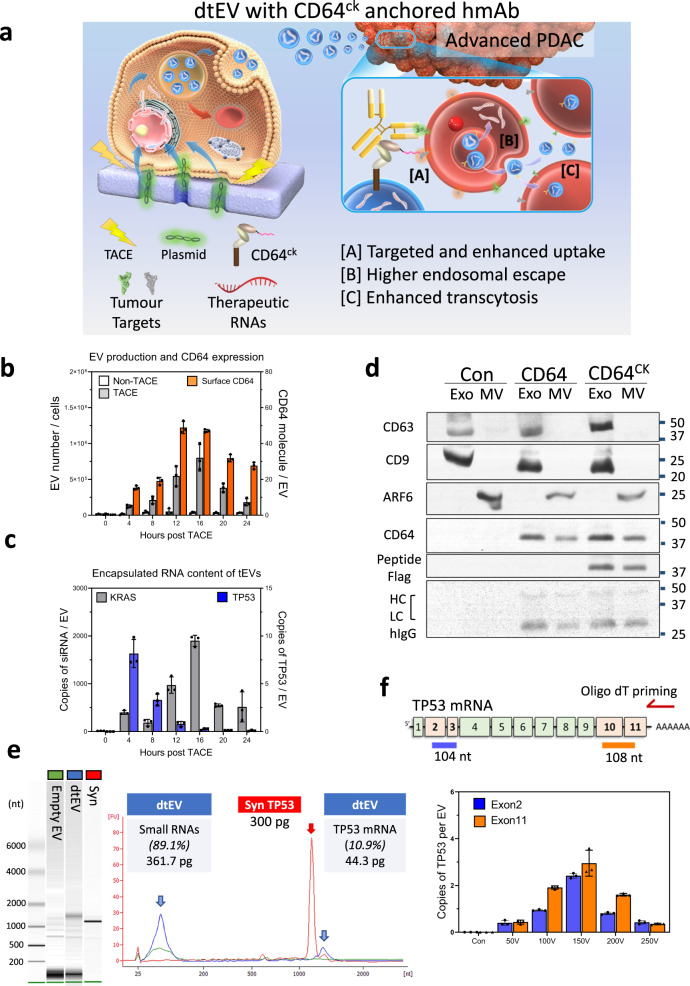
Fig. 1 Production and characterization of dtEVs. a Donor cells on the Transwell® insert are transfected with plasmid DNA from below the insert through high-electric field strength in Transwell® pores (1 μm). Cargo RNAs transcribed from the plasmids reside inside intraluminal vesicles (ILVs) within multivesicular bodies (MVBs). TACE promotes the secretion of dtEVs containing therapeutic RNAs and CD64ck protein. Clinically available humanized monoclonal antibody (hmAb) anchors on CD64ck as the second targeting ligand. The hmAb and CK peptide dual targeted EVs (dtEVs) provide [A] specific tumor targeting and affinity-enhanced cancer cell uptake (better endocytosis), [B] improved cytosol release of therapeutic RNAs (higher endosome escape), and [C] superior tissue penetration (stronger transcytosis) by CD64ck/hmAb interactions with receptors on the cancer cell membrane. b MEFs electroporated at 150 V by TACE secreted >30-fold EVs than untreated native MEFs. EV secretion peaked at ~16 h was synchronized with CD64ck expression on dtEVs surface (27.6 ± 1.9 molecules/EV on average for >24 h, n = 3 biological independent experiments). c, TP53 mRNA expression in EVs peaked within 4 h (8.2 ± 1.5 copies/EV, n = 3 biological independent experiments) while siKRASG12D expression peaked much later at 16 h (1,899.9 ± 114.5 copies/EV, n = 3 biological independent experiments). d EVs with CD64wt or CD64ck harvested from donor cells were preloaded with human IgGs and pulled down for Western blotting. Captured human IgG was on exosomes (Exo) and microvesicles (MV). Con: untreated MEFs. e Bioanalyzer electrophoresis with a synthetic TP53 mRNA reference confirmed the integrity and quantity of TP53 mRNA in dtEVs. The mass ratio of small RNAs vs. mRNA in dtEVs was ~9:1. f The integrity of vesicular TP53 mRNA was also confirmed by oligo-dT primed qPCR from the two edges of transcript as the 5′ end (exons 2 and 3, blue) and 3’ end (exons 10 and 11, orange) (n = 3 biological independent experiments). Data were presented as mean ± SD. Source data are provided as a Source data file. d, e Electrophoresis and western blot images are representative of three independent experiments.
Fig. 1 Production and characterization of dtEVs. a Donor cells on the Transwell® insert are transfected with plasmid DNA from below the insert through high-electric field strength in Transwell® pores (1 μm). Cargo RNAs transcribed from the plasmids reside inside intraluminal vesicles (ILVs) within multivesicular bodies (MVBs). TACE promotes the secretion of dtEVs containing therapeutic RNAs and CD64ck protein. Clinically available humanized monoclonal antibody (hmAb) anchors on CD64ck as the second targeting ligand. The hmAb and CK peptide dual targeted EVs (dtEVs) provide [A] specific tumor targeting and affinity-enhanced cancer cell uptake (better endocytosis), [B] improved cytosol release of therapeutic RNAs (higher endosome escape), and [C] superior tissue penetration (stronger transcytosis) by CD64ck/hmAb interactions with receptors on the cancer cell membrane. b MEFs electroporated at 150 V by TACE secreted >30-fold EVs than untreated native MEFs. EV secretion peaked at ~16 h was synchronized with CD64ck expression on dtEVs surface (27.6 ± 1.9 molecules/EV on average for >24 h, n = 3 biological independent experiments). c, TP53 mRNA expression in EVs peaked within 4 h (8.2 ± 1.5 copies/EV, n = 3 biological independent experiments) while siKRASG12D expression peaked much later at 16 h (1,899.9 ± 114.5 copies/EV, n = 3 biological independent experiments). d EVs with CD64wt or CD64ck harvested from donor cells were preloaded with human IgGs and pulled down for Western blotting. Captured human IgG was on exosomes (Exo) and microvesicles (MV). Con: untreated MEFs. e Bioanalyzer electrophoresis with a synthetic TP53 mRNA reference confirmed the integrity and quantity of TP53 mRNA in dtEVs. The mass ratio of small RNAs vs. mRNA in dtEVs was ~9:1. f The integrity of vesicular TP53 mRNA was also confirmed by oligo-dT primed qPCR from the two edges of transcript as the 5′ end (exons 2 and 3, blue) and 3’ end (exons 10 and 11, orange) (n = 3 biological independent experiments). Data were presented as mean ± SD. Source data are provided as a Source data file. d, e Electrophoresis and western blot images are representative of three independent experiments.CC BY · PubMed Central
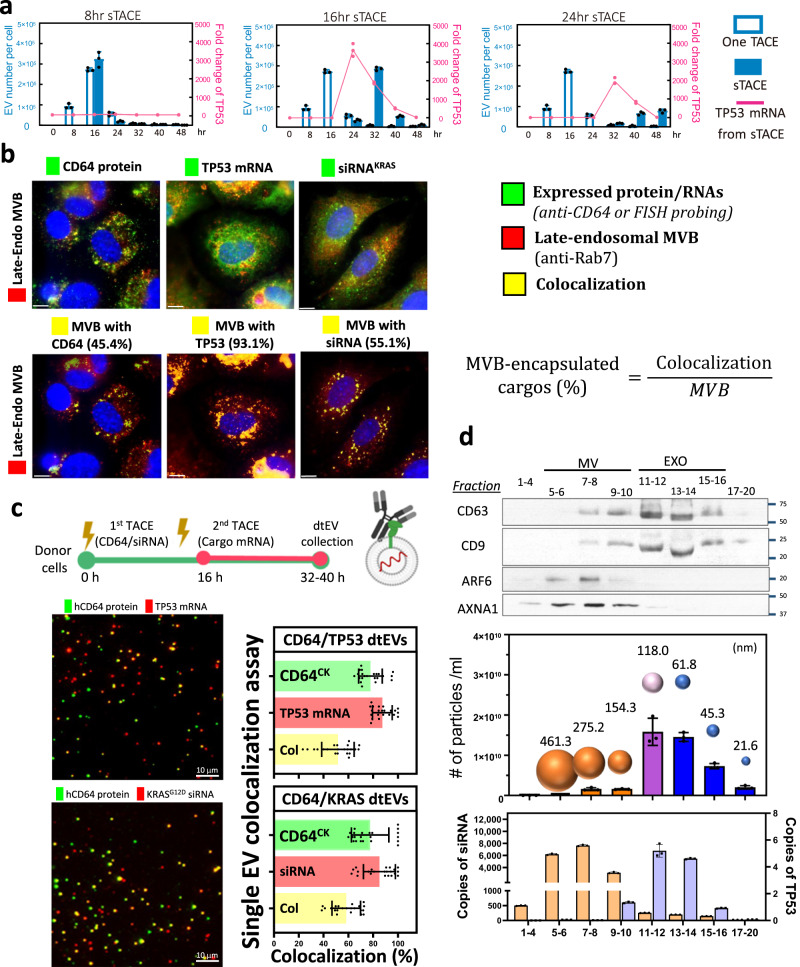
Fig. 2 Sequential TACE (sTACE) for dtEV production and its RNA cargo loading. a The sTACE was performed by delivering the CD64 plasmid first and then the TP53 plasmid DNA with a time gap of 8 h, 16 h, or 24 h in MEF cells. The optimized sTACE with 16 h gap gave the best coordination of surface CD64ck protein, TP53 mRNA loading, and EV number for our the dtEV formulation (n = 3 biological independent experiments). b Expressed CD64 protein was stained by florescence-labeled anti-CD64 antibodies, and RNA cargoes were recognized by FISH (fluorescence in situ hybridization) probes (green). The late-endosomal MVBs were stained by florescence-labeled anti-Rab7 (red). Through the proportion of colocalized versus total fluorescent signal, we estimated that ~45% MVBs contained CD64ck protein and ~93% MVBs contained TP53 mRNA at 4 h, while ~55% MVBs contained siKRASG12D at 12 h after TACE. Immunofluorescent images are representative of n = 3 biologically independent experiments. c TIRF fluorescence imaging of single dtEV shows ~55% of dtEVs co-expressed surface CD64ck and TP53 mRNA or siKRASG12D cargoes when CD64ck plasmid was delivered 16 h apart from TP53 plasmid or simultaneously with siKRAS plasmid. The colocalization ratio is 58.5 ± 2.4% for siKRAS and 51.6 ± 2.8% for TP53 mRNA (n = 3 biological independent experiments, 7 or 8 images each). d Harvested EVs from TACE stimulated MEFs were sorted by size exclusion chromatography (qEV columns, IZON) into 20 fractions in which the EV number, averaged EV size, surface protein markers, and loaded RNA/protein cargo in each fraction were characterized. By real-time PCR analysis for RNA cargoes from each fraction, TP53 mRNA was located mainly in exosomal fractions (11-14; high CD63/CD9 expression), while siKRASG12D was found in both exosomes and microvesicles (n = 3 biological independent experiments). Scale bars in b and c are 10 μm. Data were presented as mean ± SD. Source data are provided as a Source data file.
Fig. 2 Sequential TACE (sTACE) for dtEV production and its RNA cargo loading. a The sTACE was performed by delivering the CD64 plasmid first and then the TP53 plasmid DNA with a time gap of 8 h, 16 h, or 24 h in MEF cells. The optimized sTACE with 16 h gap gave the best coordination of surface CD64ck protein, TP53 mRNA loading, and EV number for our the dtEV formulation (n = 3 biological independent experiments). b Expressed CD64 protein was stained by florescence-labeled anti-CD64 antibodies, and RNA cargoes were recognized by FISH (fluorescence in situ hybridization) probes (green). The late-endosomal MVBs were stained by florescence-labeled anti-Rab7 (red). Through the proportion of colocalized versus total fluorescent signal, we estimated that ~45% MVBs contained CD64ck protein and ~93% MVBs contained TP53 mRNA at 4 h, while ~55% MVBs contained siKRASG12D at 12 h after TACE. Immunofluorescent images are representative of n = 3 biologically independent experiments. c TIRF fluorescence imaging of single dtEV shows ~55% of dtEVs co-expressed surface CD64ck and TP53 mRNA or siKRASG12D cargoes when CD64ck plasmid was delivered 16 h apart from TP53 plasmid or simultaneously with siKRAS plasmid. The colocalization ratio is 58.5 ± 2.4% for siKRAS and 51.6 ± 2.8% for TP53 mRNA (n = 3 biological independent experiments, 7 or 8 images each). d Harvested EVs from TACE stimulated MEFs were sorted by size exclusion chromatography (qEV columns, IZON) into 20 fractions in which the EV number, averaged EV size, surface protein markers, and loaded RNA/protein cargo in each fraction were characterized. By real-time PCR analysis for RNA cargoes from each fraction, TP53 mRNA was located mainly in exosomal fractions (11-14; high CD63/CD9 expression), while siKRASG12D was found in both exosomes and microvesicles (n = 3 biological independent experiments). Scale bars in b and c are 10 μm. Data were presented as mean ± SD. Source data are provided as a Source data file.CC BY · PubMed Central
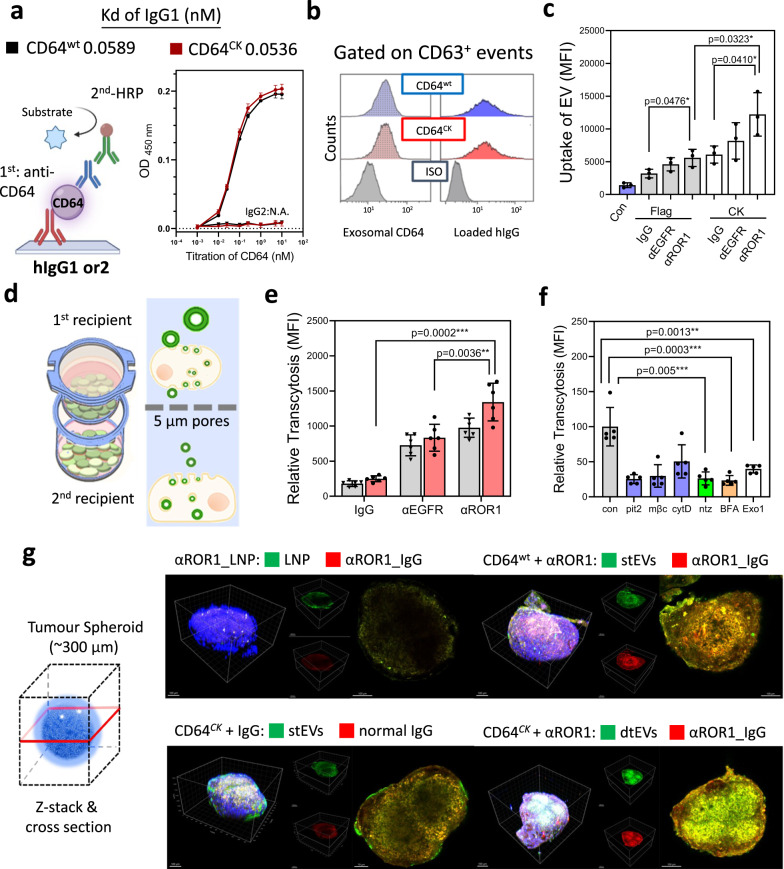
Fig. 3 Penetration and uptake characteristics of dtEVs in PANC-1 cells. a Enzyme-linked immunoassay (ELISA) shows both CD64wt (Kd = 0.0589 nM) and CD64ck (Kd = 0.0536 nM) bound to hIgG1, but not hIgG2, with high affinity (n = 3 biological independent experiments). b Flow cytometry analysis using anti-CD63 beads to capture dtEVs confirms surface CD64ck bound to hIgG. c Internalization assay using EVs labeled with fluorescent PKH67 dye shows higher cell uptake of dtEVs loaded with humanized anti-ROR1 mAb (αROR1) than humanized anti-EGFR (αEGFR) or control IgG. Uptake of dtEVs with CK peptides (12,209 ± 1914) doubled that of Flag control (5,585 ± 755.9) (n = 3 biological independent experiments). d Schematic of transcytosis assay used to quantify the entry and exit of various nanocarriers from the top to the bottom cell monolayer separated by a Transwell® insert membrane with 5 μm pores. e CD64ck_ αROR1 dtEVs displayed the greatest putative transcytosis (n = 5 biological independent experiments). f Pre-treating top cells with inhibitors of clathrin- mediated endocytosis (Pitstop 2, Pit2, 10 mM), caveolae- mediated endocytosis (Methyl-β-cyclodextrin, mβC, 10 mM) or exosomal secretion (neticonazole, Ntz, 10 mM) greatly prevented this putative transcytosis, but not inhibitor of macropinocytosis (Cytochalasin D, cytD, 10 µM). Con: no inhibitor (n = 5 biological independent experiments). g dtEVs penetrated tumor spheroids of PANC-1 cells (~300 µm) deeper than stEVs or LNPs after 24 h incubation (blue: DAPI). LNPs and EVs were labeled with PKH67 (green), while anti-hIgG was in red. Immunofluorescent images are representative of n = 3 biologically independent experiments. Scale bar in g: 100 μm. Data were presented as mean ± SD. For c–f, the data were analyzed by unpaired two-sided Student’s t test. (*p < 0.05, **p < 0.01, ***p < 0.001, ****p < 0.0001). Source data are provided as a Source data file.
Fig. 3 Penetration and uptake characteristics of dtEVs in PANC-1 cells. a Enzyme-linked immunoassay (ELISA) shows both CD64wt (Kd = 0.0589 nM) and CD64ck (Kd = 0.0536 nM) bound to hIgG1, but not hIgG2, with high affinity (n = 3 biological independent experiments). b Flow cytometry analysis using anti-CD63 beads to capture dtEVs confirms surface CD64ck bound to hIgG. c Internalization assay using EVs labeled with fluorescent PKH67 dye shows higher cell uptake of dtEVs loaded with humanized anti-ROR1 mAb (αROR1) than humanized anti-EGFR (αEGFR) or control IgG. Uptake of dtEVs with CK peptides (12,209 ± 1914) doubled that of Flag control (5,585 ± 755.9) (n = 3 biological independent experiments). d Schematic of transcytosis assay used to quantify the entry and exit of various nanocarriers from the top to the bottom cell monolayer separated by a Transwell® insert membrane with 5 μm pores. e CD64ck_ αROR1 dtEVs displayed the greatest putative transcytosis (n = 5 biological independent experiments). f Pre-treating top cells with inhibitors of clathrin- mediated endocytosis (Pitstop 2, Pit2, 10 mM), caveolae- mediated endocytosis (Methyl-β-cyclodextrin, mβC, 10 mM) or exosomal secretion (neticonazole, Ntz, 10 mM) greatly prevented this putative transcytosis, but not inhibitor of macropinocytosis (Cytochalasin D, cytD, 10 µM). Con: no inhibitor (n = 5 biological independent experiments). g dtEVs penetrated tumor spheroids of PANC-1 cells (~300 µm) deeper than stEVs or LNPs after 24 h incubation (blue: DAPI). LNPs and EVs were labeled with PKH67 (green), while anti-hIgG was in red. Immunofluorescent images are representative of n = 3 biologically independent experiments. Scale bar in g: 100 μm. Data were presented as mean ± SD. For c–f, the data were analyzed by unpaired two-sided Student’s t test. (*p < 0.05, **p < 0.01, ***p < 0.001, ****p < 0.0001). Source data are provided as a Source data file.CC BY · PubMed Central
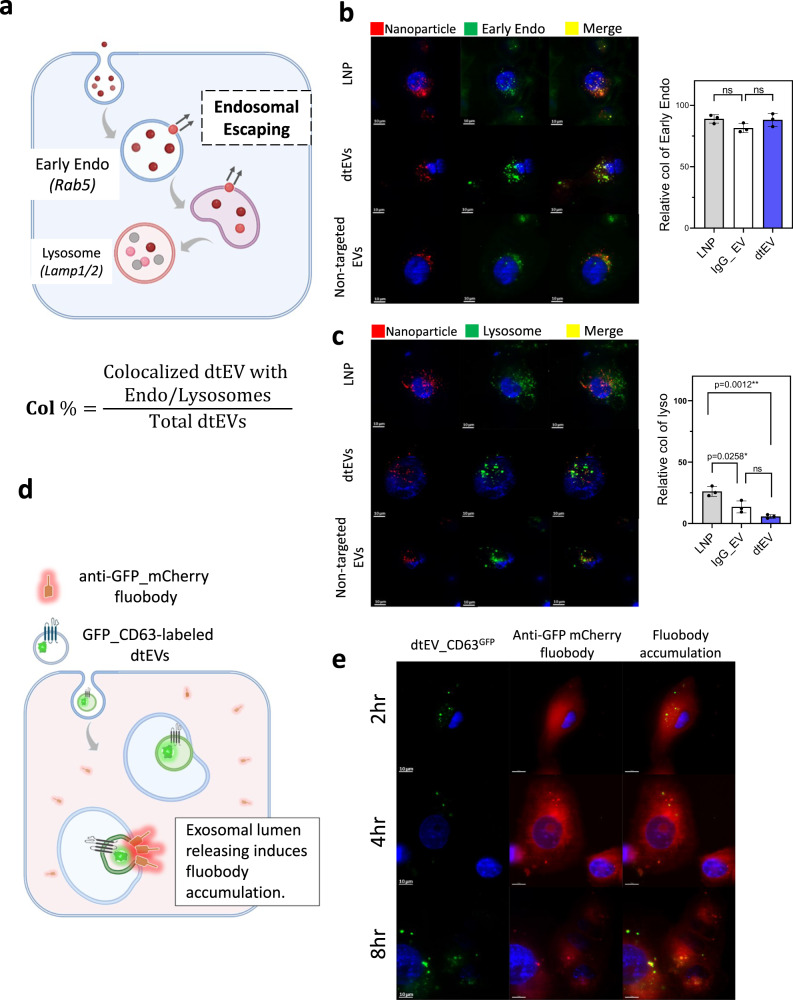
Fig. 4 Trafficking of dtEVs in recipient cells. a Nanocarriers labeled with PKH26 (red) were taken up by endocytosis and underwent vesicular trafficking in the recipient cells, from the endosome to the lysosome. b PANC-1 cells were initially treated with fluorescent nanoparticles (red) for 2 h and then fixed for co-staining with anti-Rab5 to visualize the colocalization in early endosome (green). Colocalization in recipient cells showed a similar level for LNPs, non-targeted IgG-EVs and dtEVs (colocalization % (Col%): LNP: 89.0 ± 3.5; non-targeted IgG-EV: 88.17 ± 5.2; dtEV: 81.50 ± 3.7, n = 3 biological independent experiments). c When comparing the colocalization (yellow) of LNPs, dtEVs, and non-targeted IgG-EVs, we observed less colocalization of dtEVs in lysosomes (green) after 8 h incubation (Col%: LNP: 26.17 ± 4.0; non-targeted IgG-EV: 13.53 ± 4.87; dtEV: 5.73 ± 1.45, n = 3 biological independent experiments). d A fluobody recognition system was used to monitor the interaction of dtEV lumens within vesicular trafficking. Recipient cells were pre-transfected with an anti-GFP fluobody tagged with mCherry (red), which is expressed in the cytosol. Upon release of the dtEV lumen, the cytosolic anti-GFP fluobody could recognize CD63GFP on the dtEV lumens, leading to temporary local accumulation. e PANC-1 cells expressing anti-GFP_mCherry fluobody were incubated with dtEVs containing CD63GFP for 2, 4, and 8 h. The induced accumulation of anti-GFP fluobody was observed to increase from 2 to 4 and 8 h, suggesting the potential of lumen releasing of dtEV. Fluorescent images are representative of n = 3 biologically independent experiments. Scale bar in b, c, and e are 10 μm. Data were presented as mean ± SD. For b and c, the data were analyzed by unpaired two-sided Student’s t test. (ns not significant, *p < 0.05, **p < 0.01, ***p < 0.001, ****p < 0.0001). Source data are provided as a Source data file.
Fig. 4 Trafficking of dtEVs in recipient cells. a Nanocarriers labeled with PKH26 (red) were taken up by endocytosis and underwent vesicular trafficking in the recipient cells, from the endosome to the lysosome. b PANC-1 cells were initially treated with fluorescent nanoparticles (red) for 2 h and then fixed for co-staining with anti-Rab5 to visualize the colocalization in early endosome (green). Colocalization in recipient cells showed a similar level for LNPs, non-targeted IgG-EVs and dtEVs (colocalization % (Col%): LNP: 89.0 ± 3.5; non-targeted IgG-EV: 88.17 ± 5.2; dtEV: 81.50 ± 3.7, n = 3 biological independent experiments). c When comparing the colocalization (yellow) of LNPs, dtEVs, and non-targeted IgG-EVs, we observed less colocalization of dtEVs in lysosomes (green) after 8 h incubation (Col%: LNP: 26.17 ± 4.0; non-targeted IgG-EV: 13.53 ± 4.87; dtEV: 5.73 ± 1.45, n = 3 biological independent experiments). d A fluobody recognition system was used to monitor the interaction of dtEV lumens within vesicular trafficking. Recipient cells were pre-transfected with an anti-GFP fluobody tagged with mCherry (red), which is expressed in the cytosol. Upon release of the dtEV lumen, the cytosolic anti-GFP fluobody could recognize CD63GFP on the dtEV lumens, leading to temporary local accumulation. e PANC-1 cells expressing anti-GFP_mCherry fluobody were incubated with dtEVs containing CD63GFP for 2, 4, and 8 h. The induced accumulation of anti-GFP fluobody was observed to increase from 2 to 4 and 8 h, suggesting the potential of lumen releasing of dtEV. Fluorescent images are representative of n = 3 biologically independent experiments. Scale bar in b, c, and e are 10 μm. Data were presented as mean ± SD. For b and c, the data were analyzed by unpaired two-sided Student’s t test. (ns not significant, *p < 0.05, **p < 0.01, ***p < 0.001, ****p < 0.0001). Source data are provided as a Source data file.CC BY · PubMed Central
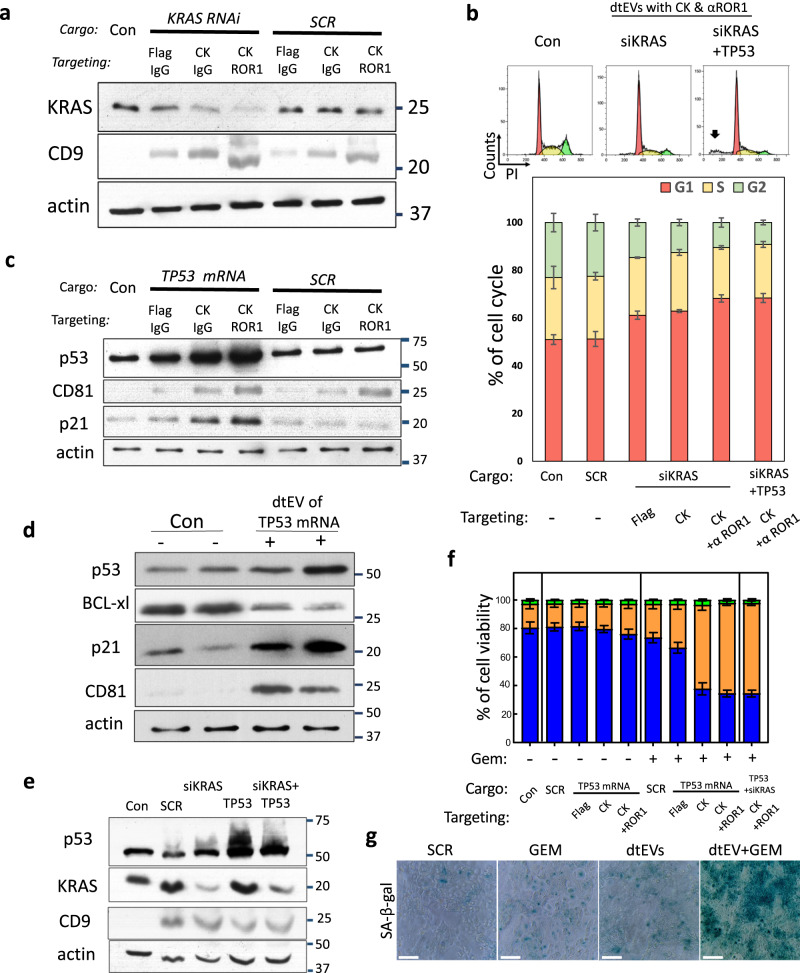
Fig. 5 In vitro efficacy of dtEVs carrying siKRASGG12D or TP53 mRNA. a Western blot of PANC-1 cells treated with various dtEVs carrying endogenous siKRASG12D or scramble siRNA (SCR) for 24 h shows silenced KRASG12D expression. b Flow cytometry histogram of DNA distribution in PANC-1 cells treated with CD64ck_αROR1 dtEVs carrying siKRASG12D or 50/50 siKRASG12D/TP53 mRNA. Significant apoptosis (black arrow) is seen with cells treated with dtEVs carrying two cargoes. Lower panel shows percentage of cells at G1, S and G2/M stages of the cell cycle in PANC-1 cells treated with various stEVs (Flag, CK) and dtEVs (CK + αROR1) carrying either siKRASG12D alone or 50/50 siKRASG12D/TP53 mRNA. c Western blot of PANC-1 cells treated with various dtEVs carrying either endogenous TP53 or scramble (SCR) mRNA for 24 h. The p53 and p21 expressions were upregulated in cells treated with dtEVs carrying TP53 mRNA. d Western blot of PANC-1 cells treated with Gemcitabine (GEM) and CD64ck_αROR1 dtEVs carrying endogenous TP53 mRNA for 24 h shows upregulated p53 and p21, and downregulated BCL-xl expressions. e Western blot of PANC-1 cells treated with GEM and CD64ck_αROR1 dtEVs carrying SCR, siKRASG12D, TP53 mRNA, or 50/50 siKRASG12D/TP53 mRNA for 24 h. f Percentage of live, dead and apoptotic (Apop) PANC-1 cells treated with various stEVs (Flag, CK) and dtEVs carrying TP53 mRNA in the presence (+) or absence (−) of GEM. Cells treated with CD64ck_αROR1 dtEVs and GEM led to high cancer cell death. g The treatment of PANC-1 cells with dtEVs, both with and without GEM, elevated oncogene-induced senescence, as evidenced by increased in SA-β-galactosidase activities. Con is EVs from untreated native MEFs. All EVs were delivered at 1 × 10⁶ EVs/cell. All error bars represent s.e.m. over three independent samples. The siRNA sequences are given in Supplementary Table 3. Scale bar in g is 100 μm. a, c, d, e, g Western blots and staining images are representative of three biological independent experiments.
Fig. 5 In vitro efficacy of dtEVs carrying siKRASGG12D or TP53 mRNA. a Western blot of PANC-1 cells treated with various dtEVs carrying endogenous siKRASG12D or scramble siRNA (SCR) for 24 h shows silenced KRASG12D expression. b Flow cytometry histogram of DNA distribution in PANC-1 cells treated with CD64ck_αROR1 dtEVs carrying siKRASG12D or 50/50 siKRASG12D/TP53 mRNA. Significant apoptosis (black arrow) is seen with cells treated with dtEVs carrying two cargoes. Lower panel shows percentage of cells at G1, S and G2/M stages of the cell cycle in PANC-1 cells treated with various stEVs (Flag, CK) and dtEVs (CK + αROR1) carrying either siKRASG12D alone or 50/50 siKRASG12D/TP53 mRNA. c Western blot of PANC-1 cells treated with various dtEVs carrying either endogenous TP53 or scramble (SCR) mRNA for 24 h. The p53 and p21 expressions were upregulated in cells treated with dtEVs carrying TP53 mRNA. d Western blot of PANC-1 cells treated with Gemcitabine (GEM) and CD64ck_αROR1 dtEVs carrying endogenous TP53 mRNA for 24 h shows upregulated p53 and p21, and downregulated BCL-xl expressions. e Western blot of PANC-1 cells treated with GEM and CD64ck_αROR1 dtEVs carrying SCR, siKRASG12D, TP53 mRNA, or 50/50 siKRASG12D/TP53 mRNA for 24 h. f Percentage of live, dead and apoptotic (Apop) PANC-1 cells treated with various stEVs (Flag, CK) and dtEVs carrying TP53 mRNA in the presence (+) or absence (−) of GEM. Cells treated with CD64ck_αROR1 dtEVs and GEM led to high cancer cell death. g The treatment of PANC-1 cells with dtEVs, both with and without GEM, elevated oncogene-induced senescence, as evidenced by increased in SA-β-galactosidase activities. Con is EVs from untreated native MEFs. All EVs were delivered at 1 × 10⁶ EVs/cell. All error bars represent s.e.m. over three independent samples. The siRNA sequences are given in Supplementary Table 3. Scale bar in g is 100 μm. a, c, d, e, g Western blots and staining images are representative of three biological independent experiments.CC BY · PubMed Central
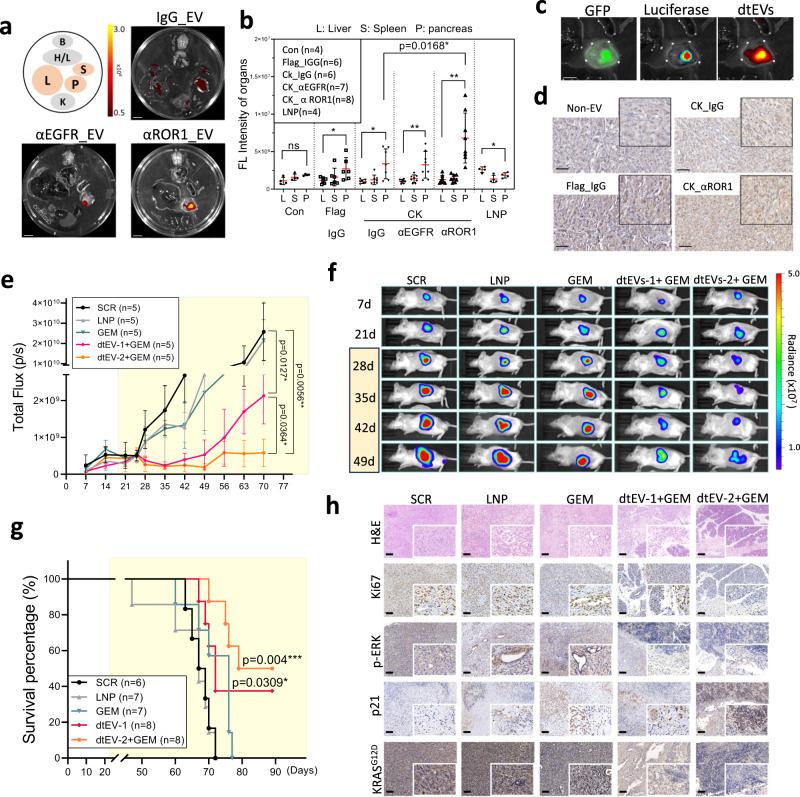
Fig. 6 Targeting and therapeutic efficacy of dtEVs in mice bearing orthotopic PANC-1 tumors. a Organ imaging shows preferential accumulation of PKH26-labeled dtEVs in orthotopic PANC-1 tumors in NOD/SCID mice [B: brain; H/L: heart and lungs; L: liver; S: spleen; P: pancreas; K: kidneys, scale bar: 10 mm]. b Tissue distribution analysis reveals PKH26-labeled dtEVs accumulate preferentially in the pancreas, with the highest accumulation seen using CD64ck_αROR1 dtEV. c Co-localization of fluorescence signal from luciferase/GFP transfected PANC-1 and PKH26-labeled EVs confirms high dtEV accumulation in the orthotopic PANC-1 tumor (scale bar: 5 mm). d Immunohistochemical staining of residual PANC-1 tumor tissue treated with different EVs shows a strong accumulation of dtEVs (brown: anti-hCD64, scale bar: 50 μm). e, f Total flux of In Vivo Imaging System (IVIS) (e) and whole-animal imaging (f) over time shows combined GEM and dtEVs carrying both siKRASG12D and TP53 mRNA treatment was best at suppressing the growth of advanced tumors. The NOD/SCID mice (n = 5 mice each group) were i.p. injected with 1 × 10¹¹ dtEVs carrying either scramble RNA, siKRASG12D (dtEVs-1), 50/50 siKRASG12D/TP53 mRNA (dtEVs-2) combined with GEM (15 mg/kg), or lipid nanoparticles (LNPs) loaded with 10-fold more synthetic TP53 mRNA and siKRASG12D. Both dtEVs and LNPs were injected 3 times per week, while GEM was injected once a week. One other control cohort was i.p. injected 15 mg/ kg Gemcitabine alone (GEM) once per week. g dtEVs significantly extended the survival of mice bearing PANC-1 orthotopic tumors (n of SCR, LNP, GEM, dtEV-1, and dtEV-2 + GEM are 6, 7, 7, 8, and 8 mice). *P < 0.05, **P < 0.01, log-rank test after Bonferroni correction. h Haematoxylin and eosin (H&E), Ki67, p-ERK, p21, KRASG12D staining of treated pancreatic tumors. Yellow marked regions in e and g are the drug treatment period. Data were presented as mean ± SD. For b and f, the data were analyzed by unpaired two-sided Student’s t test. (*p < 0.05, **p < 0.01, ***p < 0.001, ****p < 0.0001). Source data are provided as a Source data file. The siRNA sequences are given in Supplementary Table 3. Scale bar in h is 100 μm. a, c, d, h fluorescent and immunohistochemistry images are representative of three independent mice.
Fig. 6 Targeting and therapeutic efficacy of dtEVs in mice bearing orthotopic PANC-1 tumors. a Organ imaging shows preferential accumulation of PKH26-labeled dtEVs in orthotopic PANC-1 tumors in NOD/SCID mice [B: brain; H/L: heart and lungs; L: liver; S: spleen; P: pancreas; K: kidneys, scale bar: 10 mm]. b Tissue distribution analysis reveals PKH26-labeled dtEVs accumulate preferentially in the pancreas, with the highest accumulation seen using CD64ck_αROR1 dtEV. c Co-localization of fluorescence signal from luciferase/GFP transfected PANC-1 and PKH26-labeled EVs confirms high dtEV accumulation in the orthotopic PANC-1 tumor (scale bar: 5 mm). d Immunohistochemical staining of residual PANC-1 tumor tissue treated with different EVs shows a strong accumulation of dtEVs (brown: anti-hCD64, scale bar: 50 μm). e, f Total flux of In Vivo Imaging System (IVIS) (e) and whole-animal imaging (f) over time shows combined GEM and dtEVs carrying both siKRASG12D and TP53 mRNA treatment was best at suppressing the growth of advanced tumors. The NOD/SCID mice (n = 5 mice each group) were i.p. injected with 1 × 10¹¹ dtEVs carrying either scramble RNA, siKRASG12D (dtEVs-1), 50/50 siKRASG12D/TP53 mRNA (dtEVs-2) combined with GEM (15 mg/kg), or lipid nanoparticles (LNPs) loaded with 10-fold more synthetic TP53 mRNA and siKRASG12D. Both dtEVs and LNPs were injected 3 times per week, while GEM was injected once a week. One other control cohort was i.p. injected 15 mg/ kg Gemcitabine alone (GEM) once per week. g dtEVs significantly extended the survival of mice bearing PANC-1 orthotopic tumors (n of SCR, LNP, GEM, dtEV-1, and dtEV-2 + GEM are 6, 7, 7, 8, and 8 mice). *P < 0.05, **P < 0.01, log-rank test after Bonferroni correction. h Haematoxylin and eosin (H&E), Ki67, p-ERK, p21, KRASG12D staining of treated pancreatic tumors. Yellow marked regions in e and g are the drug treatment period. Data were presented as mean ± SD. For b and f, the data were analyzed by unpaired two-sided Student’s t test. (*p < 0.05, **p < 0.01, ***p < 0.001, ****p < 0.0001). Source data are provided as a Source data file. The siRNA sequences are given in Supplementary Table 3. Scale bar in h is 100 μm. a, c, d, h fluorescent and immunohistochemistry images are representative of three independent mice.CC BY · PubMed Central
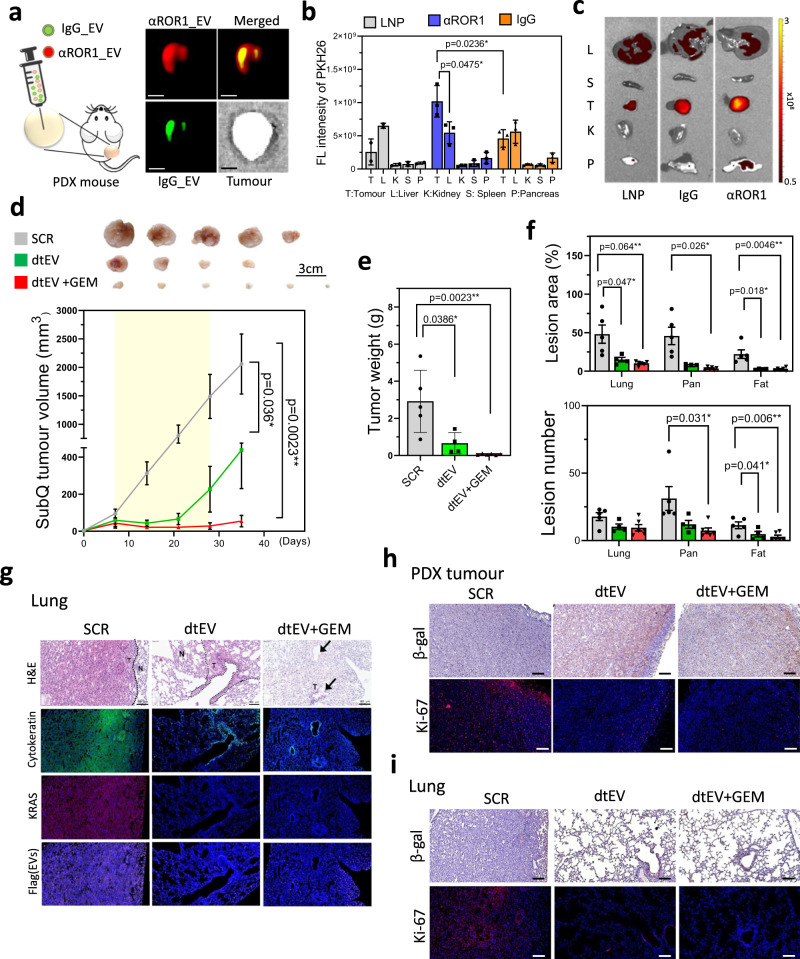
Fig. 7 Targeting and therapeutic efficacy of dtEVs in PDX mouse models. a Schematic (left) and fluorescence image (right) of subcutaneous PDX tumor intratumourally co-injected with PKH67-labeled IgG stEV (green) and PKH26-labeled CD64ck_αROR1 dtEV (red). Broader tumor penetration is seen with dtEV. (Scale bar is 5 mm) b Biodistribution (left) of PKH-labeled LNP, stEV (IgG) and dtEV (αROR1) in PDX mice bearing subcutaneously implanted pancreatic tumors shows dtEV accumulated preferentially in the tumor (n of LNP, stEV_IgG and dtEV_αROR1 = 2, 3, and 3 mice). c Organ imaging (right) confirms the tumor accumulation. Change in d, volume and e, weight of PDX tumors (with KRASG12D and TP53A138V mutations and EGFR+/ROR1+ expression) subcutaneously implanted in NOD/SCID mice after a 3-week treatment (yellow zone) with CD64ck_αROR1 dtEVs carrying scramble RNA (SCR), CD64ck_αROR1 dtEVs carrying 50/50 TP53 mRNA and siKRASG12D (dtEV), or CD64ck_αROR1 dtEVs carrying 50/50 TP53 mRNA and siKRASG12D plus 20 mg/kg GEM once per week. EVs were delivered at a dose of 1 × 10¹¹ EVs 3 times per week. (n of SCR, dtEV, and dtEV+GEM = 5, 4, and 6 mice). f Number and area of metastatic tumor lesions in different organs (n of SCR, dtEV, and dtEV+GEM = 5, 4, and 6 mice). g Lung sections from treated PDX mice with hematoxylin and eosin (H&E) stain, DAPI (blue, nuclei), anti-cytokeratin (green, tumor marker), anti-KRAS (red), and anti-Flag (purple, delivered EV marker). Metastatic lesions in the lung were decreased by dtEVs with or without GEM [N: normal; T: tumor tissue]. h Tumor tissues of mice treated with dtEV or dtEV+GEM exhibited increased β-galactosidase expression and decreased K-i67 expression. i The therapeutic effect, characterized by increased β-galactosidase expression and decreased K-i67 expression, was also observed in metastatic lesions in the lung. The treatment period is highlighted in yellow in d. (*P < 0.05, **P < 0.01, ****P < 0.0001, as determined by unpaired two-sided Student’s t test. P-values are provided for selected comparisons.) The siRNA sequences are given in Supplementary Table 3. Source data are provided as a Source data file. (Scale bar of figures g, h, and i: 100 μm) g–i fluorescent and immunohistochemistry images are representative of three independent mice.
Fig. 7 Targeting and therapeutic efficacy of dtEVs in PDX mouse models. a Schematic (left) and fluorescence image (right) of subcutaneous PDX tumor intratumourally co-injected with PKH67-labeled IgG stEV (green) and PKH26-labeled CD64ck_αROR1 dtEV (red). Broader tumor penetration is seen with dtEV. (Scale bar is 5 mm) b Biodistribution (left) of PKH-labeled LNP, stEV (IgG) and dtEV (αROR1) in PDX mice bearing subcutaneously implanted pancreatic tumors shows dtEV accumulated preferentially in the tumor (n of LNP, stEV_IgG and dtEV_αROR1 = 2, 3, and 3 mice). c Organ imaging (right) confirms the tumor accumulation. Change in d, volume and e, weight of PDX tumors (with KRASG12D and TP53A138V mutations and EGFR+/ROR1+ expression) subcutaneously implanted in NOD/SCID mice after a 3-week treatment (yellow zone) with CD64ck_αROR1 dtEVs carrying scramble RNA (SCR), CD64ck_αROR1 dtEVs carrying 50/50 TP53 mRNA and siKRASG12D (dtEV), or CD64ck_αROR1 dtEVs carrying 50/50 TP53 mRNA and siKRASG12D plus 20 mg/kg GEM once per week. EVs were delivered at a dose of 1 × 10¹¹ EVs 3 times per week. (n of SCR, dtEV, and dtEV+GEM = 5, 4, and 6 mice). f Number and area of metastatic tumor lesions in different organs (n of SCR, dtEV, and dtEV+GEM = 5, 4, and 6 mice). g Lung sections from treated PDX mice with hematoxylin and eosin (H&E) stain, DAPI (blue, nuclei), anti-cytokeratin (green, tumor marker), anti-KRAS (red), and anti-Flag (purple, delivered EV marker). Metastatic lesions in the lung were decreased by dtEVs with or without GEM [N: normal; T: tumor tissue]. h Tumor tissues of mice treated with dtEV or dtEV+GEM exhibited increased β-galactosidase expression and decreased K-i67 expression. i The therapeutic effect, characterized by increased β-galactosidase expression and decreased K-i67 expression, was also observed in metastatic lesions in the lung. The treatment period is highlighted in yellow in d. (*P < 0.05, **P < 0.01, ****P < 0.0001, as determined by unpaired two-sided Student’s t test. P-values are provided for selected comparisons.) The siRNA sequences are given in Supplementary Table 3. Source data are provided as a Source data file. (Scale bar of figures g, h, and i: 100 μm) g–i fluorescent and immunohistochemistry images are representative of three independent mice.CC BY · PubMed Central
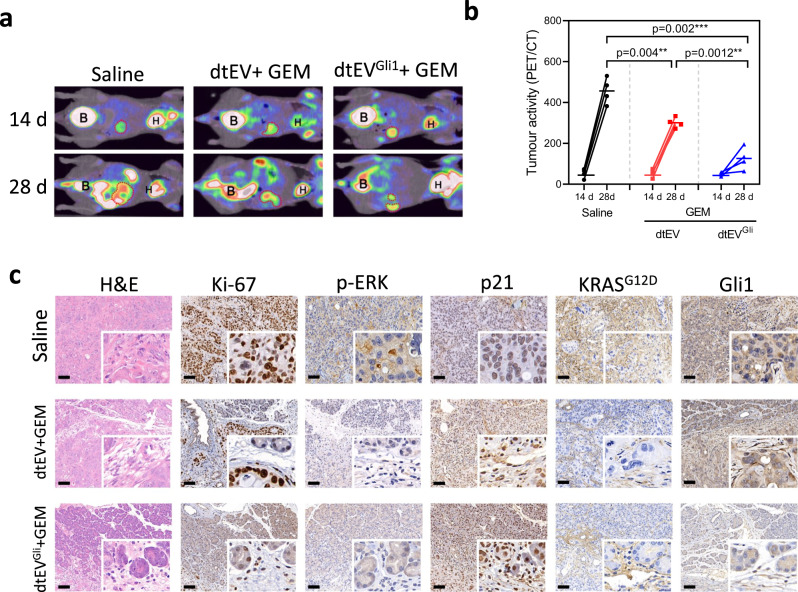
Fig. 8 Therapeutic efficacy of dtEVs in an orthotopic PDX mouse model. a Representative PET-CT images displaying the growth of orthotopic PDAC tumors in the abdominal cavity of mice (n = 4 mice each group). b Biweekly monitoring of orthotopic PDX pancreatic tumors (with KRASG12D and TP53R196* mutations, and high ROR1 and Gli1 expressions) in Balb/C-nu mice subjected to different treatments: saline, CD64ck_αROR1 dtEVs carrying 50/50 TP53 mRNA and siKRASG12D combined with 50 mg/kg/week GEM (dtEV + GEM), or CD64ck_αROR1 dtEVs carrying 1/1/1 TP53 mRNA/siKRASG12D/siGli1 combined with 50 mg/kg GEM (dtEVGli1 + GEM). The dtEVs were administered at a dose of 1 × 10¹¹ EVs three times per week, while GEM was administered once a week. Each cohort consisted of four mice (n = 4 mice, *P < 0.05, **P < 0.01, ****P < 0.0001, as determined by unpaired two-sided Student’s t test. P-values are provided for selected comparisons). c Representative histological analysis using H&E and IHC staining was performed for Ki-67, pERK, p21, KRASG12D, and Gli1 in orthotopic tumor tissues from 4 mice of each treatment group. Both dtEV and dtEVGli1, combined with GEM, exhibited suppression of Ki-67, pERK, p21, and KRASG12D. Treatment with dtEVGli1 + GEM further reduced Gli1 expression. The siRNA sequences are given in Supplementary Table 3. Source data are provided as a Source data file. (Scale bar in c: 100 μm).
Fig. 8 Therapeutic efficacy of dtEVs in an orthotopic PDX mouse model. a Representative PET-CT images displaying the growth of orthotopic PDAC tumors in the abdominal cavity of mice (n = 4 mice each group). b Biweekly monitoring of orthotopic PDX pancreatic tumors (with KRASG12D and TP53R196* mutations, and high ROR1 and Gli1 expressions) in Balb/C-nu mice subjected to different treatments: saline, CD64ck_αROR1 dtEVs carrying 50/50 TP53 mRNA and siKRASG12D combined with 50 mg/kg/week GEM (dtEV + GEM), or CD64ck_αROR1 dtEVs carrying 1/1/1 TP53 mRNA/siKRASG12D/siGli1 combined with 50 mg/kg GEM (dtEVGli1 + GEM). The dtEVs were administered at a dose of 1 × 10¹¹ EVs three times per week, while GEM was administered once a week. Each cohort consisted of four mice (n = 4 mice, *P < 0.05, **P < 0.01, ****P < 0.0001, as determined by unpaired two-sided Student’s t test. P-values are provided for selected comparisons). c Representative histological analysis using H&E and IHC staining was performed for Ki-67, pERK, p21, KRASG12D, and Gli1 in orthotopic tumor tissues from 4 mice of each treatment group. Both dtEV and dtEVGli1, combined with GEM, exhibited suppression of Ki-67, pERK, p21, and KRASG12D. Treatment with dtEVGli1 + GEM further reduced Gli1 expression. The siRNA sequences are given in Supplementary Table 3. Source data are provided as a Source data file. (Scale bar in c: 100 μm).CC BY · PubMed Central

Verification

Claims the paper makes

The claims and statistics of this paper haven’t been checked yet.

Run the check — free, no account needed. It reads the open-access text and checks the sources it cites.

A few free checks a day · papers already verified open instantly · results are public

Claims other papers make about this one

Each is checked against this paper’s own text: does it say what the citing paper says it does?

Self-check

Percentages, sums and reported differences re-computed from the paper’s own numbers.

The self-check needs the paper’s full text.

Citations

Cites

Show all 11 references

Research works printed but not linked: 35

  1. Siegel, R. L., Miller, K. D., Fuchs, H. E. & Jemal, A. Cancer Statistics, 2021. CA Cancer J. Clin. 71, 7–33 (2021). · DOI · Paper page
  2. Kim, M. P. et al. Oncogenic KRAS recruits an expansive transcriptional network through mutant p53 to drive pancreatic cancer metastasis. Cancer Discov. 11, 2094–2111 (2021). · DOI
  3. Shirley, J. L., de Jong, Y. P., Terhorst, C. & Herzog, R. W. Immune responses to viral gene therapy vectors. Mol. Ther. 28, 709–722 (2020). · DOI · Paper page
  4. Witwer, K. W. & Wolfram, J. Extracellular vesicles versus synthetic nanoparticles for drug delivery. Nat. Rev. Mater. 6, 103–106 (2021). · DOI
  5. Herrmann, I. K., Wood, M. J. A. & Fuhrmann, G. Extracellular vesicles as a next-generation drug delivery platform. Nat. Nanotechnol. 16, 748–759 (2021). · DOI · Paper page
  6. Alvarez-Erviti, L. et al. Delivery of siRNA to the mouse brain by systemic injection of targeted exosomes. Nat. Biotechnol. 29, 341–345 (2011). · DOI · Paper page
  7. Kojima, R. et al. Designer exosomes produced by implanted cells intracerebrally deliver therapeutic cargo for Parkinson’s disease treatment. Nat. Commun. 9, 1305 (2018). · DOI · Paper page
  8. Joyce, J. A. et al. Stage-specific vascular markers revealed by phage display in a mouse model of pancreatic islet tumorigenesis. Cancer Cell 4, 393–403 (2003). · DOI · Paper page
  9. Dekkers, G. et al. Affinity of human IgG subclasses to mouse Fc gamma receptors. MAbs 9, 767–773 (2017). · DOI · Paper page
  10. Cui, B. et al. Targeting ROR1 inhibits epithelial-mesenchymal transition and metastasis. Cancer Res. 73, 3649–3660 (2013). · DOI · Paper page
  11. Boukany, P. E. et al. Nanochannel electroporation delivers precise amounts of biomolecules into living cells. Nat. Nanotechnol. 6, 747–754 (2011). · DOI
  12. Nguyen, L. T. H. et al. An immunogold single extracellular vesicular RNA and protein ((Au) SERP) biochip to predict responses to immunotherapy in non-small cell lung cancer patients. J. Extracell. Vesicles 11, e12258 (2022). · DOI
  13. Hu, J. et al. A signal-amplifiable biochip quantifies extracellular vesicle-associated RNAs for early cancer detection. Nat. Commun. 8, 1683 (2017).
  14. Li, M. et al. Structural basis of dual Ca(2+)/pH regulation of the endolysosomal TRPML1 channel. Nat. Struct. Mol. Biol. 24, 205–213 (2017). · DOI
  15. Morad, G. et al. Tumor-derived extracellular vesicles breach the intact blood-brain barrier via transcytosis. ACS Nano 13, 13853–13865 (2019). · DOI
  16. Ghetie, V. & Ward, E. S. Transcytosis and catabolism of antibody. Immunol. Res. 25, 97–113 (2002). · DOI
  17. Dutta, D., Williamson, C. D., Cole, N. B. & Donaldson, J. G. Pitstop 2 is a potent inhibitor of clathrin-independent endocytosis. PLoS ONE 7, e45799 (2012). · DOI
  18. Le, P. U., Guay, G., Altschuler, Y. & Nabi, I. R. Caveolin-1 is a negative regulator of caveolae-mediated endocytosis to the endoplasmic reticulum. J. Biol. Chem. 277, 3371–3379 (2002). · DOI
  19. Datta, A. et al. High-throughput screening identified selective inhibitors of exosome biogenesis and secretion: a drug repurposing strategy for advanced cancer. Sci. Rep. 8, 8161 (2018). · DOI
  20. Joshi, B. S., de Beer, M. A., Giepmans, B. N. G. & Zuhorn, I. S. Endocytosis of extracellular vesicles and release of their cargo from endosomes. ACS Nano 14, 4444–4455 (2020). · DOI
  21. Bonsergent, E. et al. Quantitative characterization of extracellular vesicle uptake and content delivery within mammalian cells. Nat. Commun. 12, 1864 (2021). · DOI
  22. Frank, P. G., Pedraza, A., Cohen, D. E. & Lisanti, M. P. Adenovirus-mediated expression of caveolin-1 in mouse liver increases plasma high-density lipoprotein levels. Biochemistry 40, 10892–10900 (2001). · DOI
  23. Di Pasquale, G. & Chiorini, J. A. AAV transcytosis through barrier epithelia and endothelium. Mol. Ther. 13, 506–516 (2006). · DOI · Paper page
  24. Xiao, P. J. & Samulski, R. J. Cytoplasmic trafficking, endosomal escape, and perinuclear accumulation of adeno-associated virus type 2 particles are facilitated by microtubule network. J. Virol. 86, 10462–10473 (2012). · DOI
  25. Vincent, A., Herman, J., Schulick, R., Hruban, R. H. & Goggins, M. Pancreatic cancer. Lancet 378, 607–620 (2011). · DOI
  26. Lee, K. E. & Bar-Sagi, D. Oncogenic KRas suppresses inflammation-associated senescence of pancreatic ductal cells. Cancer Cell 18, 448–458 (2010). · DOI
  27. Shirole, N. H. et al. TP53 exon-6 truncating mutations produce separation of function isoforms with pro-tumorigenic functions. Elife 6, e25532 (2017). · DOI
  28. Rajurkar, M. et al. The activity of Gli transcription factors is essential for Kras-induced pancreatic tumorigenesis. Proc. Natl Acad. Sci. USA 109, E1038–1047 (2012). · DOI
  29. Ji, Z., Mei, F. C., Xie, J. & Cheng, X. Oncogenic KRAS activates hedgehog signaling pathway in pancreatic cancer cells. J. Biol. Chem. 282, 14048–14055 (2007). · DOI
  30. Wang, Y. et al. Oncogenic functions of gli1 in pancreatic adenocarcinoma are supported by its PRMT1-mediated methylation. Cancer Res. 76, 7049–7058 (2016). · DOI
  31. Jia, Y. et al. The role of GLI-SOX2 signaling axis for gemcitabine resistance in pancreatic cancer. Oncogene 38, 1764–1777 (2019). · DOI
  32. Alvarez-Erviti, L. et al. Delivery of siRNA to the mouse brain by systemic injection of targeted exosomes. Nat. Biotechnol. 29, 341–U179 (2011). · DOI · Paper page
  33. Kim, M. S. et al. Engineering macrophage-derived exosomes for targeted paclitaxel delivery to pulmonary metastases: in vitro and in vivo evaluations. Nanomedicine 14, 195–204 (2018). · DOI · Paper page
  34. Gabizon, A. & Papahadjopoulos, D. Liposome formulations with prolonged circulation time in blood and enhanced uptake by tumors. Proc. Natl Acad. Sci. USA 85, 6949–6953 (1988). · DOI
  35. Chiang, C. L. et al. ROR1-targeted delivery of miR-29b induces cell cycle arrest and therapeutic benefit in vivo in a CLL mouse model. Blood 134, 432–444 (2019). · DOI

Cited by

Sorted by citations

Metadata

Authors
Chiang, C.-L., Ma, Y., Hou, Y.-C., Pan, J., Chen, S.-Y., Chien, M.-H., Zhang, Z.-X., Hsu, W.-H., Wang, X., Zhang, J., Li, H., Sun, L., Fallen, S., Lee, I., Chen, X.-Y., Chu, Y.-S., Zhang, C., Cheng, T.-S., Jiang, W., Kim, B. Y. S., Reategui, E., Lee, R., Yuan, Y., Liu, H.-C., Wang, K., Hsiao, M., Huang, C.-Y. F., Shan, Y.-S., Lee, A. S., & James Lee, L.
Venue
Nature Communications
Published
2023-10-23
Volume
14
Issue
1
ISSN
2041-1723
Cited by
63
References
11
Language
en
Funders
National Science and Technology Council

About these checks

Registry, retraction, Cites and statistics results are computed, not judged, with one exception: a printed reference that no index lists is read once by a model before it counts as a citation error. Claims are extracted by a model and kept only when their quote appears verbatim in the text; each cited source is then checked, with a model’s help, for whether it says what the claim relies on. Those verdicts can be wrong — read the claim’s quote and the cited source before relying on one.

Statistics and arithmetic are recomputed, not judged.

Confidence bands are shown only for fields calibrated on our annotated test set. None is calibrated yet, so no band is shown.

What counts as a claim ›How we measure confidence ›How we check this ›

Are you an author, or do you see a problem with this page? Request a review