

The DOI matches its Crossref record; 53 of the 54 references it cites were found in a registry or an index.
UniKP: a unified framework for the prediction of enzyme kinetic parameters
Open accessPublished version of a preprint
Abstract
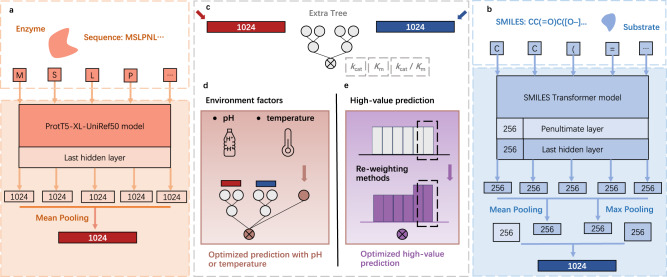
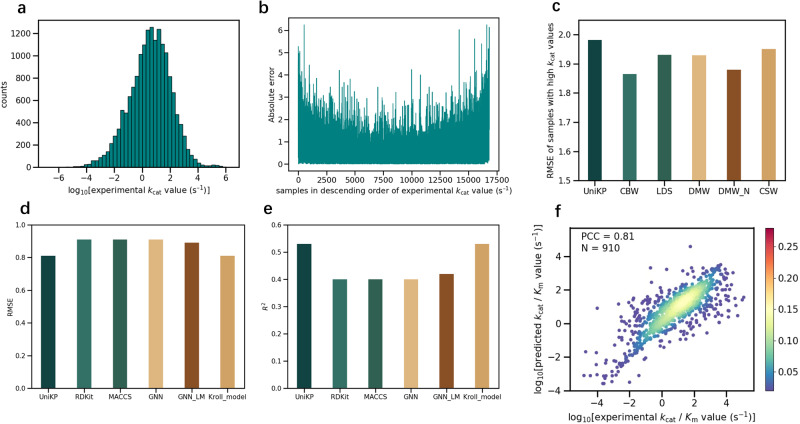
Prediction of enzyme kinetic parameters is essential for designing and optimizing enzymes for various biotechnological and industrial applications, but the limited performance of current prediction tools on diverse tasks hinders their practical applications. Here, we introduce UniKP, a unified framework based on pretrained language models for the prediction of enzyme kinetic parameters, including enzyme turnover number ( k cat ), Michaelis constant ( K m ), and catalytic efficiency ( k cat / K m ), from protein sequences and substrate structures. A two-layer framework derived from UniKP (EF-UniKP) has also been proposed to allow robust k cat prediction in considering environmental factors, including pH and temperature. In addition, four representative re-weighting methods are systematically explored to successfully reduce the prediction error in high-value prediction tasks. We have demonstrated the application of UniKP and EF-UniKP in several enzyme discovery and directed evolution tasks, leading to the identification of new enzymes and enzyme mutants with higher activity. UniKP is a valuable tool for deciphering the mechanisms of enzyme kinetics and enables novel insights into enzyme engineering and their industrial applications.
Overview
The claims and statistics of this paper haven’t been checked yet.
Run the check — free, no account needed. It reads the open-access text and checks the sources it cites.
Integrity signals
Registry
Cites
Statistics
Figures
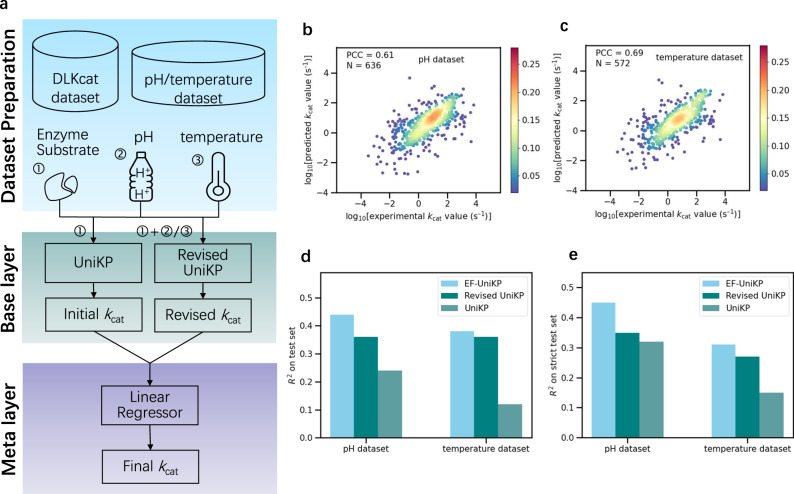
Verification
Claims the paper makes
The claims and statistics of this paper haven’t been checked yet.
Run the check — free, no account needed. It reads the open-access text and checks the sources it cites.
Self-check
Percentages, sums and reported differences re-computed from the paper’s own numbers.
The self-check needs the paper’s full text.
Citations
Cites
Vaswani, A., Shazeer, N., Parmar, N., Uszkoreit, J., Jones, L., Gomez, A. N., Kaiser, L., & Polosukhin, I. (2017) · arXiv · doi:10.48550/arxiv.1706.03762 · Cited by 120,404
Basic local alignment search tool
Altschul, S. F., Gish, W., Miller, W., Myers, E. W., & Lipman, D. J. (1990) · Journal of Molecular Biology · doi:10.1006/jmbi.1990.9999 · Cited by 98,669
BERT: Pre-training of Deep Bidirectional Transformers for Language Understanding
Devlin, J., Chang, M.-W., Lee, K., & Toutanova, K. (2018) · arXiv · doi:10.48550/arxiv.1810.04805 · Cited by 73,173
ImageNet: A large-scale hierarchical image database
Deng, J., Dong, W., Socher, R., Li, L.-J., Li, K., & Fei-Fei, L. (2009) · 2009 IEEE Conference on Computer Vision and Pattern Recognition · doi:10.1109/cvpr.2009.5206848 · Cited by 65,333
SMOTE synthetic minority over-sampling technique
Chawla, N. V., Bowyer, K. W., Hall, L. O., & Kegelmeyer, W. P. (2002) · Journal of Artificial Intelligence Research · doi:10.1613/jair.953 · Cited by 32,865
UniProt: the Universal Protein Knowledgebase in 2023
The UniProt Consortium, Bateman, A., Martin, M.-J., Orchard, S., Magrane, M., Ahmad, S., Alpi, E., Bowler-Barnett, E. H., Britto, R., Bye-A-Jee, H., et al. (2023) · Nucleic Acids Research · doi:10.1093/nar/gkac1052 · Cited by 7,210
PubChem Substance and Compound databases
Kim, S., Thiessen, P. A., Bolton, E. E., Chen, J., Fu, G., Gindulyte, A., Han, L., He, J., He, S., Shoemaker, B. A., et al. (2016) · Nucleic Acids Research · doi:10.1093/nar/gkv951 · Cited by 5,436
Self-citationSupervised Machine Learning: A Review of Classification Techniques
Kotsiantis, S. B. (2007) · Informatica · Cited by 4,192
The class imbalance problem: A systematic study1
Japkowicz, N., & Stephen, S. (2002) · Intelligent Data Analysis · doi:10.3233/ida-2002-6504 · Cited by 3,295
Rives, A., Meier, J., Sercu, T., Goyal, S., Lin, Z., Liu, J., Guo, D., Ott, M., Zitnick, C. L., Ma, J., et al. (2021) · Proceedings of the National Academy of Sciences · doi:10.1073/pnas.2016239118 · Cited by 3,286
Research works printed but not linked: 4
- Honda, S. et al. Smiles transformer: Pre-trained molecular fingerprint for low data drug discovery. arXiv preprint arXiv:1911.04738 (2019). · arXiv
- Van der Maaten, L. & Hinton, G. Visualizing data using t-SNE. J. Mach. Learning Res. 9, 11 (2008).
- Kroll, A. and Lercher, M. J. Machine learning models for the prediction of enzyme properties should be tested on proteins not used for model training. bioRxiv https://doi.org/10.1101/2023.02.06.526991 (2023). · DOI
- Li, Y. Deep reinforcement learning: An overview. arXiv preprint arXiv:1701.07274 (2017). · arXiv
Cited by
Sorted by citations
Items 101–200 of 226
Redox poise in R. rubrum phototrophic growth drives large-scale changes in macromolecular pathways
Cannon, W. R., King, E., Huening, K. A., & North, J. A. (2025) · PLoS Computational Biology · doi:10.1371/journal.pcbi.1013015 · Cited by 3
Yu, J., Cheng, K., Qu, S., Wang, J., Wang, X., Zhao, C., & Li, W. (2025) · Advanced Science · doi:10.1002/advs.202512736 · Cited by 3
Accurate enzyme specificity constant prediction with iESC
Zhang, Y., Liu, L.-H., Wang, S., & Jiang, A. (2026) · Bioresource Technology · doi:10.1016/j.biortech.2026.134067 · Cited by 3
Unlocking lignocellulosic biomass: Biocatalyst-driven strategies for sustainable biofuel generation
Gokul, T. A., Kumar, K. R., Dang, K. D., Ma, Y., Veeramanikandan, V., Sudharsun, B., Pothiraj, C., Arun, A., Hussain, M., Nguyen, V., et al. (2026) · Carbon Resources Conversion · doi:10.1016/j.crcon.2026.100417 · Cited by 6
Zhou, R. H. F. L., Ma, H., Xin, T., Miao, Q., Zou, L., Hu, Q., Cheng, H., Guo, J., Mu, Y., Wang, S., et al. (2026) · Journal of Chemical Information and Modeling · doi:10.1021/acs.jcim.6c00090 · Cited by 3
Transfer learning improves predictions of enzyme kinetic parameters
Kroll, A. (2024) · Chem Catalysis · doi:10.1016/j.checat.2024.101121 · Cited by 3
Xu, X., Wei, W., Zhou, Y., Liu, J., Gao, C., Hu, G., Li, X., Wen, J. H., Liu, L., Wu, J., et al. (2025) · Chem Catalysis · doi:10.1016/j.checat.2025.101323 · Cited by 3
LICEDB: light industrial core enzyme database for industrial applications and AI enzyme design
Gong, L., Liu, F., Zhang, C., Ming, Y., Mou, Y., Yuan, Z., Jiang, H., Gao, B., Lu, F., & Zhang, L. (2025) · Database · doi:10.1093/database/baaf001 · Cited by 3
Pan, T., Cui, X., Koh, H. Y., Bi, Y., Wang, X., Zhang, Y., Hu, S., Webb, G. I., Kurgan, L., Zhang, G., et al. (2025) · bioRxiv (Cold Spring Harbor Laboratory) · doi:10.1101/2025.03.09.642294 · Cited by 3
SAKPE: A Site Attention Kinetic Parameters Prediction Method for Enzyme EngineeringPreprint
Qiu, J.-H., Lin, Z., Chen, K., Sun, T., Zhang, X., Li, Y., Tian, Y., & Wu, Y. (2025) · bioRxiv (Cold Spring Harbor Laboratory) · doi:10.1101/2025.04.30.651216 · Cited by 3
Putra, P. U., & Kano, F. (2024) · ACM Symposium on Eye Tracking Research and Applications (ETRA) · doi:10.1145/3649902.3653007 · Cited by 2
Computational-aided understanding of metabolic mechanism: A case study
Wang, Z., Bai, M.-Y., Ni, X.-F., Liu, Q., Qiao, N., Zhang, M., Yang, J., Li, Q., Huang, N., Sun, M., et al. (2025) · Results in Chemistry · doi:10.1016/j.rechem.2025.102453 · Cited by 2
Study on the Degradation of Aflatoxin B1 by Myroides odoratimimus 3J2MO
Wang, X., Gao, Y.-Y., Wang, D., Zhang, Q., Wang, H.-R., Zhang, T., Zhu, M.-J., Dong, J., Dong, L., Feng, P., et al. (2025) · Biology · doi:10.3390/biology14060724 · Cited by 2
Khodadadian, E., Mirsian, S., Shashaani, S., Parvizi, M., Khodadadian, A., Knees, P., Hilber, W., & Heitzinger, C. (2025) · Machine Learning with Applications · doi:10.1016/j.mlwa.2025.100718 · Cited by 2
Wang, R., Liang, S., Xie, H., Wang, X., Na, Z., & Xu, W. L. (2025) · Food Bioscience · doi:10.1016/j.fbio.2025.107369 · Cited by 2
Li, T., Wang, M., Ren, H., Yu, H., Luo, X., Lv, L., Jin, H., Yin, X., & Chen, R. (2025) · Journal of Integrative Plant Biology · doi:10.1111/jipb.70048 · Cited by 2
Self-citationTCNeKP: A Novel Deep Learning Architecture for Enzyme Catalytic Activity Prediction
Lei, Y., Liu, R., Yu, H., Xu, W., Long, T., & Hu, M. Y. (2025) · Journal of Chemical Information and Modeling · doi:10.1021/acs.jcim.5c01830 · Cited by 2
Self-citationWang, H.-Y., Qian, Z.-H., Zhang, J., Li, J.-C., & Xu, J.-Z. (2026) · Journal of Agricultural and Food Chemistry · doi:10.1021/acs.jafc.5c15833 · Cited by 2
Jiang, S., ZHENG, Z., Dong, H., Zhang, S., Tong, Q., & Yi, D. (2026) · Journal of Agricultural and Food Chemistry · doi:10.1021/acs.jafc.5c14148 · Cited by 2
Enzyme Catalytic Parameters and Evolution Across the Dissipation Plane
Juretić, D., & Mađarić, B. B. (2026) · International Journal of Molecular Sciences · doi:10.3390/ijms27041709 · Cited by 2
Ye, A., Wang, B.-Y., Cheng, Z., Dong, C., & Guo, F.-B. (2026) · Bioresource Technology · doi:10.1016/j.biortech.2026.134309 · Cited by 2
Zhang, S., He, J., Duan, X., Liu, Z., Lan, Z., Wang, Q., Wang, J., Liu, W., Zhai, Q., Cruz‐Morales, P., et al. (2026) · Journal of Agricultural and Food Chemistry · doi:10.1021/acs.jafc.5c06841 · Cited by 2
Self-citationThe third wave of enzyme engineering: Navigating the AI-powered IDEA paradigm
Meng, S., Cheng, S., 程笑, Wei, D., Li, X., & Cui, H. (2026) · Chem · doi:10.1016/j.chempr.2026.103001 · Cited by 2
Liang, M., Li, C., Zhang, W.-P., & Wang, D. (2026) · Bioresource Technology · doi:10.1016/j.biortech.2026.134833 · Cited by 2
Enzyme Kinetic Parameter Prediction via Catalytic Pocket-Augmented Machine Learning
Luo, D., Ji, H., Cheng, S., Wen, K., Qu, X., Cao, M., Hong, L., & Wang, B. (2026) · ACS Catalysis · doi:10.1021/acscatal.6c03874 · Cited by 2
Yang, K. C., Tang, Z., Zhang, C., Zhang, R., Hu, S. C., Lv, C., Huang, J., Mei, J., Zhao, W., & Mei, L. (2025) · International Journal of Biological Macromolecules · doi:10.1016/j.ijbiomac.2025.140313 · Cited by 2
Enzymatic properties identification of pitcher fluid proteases from Nepenthes × miranda
Li, T., Tan, H., Bai, T., Wu, Y., Meng, X., Xie, Y., Li, X., & Chen, H. (2025) · Food Bioscience · doi:10.1016/j.fbio.2025.106159 · Cited by 2
AI and mechanistic modeling for characterizing biosynthetic pathways of natural products
Lee, B. T., Lee, B., Kwon, J. Y., Weber, T., & Kim, H. U. (2025) · Natural Product Reports · doi:10.1039/d5np00059a · Cited by 2
A De Novo Design Strategy to Convert FAcD from Dimer to Active MonomerPreprint
Chen, K.-W., Wang, C., Huang, H.-S., Wu, X., Chen, J., Qiu, J.-H., Hoi, K. K., Sun, T., Wang, J., & Wu, Y. (2025) · bioRxiv (Cold Spring Harbor Laboratory) · doi:10.1101/2025.01.11.632520 · Cited by 2
Toward Equitable Digital Mental Health: Integrating AI and Telepsychiatry in Global Practice
Algristian, H., & Sitorus, A. T. (2024) · Digitus Journal of Computer Science Applications · doi:10.61978/digitus.v2i2.834 · Cited by 1
Zhang, Y. F., Wang, Y., Zhu, H., Su, Y., Zhang, G., Wang, T., Chen, Y., Wang, J., Li, P., Wang, R., et al. (2025) · Journal of Agricultural and Food Chemistry · doi:10.1021/acs.jafc.5c09518 · Cited by 1
Ning, Y., Wang, F., Liu, H., & Deng, L. (2026) · Bioresource Technology · doi:10.1016/j.biortech.2026.133942 · Cited by 1
Zhu, C., Ding, W., Zhang, W., Zhou, R., & Deng, Z. (2025) · IEEE International Conference on Bioinformatics and Biomedicine (BIBM) · doi:10.1109/bibm66473.2025.11356302 · Cited by 1
Deep Learning Meets Synthetic Biology: Applications Across Molecular, Cellular, and Metabolic Scales
Zhao, Y., Yang, C., Xue, B., Liu, H., Wang, S., & Su, H. (2026) · Green Carbon · doi:10.1016/j.greenca.2025.11.003 · Cited by 2
Huang, H., Sheng, L., Ye, Y., Sun, J., Ji, J., Zhao, H., & Sun, X. (2026) · Journal of Hazardous Materials · doi:10.1016/j.jhazmat.2026.141524 · Cited by 1
Li, J.-P., Zhang, H.-H., He, Z.-H., Tian, J.-B., Zheng, R., Tang, X., & Zheng, Y. (2026) · Chemical Engineering Journal · doi:10.1016/j.cej.2026.176120 · Cited by 1
Mechanistic Basis and Multiscale Engineering of [FeFe]-Hydrogenases for Aerobic Biocatalysis
Luo, H., xiao, Q., Li, M., Dai, R., Gao, N., Lai, T. P., & Zhang, L. (2026) · Green Carbon · doi:10.1016/j.greenca.2026.02.008 · Cited by 1
Liu, S., Tang, Y., Zhu, Q., Zeng, W., He, Q., Xu, S., & Zhou, J. (2026) · ACS Sustainable Chemistry & Engineering · doi:10.1021/acssuschemeng.5c13902 · Cited by 1
Abdelsamad, I., Abdulbagi, M., Wang, J., Xue, Z., & Xu, L. (2026) · Natural Product Reports · doi:10.1039/d6np00013d · Cited by 1
EZPro-Multi: Contrastive Learning-Enhanced Multi-property Prediction for Enzyme Engineering
Sui, J., Xu, R., Sun, H., Duan, H., Zheng, L., & Guo, J. (2026) · Journal of Chemical Theory and Computation · doi:10.1021/acs.jctc.6c00821 · Cited by 1
Wang, X., Wang, Y., Zhuang, Y., Wang, G., & Lu, H. (2026) · Nature Communications · doi:10.1038/s41467-026-73744-3 · Cited by 2
Organic Chemistry as a Catalyst for AI Innovation: Challenges, Methods, and Emerging Paradigms
Chawla, N. V., González‐Montiel, G. A., Guo, K., Guo, T., Hua, T., Huang, X., Inae, E., Jiang, M., Le, K., Liu, G., et al. (2026) · Chemical Reviews · doi:10.1021/acs.chemrev.5c01081 · Cited by 4
王东培, Xu, C., Yang, Y., Jiang, Z., Wang, X., Zhao, Y., Li, R., & Ma, H. (2026) · Journal of Agricultural and Food Chemistry · doi:10.1021/acs.jafc.6c03371 · Cited by 1
Ahsan, W. (2026) · Catalysts · doi:10.3390/catal16070598 · Cited by 1
Deep Learning–driven synergistic engineering of PET hydrolase for post-consumer PET depolymerization
Shao, C., Shen, X., Long, J., Cui, Z., Chen, B., & Tan, T. (2026) · Synthetic and Systems Biotechnology · doi:10.1016/j.synbio.2026.06.003 · Cited by 2
Hao, K., Liu, J. C., Tang, H., Zhang, Y., Sun, Y., Zhang, H., Wang, J., Liu, P., Luo, J., & Zhao, J. B. (2026) · Bioresources and Bioprocessing · doi:10.1186/s40643-026-01096-3 · Cited by 1
Sun, S., Liu, J., Gao, X., Dong, J., Wang, W., Yan, Q., Shi, S., Xiong, P., & Liu, X. (2026) · Food Chemistry X · doi:10.1016/j.fochx.2026.104302 · Cited by 1
Artificial intelligence in microbial biotechnology for food security: current state and challenges
Oyeniran, K. A., & Donaldson, L. (2026) · Frontiers in Bacteriology · doi:10.3389/fbrio.2026.1921669 · Cited by 1
The Structure and Properties of Microbial Enzymes
Réty, S. (2023) · Microorganisms · doi:10.3390/microorganisms12010045 · Cited by 1
Fine-tuning of conditional Transformers for the generation of functionally characterized enzymesPreprint
Nicolini, M., Saitto, E., Franco, R. E. J., Cavalleri, E., Mesiti, M., Galeano, A., Malchiodi, D., Paccanaro, A., Robinson, P. N., Casiraghi, E., et al. (2024) · bioRxiv (Cold Spring Harbor Laboratory) · doi:10.1101/2024.08.10.607430 · Cited by 3
Wu, K., Liu, H., Sun, M., Mao, R., Jiang, Y., Kerkhoven, E. J., Chen, Y., Nielsen, J., & Li, F. (2024) · bioRxiv (Cold Spring Harbor Laboratory) · doi:10.1101/2024.09.02.610684 · Cited by 1
Unraveling the Impact of Gene Length on Kinetic Parameters: Implications in Drug Target selectionPreprint
Choudhuri, S., & Ghosh, B. (2024) · bioRxiv (Cold Spring Harbor Laboratory) · doi:10.1101/2024.08.31.610572
Wang, D., Wang, M., Peng, Z., Xiao, K., Chen, J., Niu, Z., Yang, S., Huo, F. W., & Song, T. L. (2025) · Research Square · doi:10.21203/rs.3.rs-6051952/v1
Ortiz, J. P. M., Benson, D., Watts, J., Velasque, M., Warden, A. C., & Morgan, M. J. (2025) · bioRxiv (Cold Spring Harbor Laboratory) · doi:10.1101/2025.05.01.651607
Luo, D., Qu, X., & Wang, B. (2025) · bioRxiv (Cold Spring Harbor Laboratory) · doi:10.1101/2025.05.18.654694
Huber, H. A., & Finley, S. D. (2025) · bioRxiv (Cold Spring Harbor Laboratory) · doi:10.1101/2025.05.23.655795
SKiD: A Structure-Oriented Kinetics Database of Enzyme-Substrate InteractionsPreprint
Krishnan, S. R., Pandey, N., Srinivasan, R., & Roy, A. (2025) · bioRxiv (Cold Spring Harbor Laboratory) · doi:10.1101/2025.05.18.654770
Song, A., & Wang, K. (2025) · IEEE Data Driven Control and Learning Systems Conference (DDCLS) · doi:10.1109/ddcls66240.2025.11064981
GO-HKP: A Gene Ontology hierarchy-driven framework for enzyme k cat prediction
Meng, Q., Mao, Z., Chen, H., Huang, Y., & Ma, H. (2025) · Software Impacts · doi:10.1016/j.simpa.2025.100803
Liu, D., Hu, X., Liu, X., Liu, J., & Deng, H. (2025) · ACS Synthetic Biology · doi:10.1021/acssynbio.5c00523
Self-citationWan, X., Shahrear, S., Chew, S. W., Vilaplana, F., & Mäkelä, M. (2024) · Figshare · doi:10.6084/m9.figshare.27000688
Wan, X., Shahrear, S., Chew, S. W., Vilaplana, F., & Mäkelä, M. (2024) · Figshare · doi:10.6084/m9.figshare.27000685
Canalejo, F. J., & Nogales, J. (2025) · bioRxiv (Cold Spring Harbor Laboratory) · doi:10.64898/2025.12.09.693157
Leveraging machine learning to unravel drug–microbiome interactions in the gut
Wu, K., Li, C., Wang, R., Zhang, C., Geng, H., Zhou, X., He, X., Yang, Y., Lu, D., & Li, F. (2025) · Health engineering. · doi:10.26599/he.2026.9460012
Li, Z., & Lu, D. (2026) · bioRxiv (Cold Spring Harbor Laboratory) · doi:10.64898/2026.01.19.700244
Rousset, Y., Kroll, A., & Lercher, M. J. (2026) · bioRxiv (Cold Spring Harbor Laboratory) · doi:10.64898/2026.01.23.701068
UniKineG: Unified-Coordinate Geometric Graphs Enable Robust Enzyme Kinetic Prediction
Wang, X., Shi, P., Mao, J., Liu, K., & Shuangping, L. I. U. (2026) · International Journal of Molecular Sciences · doi:10.3390/ijms27041731
Functional Locality–Aligned Learning Reveals Structure–Function Causality in Enzyme KineticsPreprint
Zhang, H., Zhang, H., Kang, M., Zhang, K., Yang, T., & Zheng, N. (2026) · bioRxiv (Cold Spring Harbor Laboratory) · doi:10.64898/2026.03.04.709726
Lee, U., Park, M., Song, B., & Ha, N. (2026) · Computational and Structural Biotechnology Journal · doi:10.34133/csbj.0073
Liu, X., Zhou, R., Qi, S., Qiao, N., & Deng, Z. (2026) · Journal of Chemical Information and Modeling · doi:10.1021/acs.jcim.6c00032
Wu, H., Nie, Z., Zhang, H., & Ren, Z. (2026) · Journal of Chemical Information and Modeling · doi:10.1021/acs.jcim.5c03204
Mu, X., Yang, Y., Wang, Q., Chen, Z., Luo, B., Huang, Z., Lin, X., Xu, L., Li, X., Qu, Y., et al. (2026) · bioRxiv (Cold Spring Harbor Laboratory) · doi:10.64898/2026.04.28.721430
Ng, Y.-L., Wang, X., Li, Y., Huang, J., Lai, H. M., Chan, J. Y. K., NG, B. K. W., Ko, H., & Kwok, K. (2026) · GigaScience · doi:10.1093/gigascience/giag056
CatIF-RL: Activity-Oriented Enzyme Sequence Design by Steered Inverse Protein FoldingPreprint
Li, Y.-H., Xiong, J.-L., Zhang, Y.-X., Cai, T., Fu, C., Li, S.-T., Xu, W., Lyu, R., Chen, Z.-Y., Guo, Z., et al. (2026) · bioRxiv · doi:10.64898/2026.05.11.724288 · Cited by 1
Zhang, P., Chen, Y., Zeng, Z., He, Z., Yu, H., Shen, J., Han, Y., Deng, H., Luo, X., & Wang, X. (2026) · Chemical Engineering Journal · doi:10.1016/j.cej.2026.177249
Self-citationQurat-ul-ain, Outeiral, C., Cagiada, M., Teh, Y. W., & Deane, C. M. (2026) · bioRxiv (Cold Spring Harbor Laboratory) · doi:10.64898/2026.05.28.728196 · Cited by 1
Priyanka, Chandra, R., Fahad, M. S., Oraon, R., & Ranjan, A. (2026) · Enzyme and Microbial Technology · doi:10.1016/j.enzmictec.2026.110915
Huber, H. A., & Finley, S. D. (2026) · PLoS Computational Biology · doi:10.1371/journal.pcbi.1014321 · Cited by 1
Zhang, J. K., Ruan, H., Zhang, J., Li, Y., Li, Y., & Luo, G. (2026) · Biochemical and Biophysical Research Communications · doi:10.1016/j.bbrc.2026.154159
Song, W., Xu, X. X., Wei, W., Zhou, Y., & Wu, J. (2026) · Journal of Agricultural and Food Chemistry · doi:10.1021/acs.jafc.6c05476
Genome-Scale Metabolic Modeling of Terpenoid Biosynthesis: Advances and Perspectives
Cheng, M., Gao, X., Shen, R., Liang, X., Dai, Y., Guo, Q., & Ye, C. (2026) · Journal of Agricultural and Food Chemistry · doi:10.1021/acs.jafc.6c03926
Function-guided design of active enzymesPreprint
Hu, M., Wu, L., Yang, Y., Li, F., & Zhu, L. (2026) · bioRxiv (Cold Spring Harbor Laboratory) · doi:10.64898/2026.06.27.735025
Glucose-to-Starch Conversion by a Synthetic Enzymatic Cascade
Shen, Y., Liang, Z., Li, L., Zhang, W., Wang, Y., Tian, J., Yao, B., Huang, H., Luo, H., & Tu, T. (2026) · Engineering · doi:10.1016/j.eng.2026.04.021
EPIC: A Machine-Learning Framework for Product-Dependent Behavior in β-Glucosidases
Malli, A., Vasyutyn, D., Majumder, A., & Kim, J. R. (2026) · ACS Omega · doi:10.1021/acsomega.6c04226
Computational design of microbial cell factories for sustainable biomanufacturing
Liu, L., Li, C., & Li, F. (2026) · Green Energy & Environment · doi:10.1016/j.gee.2026.07.001
CatESO: Differentiable Enzyme Sequence Optimization Guided by Substrate-Aware kcat PredictionPreprint
Gan, Z., Xu, Y.-Z., Xu, J.-D., Wu, Z.-H., Huang, J.-P., Yin, J.-B., Chen, G., & Zhang, J. Z. (2026) · bioRxiv · doi:10.64898/2026.07.04.736506
EnzyKPred: A Deep Multi-modal Model for Predicting Enzyme-Substrate Catalytic Constants
Liu, Q., Hu, Z., Su, Y., Zheng, C., & Tan, D. (2026) · Lecture notes in computer science · doi:10.1007/978-981-92-3495-0_8
RCKcat: Reliability-Gated Reaction-Center Augmentation for Enzyme Kcat Prediction
Zhang, H., Zhang, Y., Cheng, L., & Alghazzawi, D. (2026) · Lecture notes in computer science · doi:10.1007/978-981-92-3485-1_13
CatIF-RL: Activity-Oriented Enzyme Sequence Design by Steered Inverse Protein Folding
Li, Y., Xiong, J., Zhang, Y., Cai, T., Fu, C., Li, S., Xu, W., Lyu, R., Chen, Z., Guo, Z., et al. (2026) · Journal of Chemical Information and Modeling · doi:10.1021/acs.jcim.6c01587 · Cited by 1
An enzyme-specific protein language model for catalytic property prediction
Wang, C., Li, M., Geng, S., Li, W., Zhou, X., Wang, Y. G., Yu, Y., Wang, T., & Shen, Y. (2026) · Nature Communications · doi:10.1038/s41467-026-75283-3
Nanothermometer Performance Prediction via Fluorescence Dynamics Model
Tian, B., Zhang, Y., Fu, T., Wang, Y., Sun, C., & Liu, Y. (2026) · The Journal of Physical Chemistry C · doi:10.1021/acs.jpcc.6c03052
Wang, W.-B., Tao, M.-R., Li, K., Bamba, T., Cheng, C., Hasunuma, T., Kondo, A., Thongchul, N., Zhao, S., Feng, J., et al. (2026) · Advances in biochemical engineering, biotechnology · doi:10.1007/10_2026_322
Advances in engineering microalgae for heterologous terpenoid synthesis: A review
Yuan, Y., Dai, J.-L., Xiao, L., & Jiang, J. (2026) · Biotechnology Advances · doi:10.1016/j.biotechadv.2026.108993
Zhang, Z., Cao, R., Sun, J., Chen, L., Xiang, L., Shen, Z., Lv, B., Qin, L., & Li, C. (2026) · Chinese Journal of Chemical Engineering · doi:10.1016/j.cjche.2026.07.004
De novo L-(+)-tartaric acid biosynthesis in multi-modular engineered yeasts
Zhou, X., Hou, J., Wang, Z., Li, Z., Li, Y., Li, X., Xu, X., Liu, Y., Li, J., Du, G., et al. (2026) · Nature Communications · doi:10.1038/s41467-026-76119-w
Hu, R.-E., & Ng, I. (2026) · Chemical Engineering Journal · doi:10.1016/j.cej.2026.180351
Ye, T., Xu, J., Wei, X., Ding, W., Liu, H., & Fang, H. (2026) · Trends in Food Science & Technology · doi:10.1016/j.tifs.2026.105978
Shen, Q.-X., Bao, J., Liu, Y., Wang, X., & Cui, L. (2026) · Journal of Cleaner Production · doi:10.1016/j.jclepro.2026.149219
Machine learning for mechanistic modeling of plant metabolic pathways
Wendering, P., & Nikoloski, Z. (2026) · Journal of Experimental Botany · doi:10.1093/jxb/erag400 · Cited by 1
Zhang, Z., Ma, L., Ding, M., Xu, P., & Tao, F. (2026) · Engineering Microbiology · doi:10.1016/j.engmic.2026.100301
Metadata
- Authors
- Yu, H., Deng, H., He, J., Keasling, J. D., & Luo, X.
- Affiliations
- Chinese Academy of Sciences (CN)
- Lawrence Berkeley National Laboratory (US)
- Corresponding author
- Luo, Xiaozhou
- Venue
- Nature Communications
- Published
- 2023-12-11
- Volume
- 14
- Issue
- 1
- Pages
- 8211-8211
- ISSN
- 2041-1723 (ISSN-L)
- PMC
- PMC10713628
- OpenAlex
- W4389546039
- Cited by
- 226
- References
- 54
- Citations by year
- 2026: 96 · 2025: 88 · 2024: 39 · 2023: 3
- FWCI
- 20.23
- Type
- journal article
- Language
- en
- Open access
- gold
- doi.org
- Locations
- Nature Communications (publishedVersion, cc-by)
- Research Square (acceptedVersion, cc-by)
- PubMed Central (publishedVersion, cc-by)
- PubMed (publishedVersion)
- eScholarship (California Digital Library) (submittedVersion, cc-by)
- OSTI OAI (U.S. Department of Energy Office of Scientific and Technical Information) (submittedVersion, cc-by)
- Technical University of Denmark, DTU Orbit (Technical University of Denmark, DTU) (submittedVersion, other-oa)
- RePEc: Research Papers in Economics (submittedVersion)
- DOAJ (DOAJ: Directory of Open Access Journals) (submittedVersion, cc-by-sa)
- Funders
- National Natural Science Foundation of China (32071421)
- Topics
- Life Sciences › Biochemistry, Genetics and Molecular Biology › Molecular Biology › Machine Learning in Bioinformatics
- Life Sciences › Biochemistry, Genetics and Molecular Biology › Molecular Biology › Enzyme Catalysis and Immobilization
- Life Sciences › Biochemistry, Genetics and Molecular Biology › Molecular Biology › Protein Structure and Dynamics
- Keywords
- Michaelis constant, catalytic efficiency, protein sequences, substrate structure, pre-trained language models, environmental factors, pH and temperature effects, enzyme discovery, directed evolution, enzyme engineering
- MeSH terms
- Biotechnology, Catalysis, Kinetics, Temperature
About these checks
Registry, retraction, Cites and statistics results are computed, not judged, with one exception: a printed reference that no index lists is read once by a model before it counts as a citation error. Claims are extracted by a model and kept only when their quote appears verbatim in the text; each cited source is then checked, with a model’s help, for whether it says what the claim relies on. Those verdicts can be wrong — read the claim’s quote and the cited source before relying on one.
Statistics and arithmetic are recomputed, not judged.
Confidence bands are shown only for fields calibrated on our annotated test set. None is calibrated yet, so no band is shown.
What counts as a claim ›How we measure confidence ›How we check this ›
Are you an author, or do you see a problem with this page? Request a review
