Cited by 103Protein Structure and DynamicsMachine Learning in BioinformaticsEnzyme Structure and Function

The DOI matches its Crossref record; 73 of the 73 references it cites were found in a registry or an index.

From interaction networks to interfaces, scanning intrinsically disordered regions using AlphaFold2

Open access
Bret, Hélène, Gao, Jinmei, Zea, Diego Javier, Andreani, Jessica, Guerois, Raphaël·2024·Nature Communications

Published version of a preprint

Abstract

The revolution brought about by AlphaFold2 opens promising perspectives to unravel the complexity of protein-protein interaction networks. The analysis of interaction networks obtained from proteomics experiments does not systematically provide the delimitations of the interaction regions. This is of particular concern in the case of interactions mediated by intrinsically disordered regions, in which the interaction site is generally small. Using a dataset of protein-peptide complexes involving intrinsically disordered regions that are non-redundant with the structures used in AlphaFold2 training, we show that when using the full sequences of the proteins, AlphaFold2-Multimer only achieves 40% success rate in identifying the correct site and structure of the interface. By delineating the interaction region into fragments of decreasing size and combining different strategies for integrating evolutionary information, we manage to raise this success rate up to 90%. We obtain similar success rates using a much larger dataset of protein complexes taken from the ELM database. Beyond the correct identification of the interaction site, our study also explores specificity issues. We show the advantages and limitations of using the AlphaFold2 confidence score to discriminate between alternative binding partners, a task that can be particularly challenging in the case of small interaction motifs.

Overview

The claims and statistics of this paper haven’t been checked yet.

Run the check — free, no account needed. It reads the open-access text and checks the sources it cites.

A few free checks a day · papers already verified open instantly · results are public

Integrity signals

Registry

Crossref · 10.1038/s41467-023-44288-7

Cites

73 of 73 references verified0 citation errors · 0 not checkable

Statistics

Figures

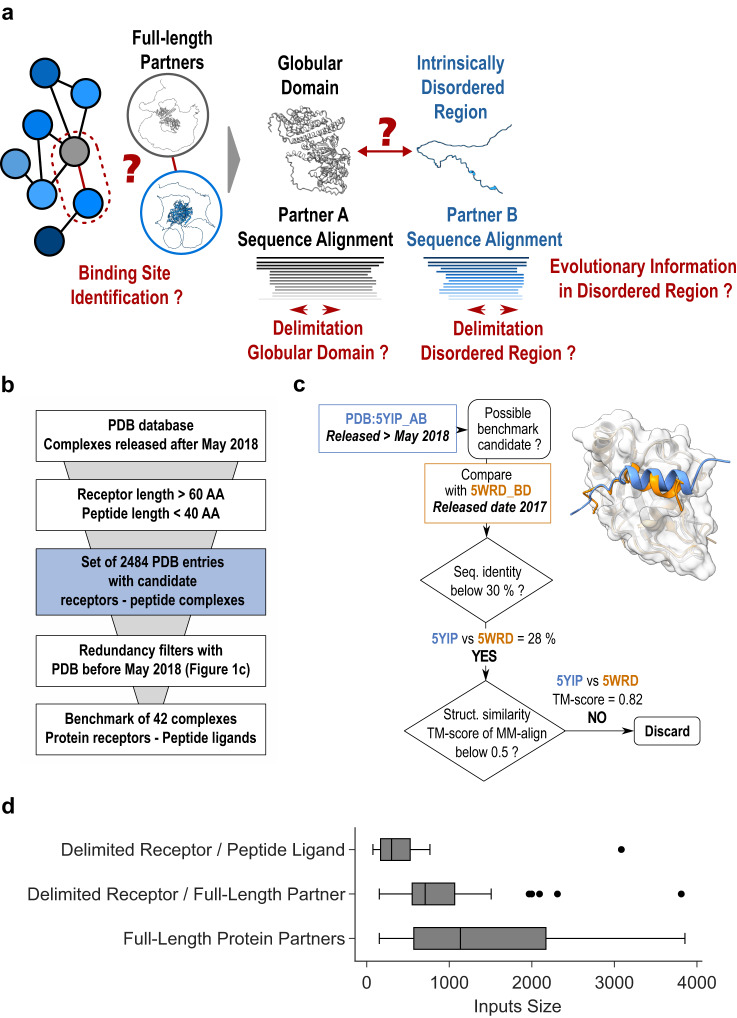
Fig. 1 General presentation of the benchmark dataset. a Disentangling the complexity of a protein interaction network (sketched on the left) by analyzing binary interactions between a central gray protein and its blue binding partners can be complicated in case they contain intrinsically disordered regions. b General pipeline to select the PDB entries that can be used as test complexes from those released after May 2018. They were required to share no sequence or structural redundancy with any of the complex structures that were used for AlphaFold2-Multimer training. c Example illustrating filters used to assess the lack of redundancy between the candidate complex and structures published before May 2018. Two filters were used, one based on sequence identity using a 30% seq. id. threshold and a second retrieving all complexes involving a receptor homolog using PPI3D57 and checking for lack of interface structural similarity using MM-align59. d Boxplots showing the cumulative size distribution of the 42 inputs (receptor+ligand) that were processed by AlphaFold2, either in protocols where sequences were delineated following the boundaries of the experimental structures or in those where full lengths of ligands and/or receptors were used. In the boxplot representation center line is the median, min and max limits of the box are the lower and upper quartiles, whiskers are the 1.5x interquartile range and points represent outliers. Source data are provided as a Source Data file.
Fig. 1 General presentation of the benchmark dataset. a Disentangling the complexity of a protein interaction network (sketched on the left) by analyzing binary interactions between a central gray protein and its blue binding partners can be complicated in case they contain intrinsically disordered regions. b General pipeline to select the PDB entries that can be used as test complexes from those released after May 2018. They were required to share no sequence or structural redundancy with any of the complex structures that were used for AlphaFold2-Multimer training. c Example illustrating filters used to assess the lack of redundancy between the candidate complex and structures published before May 2018. Two filters were used, one based on sequence identity using a 30% seq. id. threshold and a second retrieving all complexes involving a receptor homolog using PPI3D57 and checking for lack of interface structural similarity using MM-align59. d Boxplots showing the cumulative size distribution of the 42 inputs (receptor+ligand) that were processed by AlphaFold2, either in protocols where sequences were delineated following the boundaries of the experimental structures or in those where full lengths of ligands and/or receptors were used. In the boxplot representation center line is the median, min and max limits of the box are the lower and upper quartiles, whiskers are the 1.5x interquartile range and points represent outliers. Source data are provided as a Source Data file.CC BY · PubMed Central
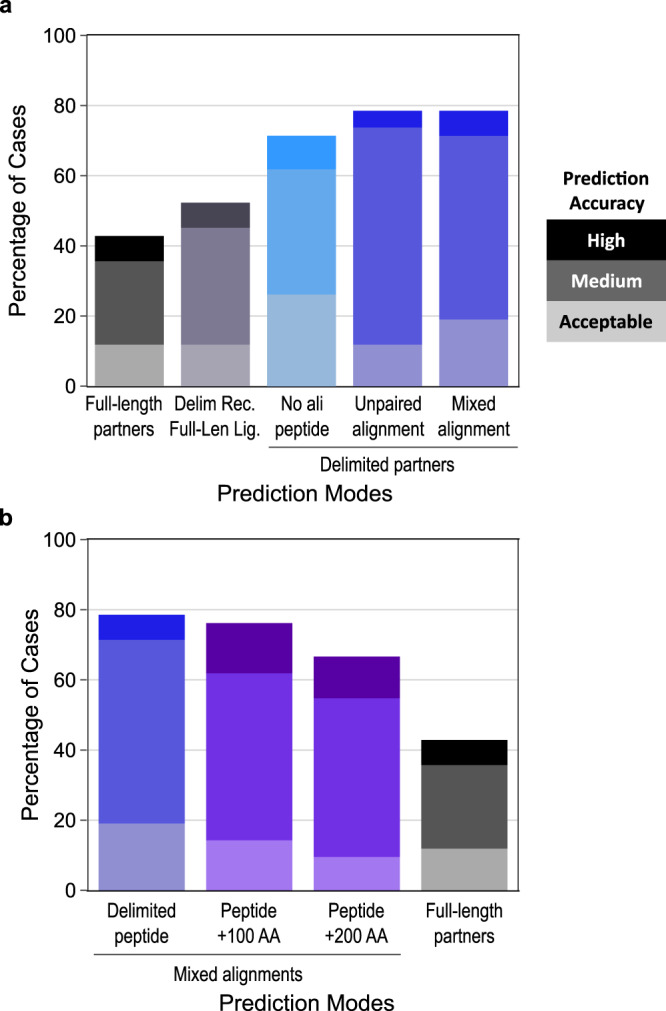
Fig. 2 AlphaFold2-Multimer success rates on the benchmark dataset using different prediction modes. Stacked barplots reporting the success rates of AlphaFold2 prediction depending on the types of co-alignment used. All success rates are presented as the percentage of test cases in which the best AF2-Multimer model (best AF2 confidence score) is of Acceptable (light color), Medium (medium color) or High (dark color) quality according to the CAPRI criteria for protein-peptide complexes49. a Success rates using (from left to right): full-length partners with a mixed alignment generation mode (gray grades), delimited receptor with full-length ligand with a mixed alignment generation mode (deep purple grades), delimited partners with no evolutionary information for the peptide (cyan grades), delimited partners with unpaired co-alignment (blue grades), delimited partners with mixed alignment (blue grades). b Success rates using (from left to right): delimited partners (blue grades) (same as rightmost bar in panel a), peptides extended by 100 or 200 amino acids (purple grades), full-length partners (gray grades) (same as leftmost bar in panel a). Source data are provided as a Source Data file.
Fig. 2 AlphaFold2-Multimer success rates on the benchmark dataset using different prediction modes. Stacked barplots reporting the success rates of AlphaFold2 prediction depending on the types of co-alignment used. All success rates are presented as the percentage of test cases in which the best AF2-Multimer model (best AF2 confidence score) is of Acceptable (light color), Medium (medium color) or High (dark color) quality according to the CAPRI criteria for protein-peptide complexes49. a Success rates using (from left to right): full-length partners with a mixed alignment generation mode (gray grades), delimited receptor with full-length ligand with a mixed alignment generation mode (deep purple grades), delimited partners with no evolutionary information for the peptide (cyan grades), delimited partners with unpaired co-alignment (blue grades), delimited partners with mixed alignment (blue grades). b Success rates using (from left to right): delimited partners (blue grades) (same as rightmost bar in panel a), peptides extended by 100 or 200 amino acids (purple grades), full-length partners (gray grades) (same as leftmost bar in panel a). Source data are provided as a Source Data file.CC BY · PubMed Central
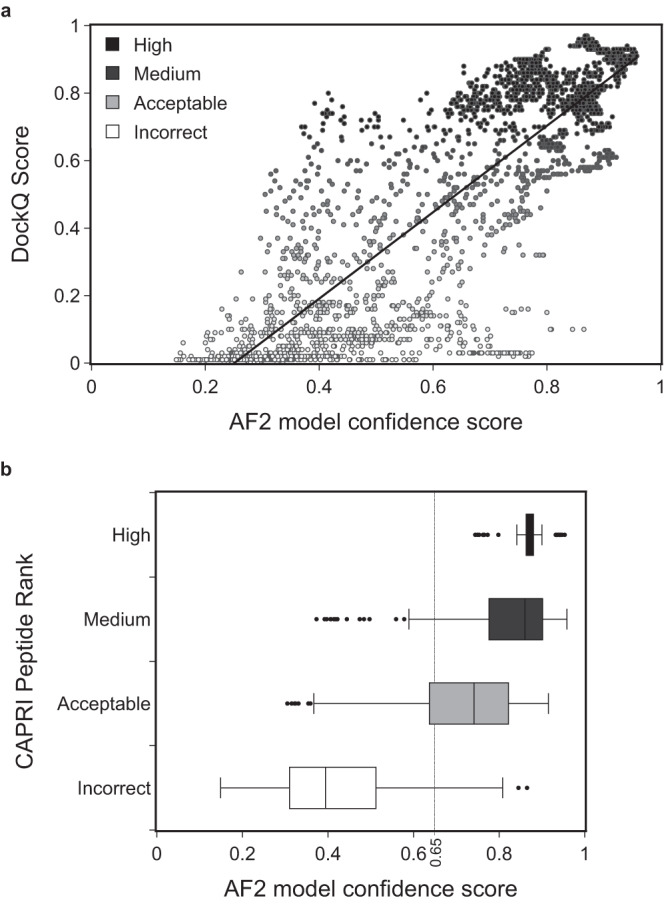
Fig. 3 Model quality depending on the value of the AF2 model confidence score. a Distribution of DockQ scores48 for 75 models for every binary protein-peptide complex (25 models in the three alignment conditions: mixed, unpaired, no_ali) as a function of the AF2 model confidence score. Data points are colored according to the model quality as rated by the DockQ score from low (white) to high (dark gray) values. Pearson’s correlation is 0.84. b Boxplots of the AF2 confidence score value distributions for the same set of models, split by model quality category according to the CAPRI protein-peptide criteria: High (sample size n = 128, dark gray), Medium (n = 332, medium gray), Acceptable (n = 106, light gray), Incorrect (n = 484, white). In the boxplot representation center line is the median, min and max limits of the box are the lower and upper quartiles, whiskers are the 1.5x interquartile range and points represent outliers. Source data are provided as a Source Data file.
Fig. 3 Model quality depending on the value of the AF2 model confidence score. a Distribution of DockQ scores48 for 75 models for every binary protein-peptide complex (25 models in the three alignment conditions: mixed, unpaired, no_ali) as a function of the AF2 model confidence score. Data points are colored according to the model quality as rated by the DockQ score from low (white) to high (dark gray) values. Pearson’s correlation is 0.84. b Boxplots of the AF2 confidence score value distributions for the same set of models, split by model quality category according to the CAPRI protein-peptide criteria: High (sample size n = 128, dark gray), Medium (n = 332, medium gray), Acceptable (n = 106, light gray), Incorrect (n = 484, white). In the boxplot representation center line is the median, min and max limits of the box are the lower and upper quartiles, whiskers are the 1.5x interquartile range and points represent outliers. Source data are provided as a Source Data file.CC BY · PubMed Central
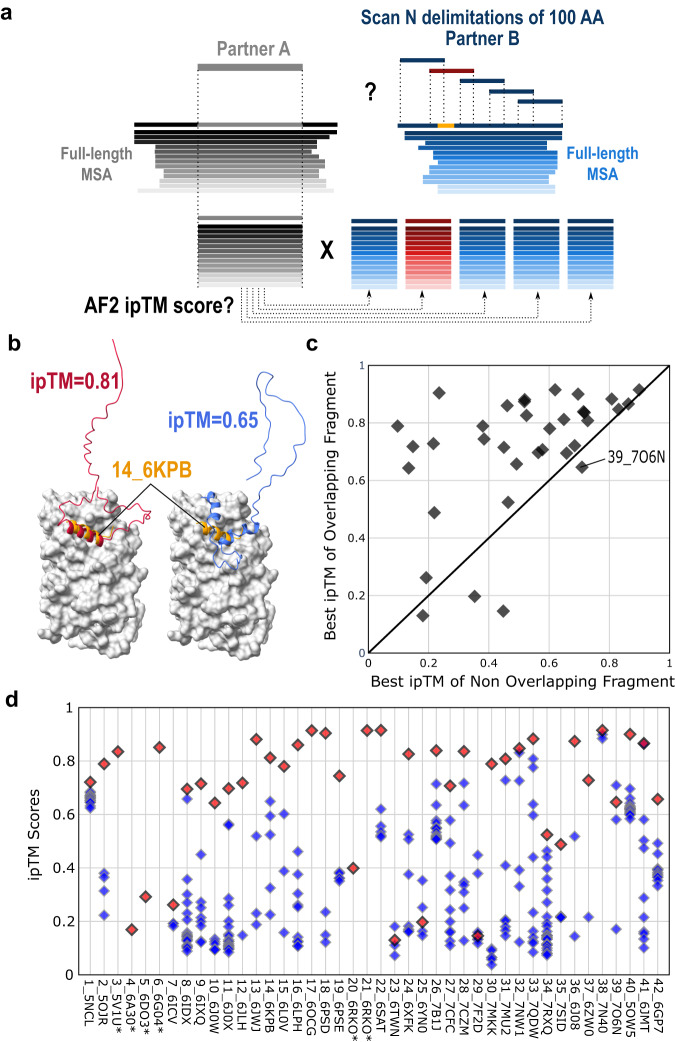
Fig. 4 Systematic screening of the different fragments of a binding partner. a Protocol used to screen the complete ligand sequence of a binding partner by analyzing all 100 amino acid long fragments against the receptor delimited by the length of its interaction domain. The fragment overlapping the correct binding site shown in orange is colored red while the other fragments are blue. b The predicted ipTM score is used to rank the different fragments and evaluate those that overlap or not with the correct binding site. c Scatter plot showing the highest ipTM score for the model containing a fragment overlapping the correct binding site compared to the highest ipTM score among models with no overlap. 35 points are represented and not 42 since 7 ligands have less than 100 amino acids. d Detailed distribution of ipTM scores for the 42 PDB cases of the benchmark with the fragment overlapping the correct binding site as a red diamond and the non-overlapping ones as blue diamonds. If two fragments overlap with the binding site, only the model with highest ipTM score is represented in panels c and d. Source data are provided as a Source Data file.
Fig. 4 Systematic screening of the different fragments of a binding partner. a Protocol used to screen the complete ligand sequence of a binding partner by analyzing all 100 amino acid long fragments against the receptor delimited by the length of its interaction domain. The fragment overlapping the correct binding site shown in orange is colored red while the other fragments are blue. b The predicted ipTM score is used to rank the different fragments and evaluate those that overlap or not with the correct binding site. c Scatter plot showing the highest ipTM score for the model containing a fragment overlapping the correct binding site compared to the highest ipTM score among models with no overlap. 35 points are represented and not 42 since 7 ligands have less than 100 amino acids. d Detailed distribution of ipTM scores for the 42 PDB cases of the benchmark with the fragment overlapping the correct binding site as a red diamond and the non-overlapping ones as blue diamonds. If two fragments overlap with the binding site, only the model with highest ipTM score is represented in panels c and d. Source data are provided as a Source Data file.CC BY · PubMed Central
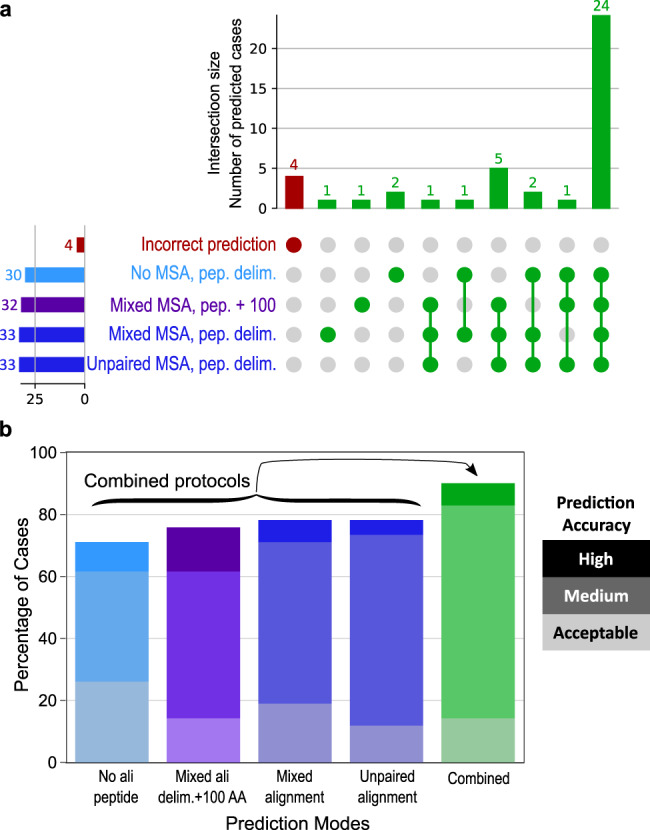
Fig. 5 Complementarity of the predictions made in different prediction modes. a UpSet diagram69 displaying the number of successful cases (out of 42) found by either a single or several prediction mode(s) among the following: delimited peptide with no peptide multiple sequence alignment (MSA), peptide extended by 100 residues with a mixed MSA, delimited peptide with a mixed MSA, delimited peptide with an unpaired MSA. 5 cases that can be identified in none of these conditions are highlighted in red. b Success rates for the four protocols shown in panel a (values are the same as in Fig. 2) and for a combined protocol taking the best AlphaFold2 (AF2) confidence score value out of 100 models (25 for each condition) (green grades). Source data are provided as a Source Data file.
Fig. 5 Complementarity of the predictions made in different prediction modes. a UpSet diagram69 displaying the number of successful cases (out of 42) found by either a single or several prediction mode(s) among the following: delimited peptide with no peptide multiple sequence alignment (MSA), peptide extended by 100 residues with a mixed MSA, delimited peptide with a mixed MSA, delimited peptide with an unpaired MSA. 5 cases that can be identified in none of these conditions are highlighted in red. b Success rates for the four protocols shown in panel a (values are the same as in Fig. 2) and for a combined protocol taking the best AlphaFold2 (AF2) confidence score value out of 100 models (25 for each condition) (green grades). Source data are provided as a Source Data file.CC BY · PubMed Central
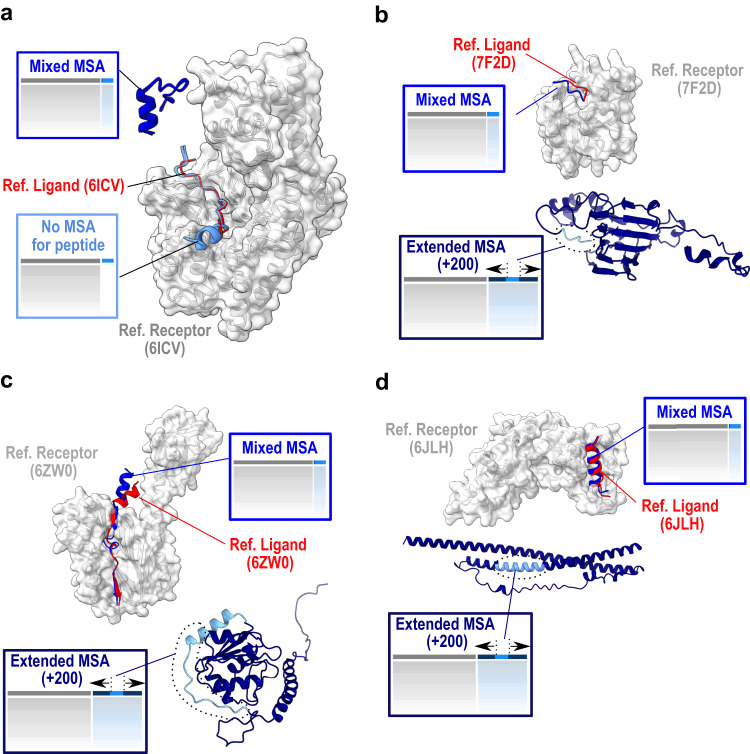
Fig. 6 Detailed analysis of complexes that succeed with only a subset of the protocols. The receptor is represented as a gray surface, the native ligand as a red cartoon, the predicted peptides in shades of blue: bright blue for the predictions in mixed multiple sequence alignment (MSA) mode, and light blue for the prediction with no peptide MSA (a) or for the peptide within the prediction of a fragment extended by 200 residues in dark blue (b–d). PDB identifiers of represented cases are 6ICV (a), 7F2D (b), 6ZW0 (c) and 6JLH (d).
Fig. 6 Detailed analysis of complexes that succeed with only a subset of the protocols. The receptor is represented as a gray surface, the native ligand as a red cartoon, the predicted peptides in shades of blue: bright blue for the predictions in mixed multiple sequence alignment (MSA) mode, and light blue for the prediction with no peptide MSA (a) or for the peptide within the prediction of a fragment extended by 200 residues in dark blue (b–d). PDB identifiers of represented cases are 6ICV (a), 7F2D (b), 6ZW0 (c) and 6JLH (d).CC BY · PubMed Central
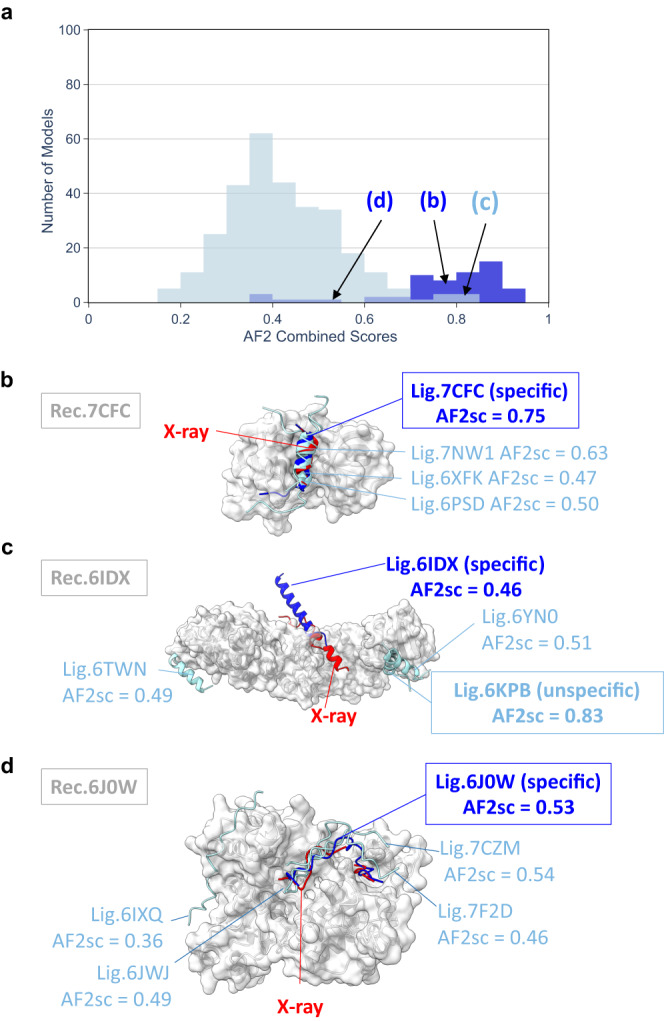
Fig. 7 Cross-partners evaluation assessing the specificity of the binding predictions. a Distribution of AF2 confidence scores obtained for the models involving the native peptide and rated as correct using the CAPRI protein-peptide criteria (darker blue distribution) for 16 out of 23 cases selected for cross-partners evaluation and for the models obtained with non-native peptide ligands (light blue distribution). Cross-partners predictions were performed using delimited partners with no evolutionary information for the peptide. Specific predictions illustrated in panels b–d are drawn from the relevant distributions at the indicated score values. Illustration of specific cases discussed in the text for native PDB identifiers: 7CFC (b), 6IDX (c), 6J0W (d). The receptor is shown as a gray surface, the native peptide as a red cartoon, the best predicted model involving the native peptide in bright blue cartoon and the best predicted models involving non-native peptides in light blue. AF2sc values indicate the best AF2 confidence score values obtained for each complex.
Fig. 7 Cross-partners evaluation assessing the specificity of the binding predictions. a Distribution of AF2 confidence scores obtained for the models involving the native peptide and rated as correct using the CAPRI protein-peptide criteria (darker blue distribution) for 16 out of 23 cases selected for cross-partners evaluation and for the models obtained with non-native peptide ligands (light blue distribution). Cross-partners predictions were performed using delimited partners with no evolutionary information for the peptide. Specific predictions illustrated in panels b–d are drawn from the relevant distributions at the indicated score values. Illustration of specific cases discussed in the text for native PDB identifiers: 7CFC (b), 6IDX (c), 6J0W (d). The receptor is shown as a gray surface, the native peptide as a red cartoon, the best predicted model involving the native peptide in bright blue cartoon and the best predicted models involving non-native peptides in light blue. AF2sc values indicate the best AF2 confidence score values obtained for each complex.CC BY · PubMed Central
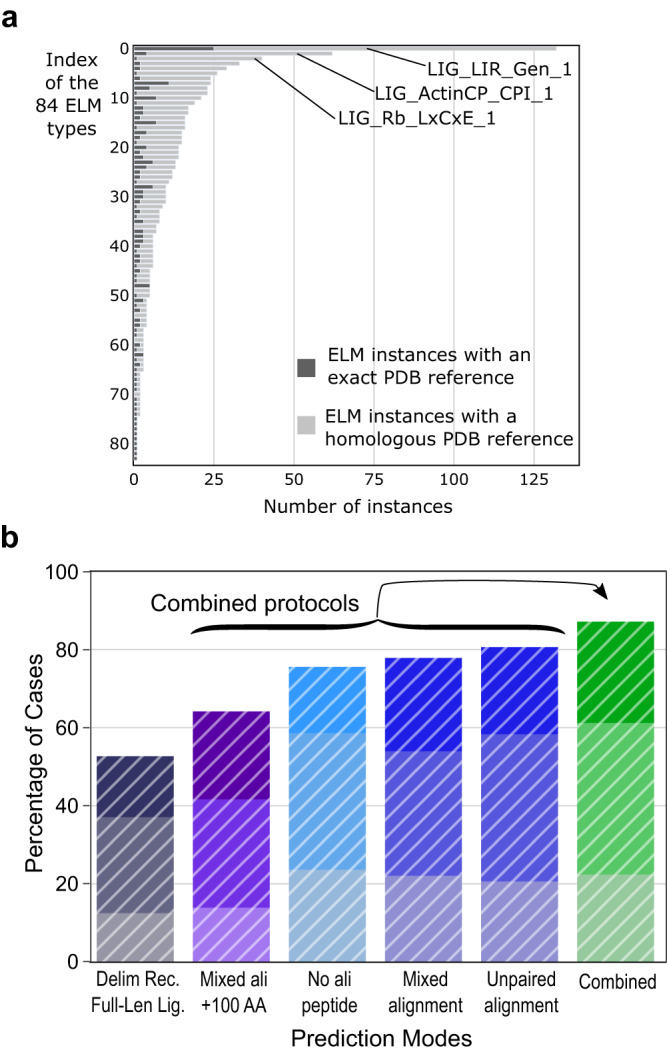
Fig. 8 Analysis of a large dataset of 923 complexes from the Eukaryotic Linear Motif (ELM) database. a Distribution of the 923 ELM cases that could be modeled and evaluated among 84 ELM categories (ELM types), highlighting the unbalanced distribution, biased towards some receptor/ligand couples such as the LIG_LIR_Gen_1, LIG_Actin_CPI_1 and LIG_Rb_LxCxE_1 categories comprising 132, 62 and 40 cases, respectively. Dark gray bars indicate the cases with an exact reference PDB structure while light gray bars indicate the cases that could be evaluated using a homologous PDB structure (see Methods). b Histogram representing the success rates obtained with six different protocols applied to the dataset extracted from the ELM database. The average success rates are reported with same color codes as in Figs. 2 and 5 but using white hatched bars (full-length ligand delimitation (deep purple), with extension of 100 amino acids (purple), with no alignment (cyan), mixed or unpaired co-alignments (blue), and combined (green)). The average success rates were calculated from a repeated stratified sampling of 1000 iterations over the 84 ELM categories, randomly selecting one ELM complex in each of the 84 categories. At every iteration, success rates were calculated and the mean success rate value is reported in the histogram where the best AlphaFold2 (AF2)-Multimer model (best AF2 confidence score) is of Acceptable (light color), Medium (medium color) or High (dark color) quality according to the CAPRI criteria for protein-peptide complexes49. Source data are provided as a Source Data file.
Fig. 8 Analysis of a large dataset of 923 complexes from the Eukaryotic Linear Motif (ELM) database. a Distribution of the 923 ELM cases that could be modeled and evaluated among 84 ELM categories (ELM types), highlighting the unbalanced distribution, biased towards some receptor/ligand couples such as the LIG_LIR_Gen_1, LIG_Actin_CPI_1 and LIG_Rb_LxCxE_1 categories comprising 132, 62 and 40 cases, respectively. Dark gray bars indicate the cases with an exact reference PDB structure while light gray bars indicate the cases that could be evaluated using a homologous PDB structure (see Methods). b Histogram representing the success rates obtained with six different protocols applied to the dataset extracted from the ELM database. The average success rates are reported with same color codes as in Figs. 2 and 5 but using white hatched bars (full-length ligand delimitation (deep purple), with extension of 100 amino acids (purple), with no alignment (cyan), mixed or unpaired co-alignments (blue), and combined (green)). The average success rates were calculated from a repeated stratified sampling of 1000 iterations over the 84 ELM categories, randomly selecting one ELM complex in each of the 84 categories. At every iteration, success rates were calculated and the mean success rate value is reported in the histogram where the best AlphaFold2 (AF2)-Multimer model (best AF2 confidence score) is of Acceptable (light color), Medium (medium color) or High (dark color) quality according to the CAPRI criteria for protein-peptide complexes49. Source data are provided as a Source Data file.CC BY · PubMed Central

Verification

Claims the paper makes

The claims and statistics of this paper haven’t been checked yet.

Run the check — free, no account needed. It reads the open-access text and checks the sources it cites.

A few free checks a day · papers already verified open instantly · results are public

Claims other papers make about this one

Each is checked against this paper’s own text: does it say what the citing paper says it does?

Self-check

Percentages, sums and reported differences re-computed from the paper’s own numbers.

The self-check needs the paper’s full text.

Citations

Cites

Show all 71 references

Research works printed but not linked: 1

  1. Evans R., et al. Protein complex prediction with AlphaFold-Multimer. bioRxiv, https://www.biorxiv.org/content/10.1101/2021.10.04.463034v2 (2022). · DOI

Metadata

Authors
Bret, H., Gao, J., Zea, D. J., Andreani, J., & Guerois, R.
Affiliations
Centre National de la Recherche Scientifique (FR)
Venue
Nature Communications
Published
2024-01-18
Volume
15
Issue
1
Pages
597-597
ISSN
2041-1723 (ISSN-L)
OpenAlex
W4390986414
Cited by
103
References
71
Citations by year
2026: 24 · 2025: 45 · 2024: 29
FWCI
13.34
Type
journal article
Language
en
Open access
Locations
  • Nature Communications (publishedVersion, cc-by)
  • bioRxiv (Cold Spring Harbor Laboratory) (acceptedVersion, cc-by-nc-nd)
  • PubMed Central (publishedVersion, cc-by)
  • PubMed (publishedVersion)
  • HAL (submittedVersion, cc-by)
  • RePEc: Research Papers in Economics (submittedVersion)
  • DOAJ (DOAJ: Directory of Open Access Journals) (submittedVersion, cc-by-sa)
Funders
Agence Nationale de la Recherche (ANR-18-CE45-0005)
Topics
  • Life Sciences › Biochemistry, Genetics and Molecular Biology › Molecular Biology › Protein Structure and Dynamics
  • Life Sciences › Biochemistry, Genetics and Molecular Biology › Molecular Biology › Machine Learning in Bioinformatics
  • Life Sciences › Biochemistry, Genetics and Molecular Biology › Structural Biology › Enzyme Structure and Function
Keywords
intrinsically disordered regions, protein-protein interfaces, interaction site prediction, AlphaFold2, AlphaFold2-Multimer, protein-peptide complex, protein complexes, evolutionary information, interaction networks
MeSH terms
Biological Evolution, Protein Binding, Proteins, Protein Interaction Maps, Intrinsically Disordered Proteins

About these checks

Registry, retraction, Cites and statistics results are computed, not judged, with one exception: a printed reference that no index lists is read once by a model before it counts as a citation error. Claims are extracted by a model and kept only when their quote appears verbatim in the text; each cited source is then checked, with a model’s help, for whether it says what the claim relies on. Those verdicts can be wrong — read the claim’s quote and the cited source before relying on one.

Statistics and arithmetic are recomputed, not judged.

Confidence bands are shown only for fields calibrated on our annotated test set. None is calibrated yet, so no band is shown.

What counts as a claim ›How we measure confidence ›How we check this ›

Are you an author, or do you see a problem with this page? Request a review