CoChat

Detection of senescence using machine learning algorithms based on nuclear features

Open access
Duran, Imanol, Pombo, Joaquim, Sun, Bin, Gallage, Suchira, Kudo, Hiromi, McHugh, Domhnall, Bousset, Laura, Barragan Avila, Jose Efren, Forlano, Roberta, Manousou, Pinelopi, Heikenwalder, Mathias, Withers, Dominic J., Vernia, Santiago, Goldin, Robert D., Gil, Jesús · 2024 · Nature Communications

The DOI matches its Crossref record; 49 of the 50 references it cites were found in a registry or an index.

Abstract

Cellular senescence is a stress response with broad pathophysiological implications. Senotherapies can induce senescence to treat cancer or eliminate senescent cells to ameliorate ageing and age-related pathologies. However, the success of senotherapies is limited by the lack of reliable ways to identify senescence. Here, we use nuclear morphology features of senescent cells to devise machine-learning classifiers that accurately predict senescence induced by diverse stressors in different cell types and tissues. As a proof-of-principle, we use these senescence classifiers to characterise senolytics and to screen for drugs that selectively induce senescence in cancer cells but not normal cells. Moreover, a tissue senescence score served to assess the efficacy of senolytic drugs and identified senescence in mouse models of liver cancer initiation, ageing, and fibrosis, and in patients with fatty liver disease. Thus, senescence classifiers can help to detect pathophysiological senescence and to discover and validate potential senotherapies.

Overview

The claims and statistics of this paper haven’t been checked yet.

Free: it reads the open-access text and checks the first 5 claims that cite a source we can check. Create a free account to check every claim.

A few free checks a day · papers already verified open instantly · results are public

Integrity signals

Registry

Crossref · 10.1038/s41467-024-45421-w

Cites

49 of 49 references verified0 citation errors · 0 not checkable

Statistics

Figures

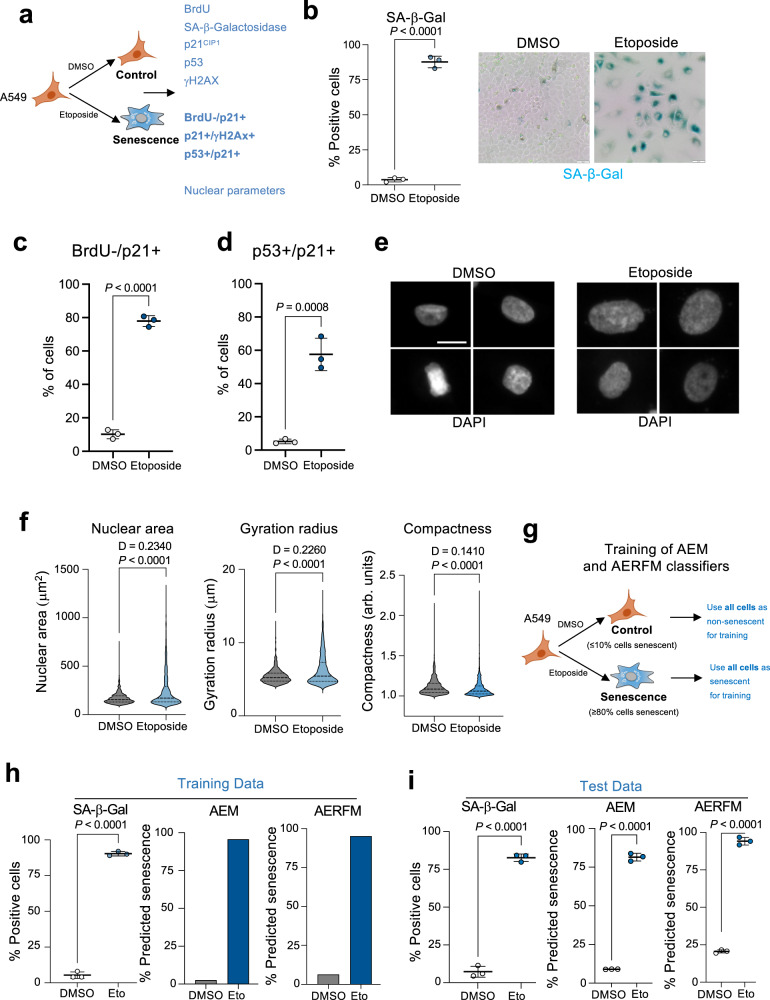
Fig. 1 Nuclear features can be used to identify senescent cells. a Experimental design for the induction and characterization of senescence in A549 cells treated with 2 μM etoposide for 7 days. b Quantification of SA-β-galactosidase (SA-β-Gal) activity after DMSO or etoposide treatment (n = 3, left) and representative images of SA-β-Gal staining (right). Scale bar, 50 μm. c, d Quantification of Brdu-/p21Cip1+ cells (c) and p21/p53 double-positive cells (d) treated with DMSO or etoposide (n = 3). e Representative images of DAPI-stained nuclei for DMSO-treated (normal) and etoposide-treated (senescent) A549 cells. Scale bar, 20 μm. f Quantification of nuclear features for DMSO and etoposide-treated A549 cells 7 days post-treatment (n = 1000 cells per group). Kolmogorov–Smirnov test was performed to assess probability distribution, with D value indicated. Data of a representative experiment out of 3. g Experimental design for the development of training sets for the AEM and AERFM senescence classifiers. h Analysis of training datasets of A549 cells treated with DMSO or etoposide. Percentage of SA-β-Gal positive cells (left, n = 3) and percentage of predicted senescent cells using the AEM (center) and AERFM (right) senescence classifiers. i Analysis of test datasets of A549 cells treated with DMSO or etoposide. Percentage of SA-β-Gal positive cells by immunofluorescent C12FDG in DMSO (normal) and etoposide-treated A549 cells (senescent) (left, n = 3). Percentage of predicted senescent cells in the validation datasets using the AEM (middle) and AERFM (right) classifiers. AEM and AERFM prediction was performed on the same cells as SA β-Gal staining. Error bars represent mean ± s.d.; n represents number of replicates except when indicated differently. All statistical significances unless indicated differently were calculated using unpaired, two-tailed, Student’s t-tests. AEM, A549 etoposide model; AERFM, A549 etoposide random forest model. Source Data are provided in the Source Data File.
Fig. 1 Nuclear features can be used to identify senescent cells. a Experimental design for the induction and characterization of senescence in A549 cells treated with 2 μM etoposide for 7 days. b Quantification of SA-β-galactosidase (SA-β-Gal) activity after DMSO or etoposide treatment (n = 3, left) and representative images of SA-β-Gal staining (right). Scale bar, 50 μm. c, d Quantification of Brdu-/p21Cip1+ cells (c) and p21/p53 double-positive cells (d) treated with DMSO or etoposide (n = 3). e Representative images of DAPI-stained nuclei for DMSO-treated (normal) and etoposide-treated (senescent) A549 cells. Scale bar, 20 μm. f Quantification of nuclear features for DMSO and etoposide-treated A549 cells 7 days post-treatment (n = 1000 cells per group). Kolmogorov–Smirnov test was performed to assess probability distribution, with D value indicated. Data of a representative experiment out of 3. g Experimental design for the development of training sets for the AEM and AERFM senescence classifiers. h Analysis of training datasets of A549 cells treated with DMSO or etoposide. Percentage of SA-β-Gal positive cells (left, n = 3) and percentage of predicted senescent cells using the AEM (center) and AERFM (right) senescence classifiers. i Analysis of test datasets of A549 cells treated with DMSO or etoposide. Percentage of SA-β-Gal positive cells by immunofluorescent C12FDG in DMSO (normal) and etoposide-treated A549 cells (senescent) (left, n = 3). Percentage of predicted senescent cells in the validation datasets using the AEM (middle) and AERFM (right) classifiers. AEM and AERFM prediction was performed on the same cells as SA β-Gal staining. Error bars represent mean ± s.d.; n represents number of replicates except when indicated differently. All statistical significances unless indicated differently were calculated using unpaired, two-tailed, Student’s t-tests. AEM, A549 etoposide model; AERFM, A549 etoposide random forest model. Source Data are provided in the Source Data File.CC BY · PubMed Central
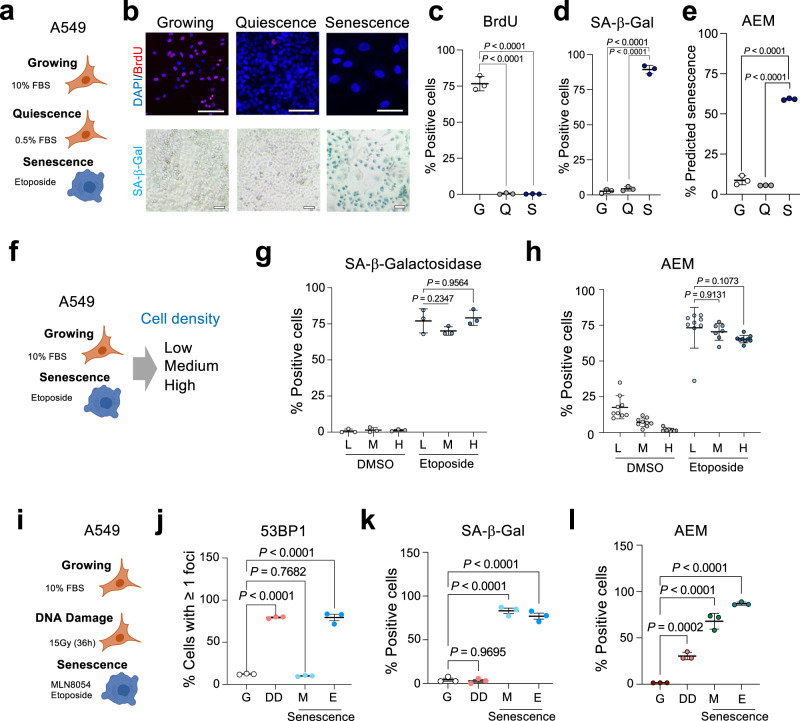
Fig. 2 Senescence classifiers distinguish senescent cells from those undergoing quiescence or DNA damage. a Experimental design for the comparison of growing, quiescent and senescent A549 cells. b Representative images of growing (10% FBS), quiescent (0.5% FBS), and senescent (10% FBS, etoposide-treated) A549 cells stained with antibodies recognizing BrdU (top). SA-β-galactosidase (SA-β-Gal) staining from the same experiment is shown at the bottom. Scale bars, 100 μM. c, d Percentage of cells incorporating BrdU (c) and staining positive for SA-β-Gal (d) (n = 3). e Percentage of cells predicted to be senescent by the AEM senescence classifier (n = 3). f Experimental design for assessing the impact of cell density in senescent prediction. g Percentage of SA-β-Gal positive A549 cells treated with either DMSO or etoposide and seeded at low (L), medium (M), and high (H) density (n = 3 per condition). h Senescence prediction using the AEM classifier of cultures of A549 cells treated with either DMSO or etoposide and seeded at low (L), medium (M), and high (H) density (n = 9 for all cases except etoposide-treated cells seeded at medium density, n = 7). i Experimental design for assessing the impact of DNA damage in senescence prediction. j 53BP1 positive cells in cultures of growing (G), irradiated (DD), and senescent (MLN8054 M; etoposide E) cells (n = 3). k, l Percentage of SA-β-Gal positive (k) and AEM positive (l) cells for the different conditions (n = 3). Error bars represent mean ± s.d.; n represents independent experiments. Statistical significance was calculated using multiple comparisons one-way ANOVA. Source Data are provided in the Source Data File.
Fig. 2 Senescence classifiers distinguish senescent cells from those undergoing quiescence or DNA damage. a Experimental design for the comparison of growing, quiescent and senescent A549 cells. b Representative images of growing (10% FBS), quiescent (0.5% FBS), and senescent (10% FBS, etoposide-treated) A549 cells stained with antibodies recognizing BrdU (top). SA-β-galactosidase (SA-β-Gal) staining from the same experiment is shown at the bottom. Scale bars, 100 μM. c, d Percentage of cells incorporating BrdU (c) and staining positive for SA-β-Gal (d) (n = 3). e Percentage of cells predicted to be senescent by the AEM senescence classifier (n = 3). f Experimental design for assessing the impact of cell density in senescent prediction. g Percentage of SA-β-Gal positive A549 cells treated with either DMSO or etoposide and seeded at low (L), medium (M), and high (H) density (n = 3 per condition). h Senescence prediction using the AEM classifier of cultures of A549 cells treated with either DMSO or etoposide and seeded at low (L), medium (M), and high (H) density (n = 9 for all cases except etoposide-treated cells seeded at medium density, n = 7). i Experimental design for assessing the impact of DNA damage in senescence prediction. j 53BP1 positive cells in cultures of growing (G), irradiated (DD), and senescent (MLN8054 M; etoposide E) cells (n = 3). k, l Percentage of SA-β-Gal positive (k) and AEM positive (l) cells for the different conditions (n = 3). Error bars represent mean ± s.d.; n represents independent experiments. Statistical significance was calculated using multiple comparisons one-way ANOVA. Source Data are provided in the Source Data File.CC BY · PubMed Central
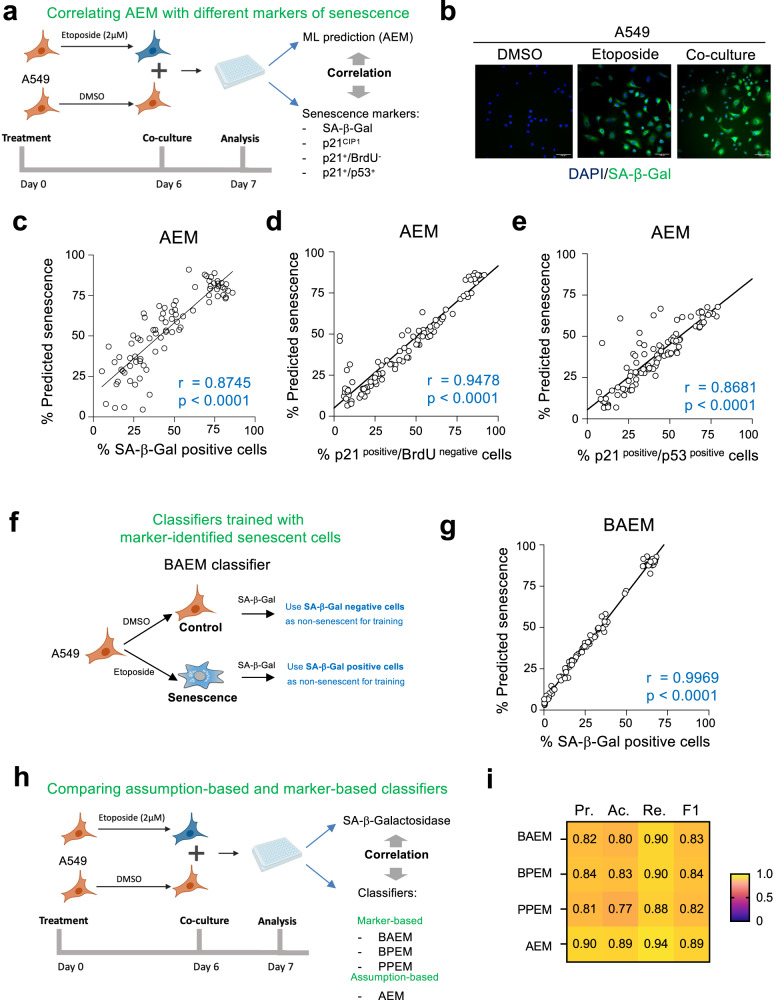
Fig. 3 Classifiers identify senescence at the single-cell level. a Design of the experiments analysing co-cultures of DMSO-treated (normal) or etoposide-treated (senescent) A549 cells. b Representative pictures out of three independent experiments of cells stained for SA-β-Galactosidase (SA-β-Gal) activity using C12FDG. Scale bars, 100 μM. c–e Correlation between percentage of SA-β-Gal positive (c) (r = 0.8745; p < 0.0001), p21CIP1 + /BrdU- (d) (r = 0.9478; p < 0.0001) and p21CIP1 + /p53+ (e) (r = 0.8681; p < 0.0001) cells and percentage of cells predicted to be senescent using AEM. Pearson correlation coefficient (two-tailed, 95% CI). r represents two-tailed nonparametric correlation probability. n = 70–96 wells. Wells are co-cultures of senescence and non-senescent cells at different ratios as explained in methods. f Experimental design for the selection of cells to train the BAEM classifier. g Correlation between percentage of SA-β-Gal positive cells and cells predicted to be senescent using BAEM (r = 0.9969; p < 0.0001); Pearson correlation coefficient (two-tailed, 95% CI). h Experimental design to compare and validate assumption-based and marker-based classifiers by control (DMSO) and senescent (etoposide) cell co-culture and corresponding SA-β-Gal staining. i Heatmap of precision (Pr.), accuracy (Ac.), recall (Re.), and F1 score (F1) median values (left to right) of BAEM, BPEM, PPEM, and AEM classifiers (top to bottom). Measures represent median values, calculated from n = 70–96 wells each. Wells are co-cultures of senescence and non-senescent cells at different ratios as explained in methods. BAEM SA-β-Gal+ A549 etoposide model, BPEM Brdu-/p21CIP1+ etoposide model, PPEM p53 + /p21CIP1+ etoposide model. Source Data are provided in the Source Data File.
Fig. 3 Classifiers identify senescence at the single-cell level. a Design of the experiments analysing co-cultures of DMSO-treated (normal) or etoposide-treated (senescent) A549 cells. b Representative pictures out of three independent experiments of cells stained for SA-β-Galactosidase (SA-β-Gal) activity using C12FDG. Scale bars, 100 μM. c–e Correlation between percentage of SA-β-Gal positive (c) (r = 0.8745; p < 0.0001), p21CIP1 + /BrdU- (d) (r = 0.9478; p < 0.0001) and p21CIP1 + /p53+ (e) (r = 0.8681; p < 0.0001) cells and percentage of cells predicted to be senescent using AEM. Pearson correlation coefficient (two-tailed, 95% CI). r represents two-tailed nonparametric correlation probability. n = 70–96 wells. Wells are co-cultures of senescence and non-senescent cells at different ratios as explained in methods. f Experimental design for the selection of cells to train the BAEM classifier. g Correlation between percentage of SA-β-Gal positive cells and cells predicted to be senescent using BAEM (r = 0.9969; p < 0.0001); Pearson correlation coefficient (two-tailed, 95% CI). h Experimental design to compare and validate assumption-based and marker-based classifiers by control (DMSO) and senescent (etoposide) cell co-culture and corresponding SA-β-Gal staining. i Heatmap of precision (Pr.), accuracy (Ac.), recall (Re.), and F1 score (F1) median values (left to right) of BAEM, BPEM, PPEM, and AEM classifiers (top to bottom). Measures represent median values, calculated from n = 70–96 wells each. Wells are co-cultures of senescence and non-senescent cells at different ratios as explained in methods. BAEM SA-β-Gal+ A549 etoposide model, BPEM Brdu-/p21CIP1+ etoposide model, PPEM p53 + /p21CIP1+ etoposide model. Source Data are provided in the Source Data File.CC BY · PubMed Central
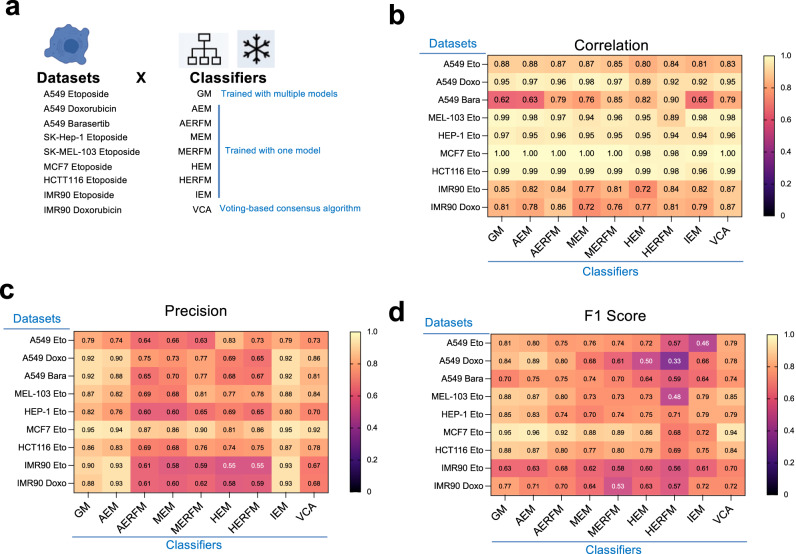
Fig. 4 Comparison of the performance of different senescence classifiers. a Experimental design for fitness assessment of different senescence classifiers in datasets derived from co-cultures of senescent cells with non-senescent counterparts. b–d Correlation (b), precision (c), and F1 score (d) of senescence classifiers (x-axis) in the different datasets (derived from co-cultures of different types of senescent cells with non-senescent counterparts) represented in heatmaps. Measures represent median values, calculated from n = 70–96 wells each. Wells are co-cultures of senescence and non-senescent cells at different ratios as explained in methods. Each heatmap contains 9 algorithms (GM, AEM, AERFM, MEM, MERFM, HEM, HERFM, and IEM) and the last column corresponds to a voting-based consensus algorithm (VCA), obtained by equal weight voting system of the previous 8 algorithms. Source Data are provided in the Source Data File.
Fig. 4 Comparison of the performance of different senescence classifiers. a Experimental design for fitness assessment of different senescence classifiers in datasets derived from co-cultures of senescent cells with non-senescent counterparts. b–d Correlation (b), precision (c), and F1 score (d) of senescence classifiers (x-axis) in the different datasets (derived from co-cultures of different types of senescent cells with non-senescent counterparts) represented in heatmaps. Measures represent median values, calculated from n = 70–96 wells each. Wells are co-cultures of senescence and non-senescent cells at different ratios as explained in methods. Each heatmap contains 9 algorithms (GM, AEM, AERFM, MEM, MERFM, HEM, HERFM, and IEM) and the last column corresponds to a voting-based consensus algorithm (VCA), obtained by equal weight voting system of the previous 8 algorithms. Source Data are provided in the Source Data File.CC BY · PubMed Central
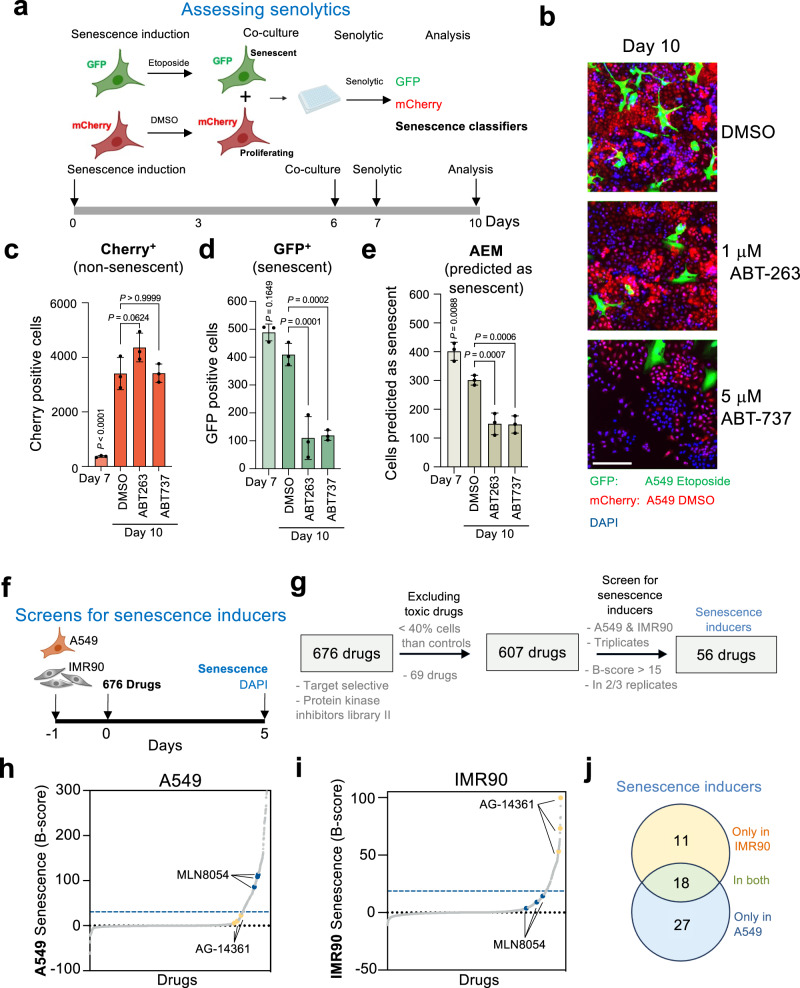
Fig. 5 Senescence classifiers can assist in characterizing and identifying senotherapies. a Experimental design and timeline for assessing senolytic drugs. b Representative images of co-cultures of senescent (GFP) and non-senescent (mCherry) A549 cells 72 h after treatment with DMSO (top), ABT-263 (middle), and ABT-737 (bottom). Scale bar, 200 μM. c–e Quantification of mCherry positive cells (c), GFP positive cells (d) and cells predicted to be senescent by AEM (e), before and after treatment with the different drugs (n = 3). f Experimental design, and timeline for the screen for drugs inducing senescence. Drugs were used at 10 μM. g Summary of the screen results. h, i Distribution of B-score results in A549 (h) and IMR90 (i). The blue dashed line indicates the threshold (B-score > 15). Examples of an A549-specific hit MLN8054 (blue) and an IMR90-specific AG-14361 (yellow) are highlighted. j Venn Diagram for senescence-inducing drugs with selectivity for IMR90 (yellow), A549 (blue) or both (green). Data represent mean ± s.d. n represents independent experiments. Source Data are provided in the Source Data File.
Fig. 5 Senescence classifiers can assist in characterizing and identifying senotherapies. a Experimental design and timeline for assessing senolytic drugs. b Representative images of co-cultures of senescent (GFP) and non-senescent (mCherry) A549 cells 72 h after treatment with DMSO (top), ABT-263 (middle), and ABT-737 (bottom). Scale bar, 200 μM. c–e Quantification of mCherry positive cells (c), GFP positive cells (d) and cells predicted to be senescent by AEM (e), before and after treatment with the different drugs (n = 3). f Experimental design, and timeline for the screen for drugs inducing senescence. Drugs were used at 10 μM. g Summary of the screen results. h, i Distribution of B-score results in A549 (h) and IMR90 (i). The blue dashed line indicates the threshold (B-score > 15). Examples of an A549-specific hit MLN8054 (blue) and an IMR90-specific AG-14361 (yellow) are highlighted. j Venn Diagram for senescence-inducing drugs with selectivity for IMR90 (yellow), A549 (blue) or both (green). Data represent mean ± s.d. n represents independent experiments. Source Data are provided in the Source Data File.CC BY · PubMed Central
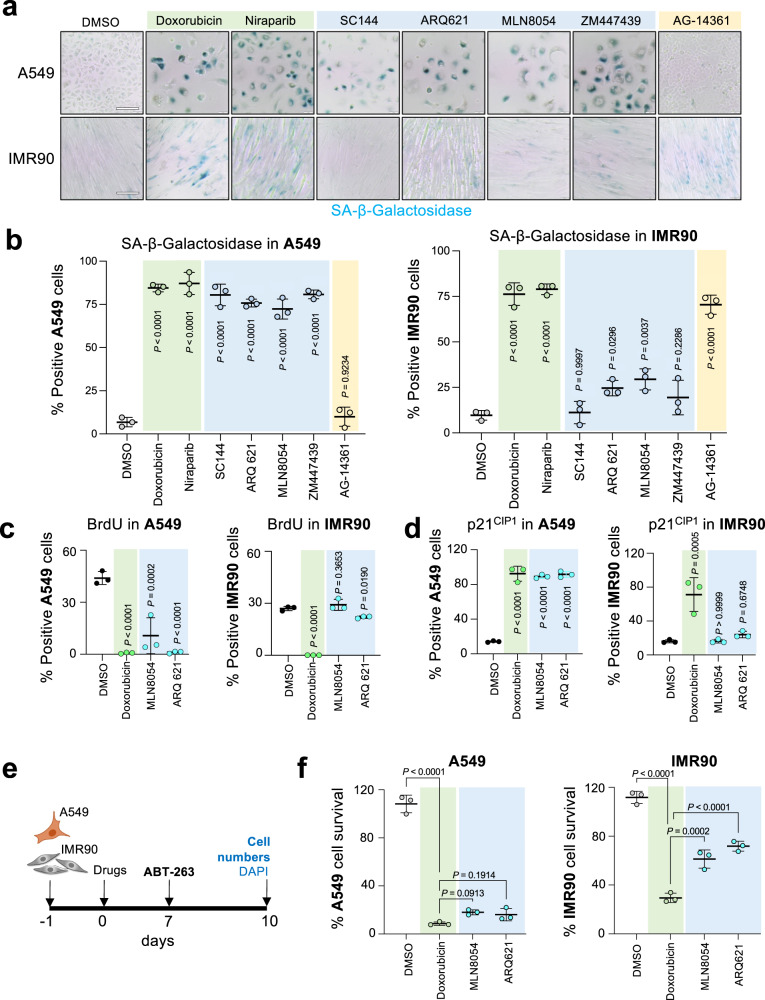
Fig. 6 Characterization of MLN8054 and ARQ621 as drugs preferentially inducing senescence in A549 over IMR90 cells. a Images of SA-β-galactosidase (SA-β-Gal) staining on A549 (top) and IMR90 (bottom) cells treated with the indicated drugs. Representative images of one out of 3 experiments. Scale bar, 100 μM. b Percentage of SA-β-Gal positive cells after 7-day treatment with the indicated drugs in A549 cells (left) and IMR90 (right) cells (n = 3). c, d Quantification of BrdU (c) and p21CIP1 (d) positive cells by immunofluorescence in A549 (left) and IMR90 (right) cells after treatment with selected drugs (n = 3). e Experimental design and timeline of the senolytic experiment quantified in (f). f Senolytic activity after treatment with 1 μM ABT-263 for 72 h in either A549 (left) or IMR90 (right) cells treated for 7 days with the indicated drugs (n = 3). Drug concentrations used in (c, d), f doxorubicin, 0.5 μM; MLN8054, 3 μM; ARQ 621, 0.1 μM. Significance was calculated with a one-way ANOVA (Tukey’s multiple comparisons test). Data represent mean ± s.d. n represents independent experiments. Source Data are provided in the Source Data File.
Fig. 6 Characterization of MLN8054 and ARQ621 as drugs preferentially inducing senescence in A549 over IMR90 cells. a Images of SA-β-galactosidase (SA-β-Gal) staining on A549 (top) and IMR90 (bottom) cells treated with the indicated drugs. Representative images of one out of 3 experiments. Scale bar, 100 μM. b Percentage of SA-β-Gal positive cells after 7-day treatment with the indicated drugs in A549 cells (left) and IMR90 (right) cells (n = 3). c, d Quantification of BrdU (c) and p21CIP1 (d) positive cells by immunofluorescence in A549 (left) and IMR90 (right) cells after treatment with selected drugs (n = 3). e Experimental design and timeline of the senolytic experiment quantified in (f). f Senolytic activity after treatment with 1 μM ABT-263 for 72 h in either A549 (left) or IMR90 (right) cells treated for 7 days with the indicated drugs (n = 3). Drug concentrations used in (c, d), f doxorubicin, 0.5 μM; MLN8054, 3 μM; ARQ 621, 0.1 μM. Significance was calculated with a one-way ANOVA (Tukey’s multiple comparisons test). Data represent mean ± s.d. n represents independent experiments. Source Data are provided in the Source Data File.CC BY · PubMed Central
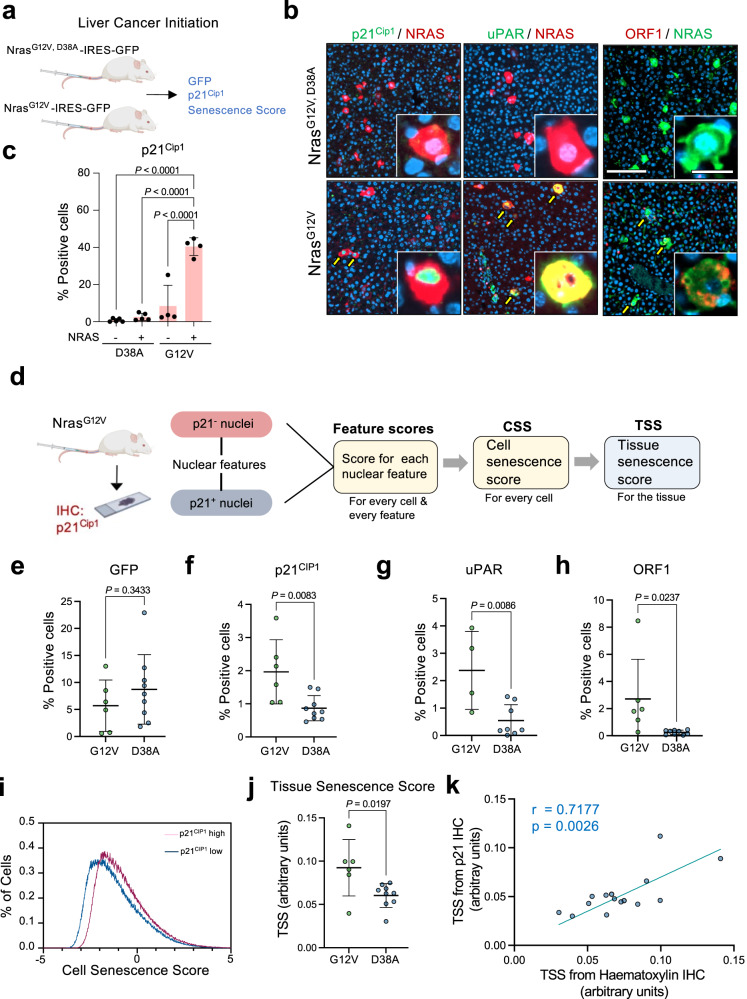
Fig. 7 Tissue senescence score predicts senescence induced during liver cancer initiation. a Experimental design for analysis of senescence in the liver cancer initiation model. b Representative images of liver sections obtained of mice transduced with NrasG12V or NrasG12V, D38A. Liver sections were co-stained with antibodies recognizing NRAS and p21Cip1 (left), uPAR (middle), and ORF1 (right). Scale bar, 200 μm in the main picture and 20 μm in the insets. Yellow arrows mark double-positive cells. c Quantification of cells positive for p21Cip1 as assessed by immunofluorescence in mice transduced with NrasG12V-ires-GFP (n = 4) or NrasG12V, D38A-ires-GFP (n = 5). GFP indicates NRAS-positive cells. Significance was calculated with a one-way ANOVA (Tukey’s multiple comparisons test). Data represent mean ± s.d. d Experimental design for the development of a nuclear feature-based senescence scoring system in vivo. e, f Percentage of GFP (e) and p21Cip1 (f) positive cells in the liver section of mice transduced with the NrasG12V, D38A (D38A, n = 9) or NrasG12V (G12V, n = 6) expressing transposons. Significance was calculated using an unpaired two-tailed t-test. g, h Percentage of uPAR (g) and ORF-1 (h) positive cells in NrasG12V/NrasG12V, D38A mice. Significance for uPAR (NrasG12V n = 4; NrasG12V,D38A n = 8) and ORF-1 (NrasG12V n = 6; NrasG12V,D38A n = 10) was calculated using unpaired two-tailed t-test. i Distribution of cell senescence score in two sections corresponding to p21Cip1 high (red) and low (blue) samples of the liver cancer initiation experiment. j Tissue senescence score calculated in hematoxylin-stained liver sections of mice transduced with the NrasG12V, D38A (D38A, n = 9) or NrasG12V (G12V, n = 6) expressing transposons. Statistical significance was calculated using unpaired t-test. k Pearson correlation coefficient (two-tailed, 95% CI) between tissue senescence score calculated in hematoxylin-stained and p21Cip1-stained liver sections (n = 15). p represents two-tailed nonparametric correlation probability. Data represent mean ± s.d; n represents number of mice. Source Data are provided in the Source Data File.
Fig. 7 Tissue senescence score predicts senescence induced during liver cancer initiation. a Experimental design for analysis of senescence in the liver cancer initiation model. b Representative images of liver sections obtained of mice transduced with NrasG12V or NrasG12V, D38A. Liver sections were co-stained with antibodies recognizing NRAS and p21Cip1 (left), uPAR (middle), and ORF1 (right). Scale bar, 200 μm in the main picture and 20 μm in the insets. Yellow arrows mark double-positive cells. c Quantification of cells positive for p21Cip1 as assessed by immunofluorescence in mice transduced with NrasG12V-ires-GFP (n = 4) or NrasG12V, D38A-ires-GFP (n = 5). GFP indicates NRAS-positive cells. Significance was calculated with a one-way ANOVA (Tukey’s multiple comparisons test). Data represent mean ± s.d. d Experimental design for the development of a nuclear feature-based senescence scoring system in vivo. e, f Percentage of GFP (e) and p21Cip1 (f) positive cells in the liver section of mice transduced with the NrasG12V, D38A (D38A, n = 9) or NrasG12V (G12V, n = 6) expressing transposons. Significance was calculated using an unpaired two-tailed t-test. g, h Percentage of uPAR (g) and ORF-1 (h) positive cells in NrasG12V/NrasG12V, D38A mice. Significance for uPAR (NrasG12V n = 4; NrasG12V,D38A n = 8) and ORF-1 (NrasG12V n = 6; NrasG12V,D38A n = 10) was calculated using unpaired two-tailed t-test. i Distribution of cell senescence score in two sections corresponding to p21Cip1 high (red) and low (blue) samples of the liver cancer initiation experiment. j Tissue senescence score calculated in hematoxylin-stained liver sections of mice transduced with the NrasG12V, D38A (D38A, n = 9) or NrasG12V (G12V, n = 6) expressing transposons. Statistical significance was calculated using unpaired t-test. k Pearson correlation coefficient (two-tailed, 95% CI) between tissue senescence score calculated in hematoxylin-stained and p21Cip1-stained liver sections (n = 15). p represents two-tailed nonparametric correlation probability. Data represent mean ± s.d; n represents number of mice. Source Data are provided in the Source Data File.CC BY · PubMed Central
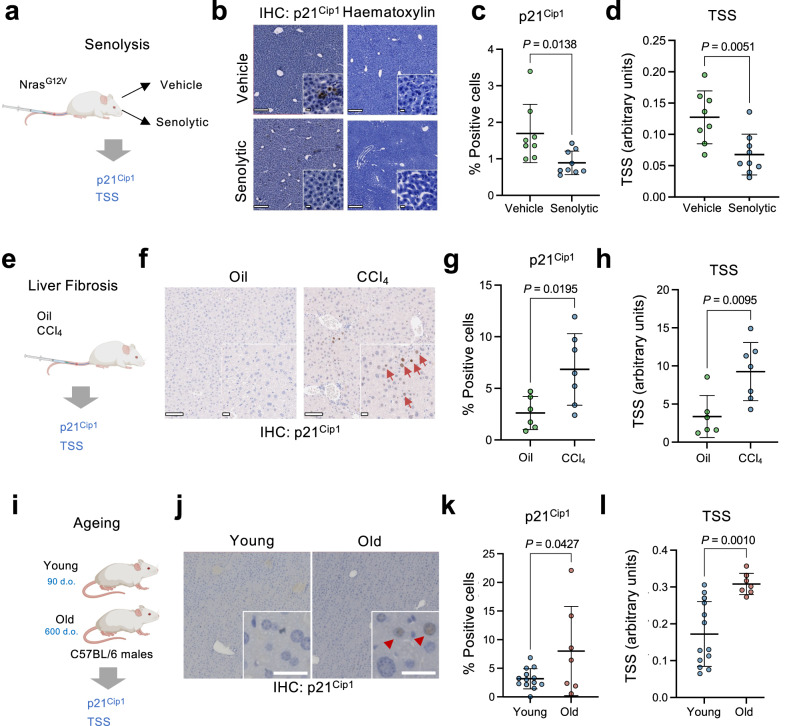
Fig. 8 Tissue senescence score predicts the effect of senolytic drugs and identifies senescence in liver fibrosis and aging. a Experimental design for analyzing senescence in the senolysis experiment. b Representative images of p21Cip1 and hematoxylin staining in liver sections. Scale bars are 100 μm in the main picture and 20 μm for the insets. The insets correspond to images from the same slides. c Percentage of p21Cip1 positive cells in the liver section of mice transduced with a NrasG12V expressing transposon and treated with either vehicle (n = 8) or a senolytic drug (n = 9). d Tissue senescence score calculated in p21Cip1-stained liver sections of mice transduced with a NrasG12V expressing transposon and treated with either vehicle (n = 8) or a senolytic drug (n = 9). e Experimental design for assessing senescence in the liver fibrosis model. f Representative images of p21Cip1 IHC staining in liver sections. Red arrows mark p21Cip1-positive cells. Scale bars are 100 μm in the main picture and 20 μm for the insets. g Percentage of p21Cip1 positive cells in the liver section of mice treated with corn oil (oil) as a control (n = 6) or CCl4 (n = 7) to induce liver fibrosis. h Tissue senescence score calculated in p21Cip1-stained liver sections of mice treated with corn oil as a control (n = 6) or CCl4 (n = 7) to induce liver fibrosis. i Experimental design for assessing senescence in liver sections during aging. j Representative images of p21Cip1 stained in liver sections for young (n = 13) and old (n = 7) mice. Red arrows mark p21Cip1- positive cells. Scale bar, 30 μm. k Percentage of p21Cip1 positive cells in liver sections for young (n = 13) and old (n = 7) mice. l Tissue senescence score calculated in p21Cip1-stained liver sections for young (n = 13) and old (n = 7) mice. Statistical significance for all comparisons was calculated using an unpaired two-tailed t-test. Data represent mean ± s.d; n represents the number of mice. Source Data are provided in the Source Data File.
Fig. 8 Tissue senescence score predicts the effect of senolytic drugs and identifies senescence in liver fibrosis and aging. a Experimental design for analyzing senescence in the senolysis experiment. b Representative images of p21Cip1 and hematoxylin staining in liver sections. Scale bars are 100 μm in the main picture and 20 μm for the insets. The insets correspond to images from the same slides. c Percentage of p21Cip1 positive cells in the liver section of mice transduced with a NrasG12V expressing transposon and treated with either vehicle (n = 8) or a senolytic drug (n = 9). d Tissue senescence score calculated in p21Cip1-stained liver sections of mice transduced with a NrasG12V expressing transposon and treated with either vehicle (n = 8) or a senolytic drug (n = 9). e Experimental design for assessing senescence in the liver fibrosis model. f Representative images of p21Cip1 IHC staining in liver sections. Red arrows mark p21Cip1-positive cells. Scale bars are 100 μm in the main picture and 20 μm for the insets. g Percentage of p21Cip1 positive cells in the liver section of mice treated with corn oil (oil) as a control (n = 6) or CCl4 (n = 7) to induce liver fibrosis. h Tissue senescence score calculated in p21Cip1-stained liver sections of mice treated with corn oil as a control (n = 6) or CCl4 (n = 7) to induce liver fibrosis. i Experimental design for assessing senescence in liver sections during aging. j Representative images of p21Cip1 stained in liver sections for young (n = 13) and old (n = 7) mice. Red arrows mark p21Cip1- positive cells. Scale bar, 30 μm. k Percentage of p21Cip1 positive cells in liver sections for young (n = 13) and old (n = 7) mice. l Tissue senescence score calculated in p21Cip1-stained liver sections for young (n = 13) and old (n = 7) mice. Statistical significance for all comparisons was calculated using an unpaired two-tailed t-test. Data represent mean ± s.d; n represents the number of mice. Source Data are provided in the Source Data File.CC BY · PubMed Central
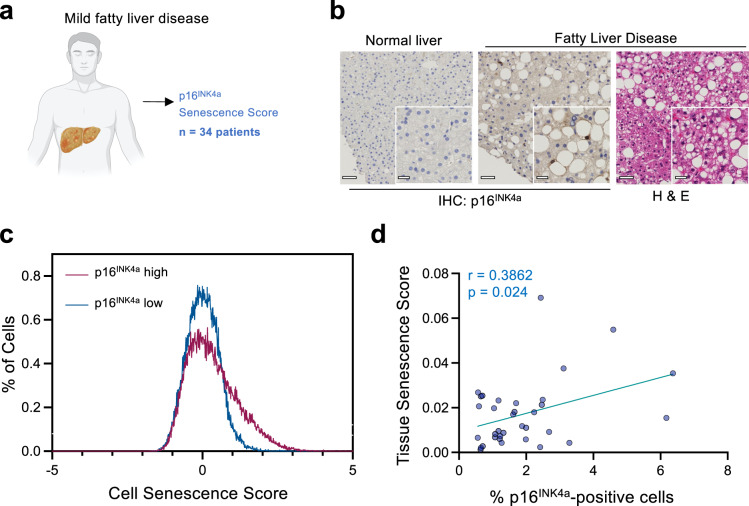
Fig. 9 Tissue senescence scores identify senescence in patients with non-alcoholic fatty liver disease (NAFLD). a Schematic for the analysis of liver sections from patients with mild fatty liver disease. b Representative images of p16INK4a and H&E-stained liver sections in normal and fatty liver (out of 34) patients. Scale bar, 50μm in the main image, 20 μm for the zoomed section. c Distribution of cell senescence score in two sections corresponding to samples with a high (p16 = 9.0876%) and low (p16 = 0.2233%) percentage of p16INK4a positive cells. d Correlation between tissue senescence scores and percentage of p16INK4a positive cells (n = 34 patients). Pearson correlation coefficient (two-tailed, 95% CI) was used (r = 0.3862; p = 0.024). p represents two-tailed nonparametric correlation probability. (n = 34 liver sections from different patients). Source Data are provided in the Source Data File.
Fig. 9 Tissue senescence scores identify senescence in patients with non-alcoholic fatty liver disease (NAFLD). a Schematic for the analysis of liver sections from patients with mild fatty liver disease. b Representative images of p16INK4a and H&E-stained liver sections in normal and fatty liver (out of 34) patients. Scale bar, 50μm in the main image, 20 μm for the zoomed section. c Distribution of cell senescence score in two sections corresponding to samples with a high (p16 = 9.0876%) and low (p16 = 0.2233%) percentage of p16INK4a positive cells. d Correlation between tissue senescence scores and percentage of p16INK4a positive cells (n = 34 patients). Pearson correlation coefficient (two-tailed, 95% CI) was used (r = 0.3862; p = 0.024). p represents two-tailed nonparametric correlation probability. (n = 34 liver sections from different patients). Source Data are provided in the Source Data File.CC BY · PubMed Central

Verification

Claims the paper makes

The claims and statistics of this paper haven’t been checked yet.

Free: it reads the open-access text and checks the first 5 claims that cite a source we can check. Create a free account to check every claim.

A few free checks a day · papers already verified open instantly · results are public

Claims other papers make about this one

Each is checked against this paper’s own text: does it say what the citing paper says it does?

Self-check

Percentages, sums and reported differences re-computed from the paper’s own numbers.

The self-check needs the paper’s full text.

Citations

Cites

Show all 49 references

Cited by

See all 94

Metadata

Authors
Duran, I., Pombo, J., Sun, B., Gallage, S., Kudo, H., McHugh, D., Bousset, L., Barragan Avila, J. E., Forlano, R., Manousou, P., Heikenwalder, M., Withers, D. J., Vernia, S., Goldin, R. D., & Gil, J.
Affiliations
  • MRC London Institute of Medical Sciences (GB)
  • German Cancer Research Center (DE)
  • Imperial College London (GB)
Corresponding author
Gil, Jesús
Venue
Nature Communications
Published
2024-02-03
Volume
15
Issue
1
Pages
1041-1041
ISSN
2041-1723 (ISSN-L)
OpenAlex
W4391515326
Cited by
85
References
50
Citations by year
2026: 31 · 2025: 32 · 2024: 22
FWCI
24.19
Type
journal article
Language
en
Open access
Licence
Locations
  • Nature Communications (publishedVersion, cc-by)
  • PubMed Central (publishedVersion, cc-by)
  • PubMed (publishedVersion)
  • RePEc: Research Papers in Economics (submittedVersion)
  • DOAJ (DOAJ: Directory of Open Access Journals) (submittedVersion)
  • Spiral (Imperial College London) (submittedVersion, cc-by-nc)
  • Imperial College Research Computing Service Data Repository
Funders
  • Wellcome Trust (098565/Z/12/Z)
  • Cancer Research UK (C15075/A28647, 28647)
  • National Institute for Health and Care Research
  • Imperial College London
  • University of Oxford
  • Fonds Wetenschappelijk Onderzoek (30826052)
  • Vlaamse regering
  • Medical Research Council (MC-A654-5QB40, MC-U120085810)
  • NIHR Imperial Biomedical Research Centre
Topics
  • Life Sciences › Biochemistry, Genetics and Molecular Biology › Cell Biology › Telomeres, Telomerase, and Senescence
  • Life Sciences › Biochemistry, Genetics and Molecular Biology › Aging › Genetics, Aging, and Longevity in Model Organisms
  • Life Sciences › Biochemistry, Genetics and Molecular Biology › Biophysics › Cell Image Analysis Techniques
Keywords
cellular senescence, senolytics, senotherapy, liver cancer, aging, liver fibrosis, hepatic steatosis
MeSH terms
Aging, Animals, Fibrosis, Humans, Cellular Senescence, Mice

About these checks

Registry, retraction, Cites and statistics results are computed, not judged, with one exception: a printed reference that no index lists is read once by a model before it counts as a citation error. Claims are extracted by a model and kept only when their quote appears verbatim in the text; each cited source is then checked, with a model’s help, for whether it says what the claim relies on. Those verdicts can be wrong — read the claim’s quote and the cited source before relying on one.

Statistics and arithmetic are recomputed, not judged.

Confidence bands are shown only for fields calibrated on our annotated test set. None is calibrated yet, so no band is shown.

What counts as a claim ›How we measure confidence ›How we check this ›

Are you an author, or do you see a problem with this page? Request a review

How to cite

Cite CoChat for the checks on this page, and the paper for its own findings.

This page
CoChat. (2026). Citation check: Detection of senescence using machine learning algorithms based on nuclear features. https://app.cochat.ai/papers/10.1038/s41467-024-45421-w
The paper
Duran, I., Pombo, J., Sun, B., Gallage, S., Kudo, H., McHugh, D., Bousset, L., Barragan Avila, J. E., Forlano, R., Manousou, P., Heikenwalder, M., Withers, D. J., Vernia, S., Goldin, R. D., & Gil, J. (2024). Detection of senescence using machine learning algorithms based on nuclear features. Nature Communications. https://doi.org/10.1038/s41467-024-45421-w

Data sources

Bibliographic data: Semantic Scholar, OpenAlex, Crossref.

Contains information from the Semantic Scholar Academic Graph Datasets, made available under the ODC Attribution License (ODC-BY 1.0).

Semantic Scholar’s data is described in: Kinney, R., et al. (2023). The Semantic Scholar Open Data Platform. arXiv:2301.10140.