

The DOI matches its Crossref record; 52 of the 52 references it cites were found in a registry or an index.
High-throughput prediction of protein conformational distributions with subsampled AlphaFold2
Open accessAbstract
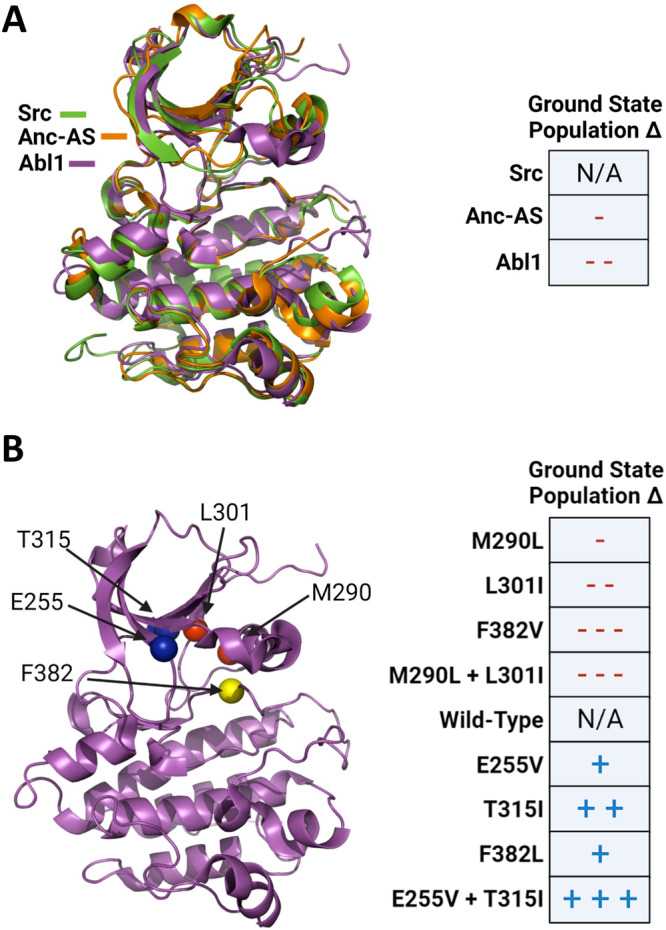
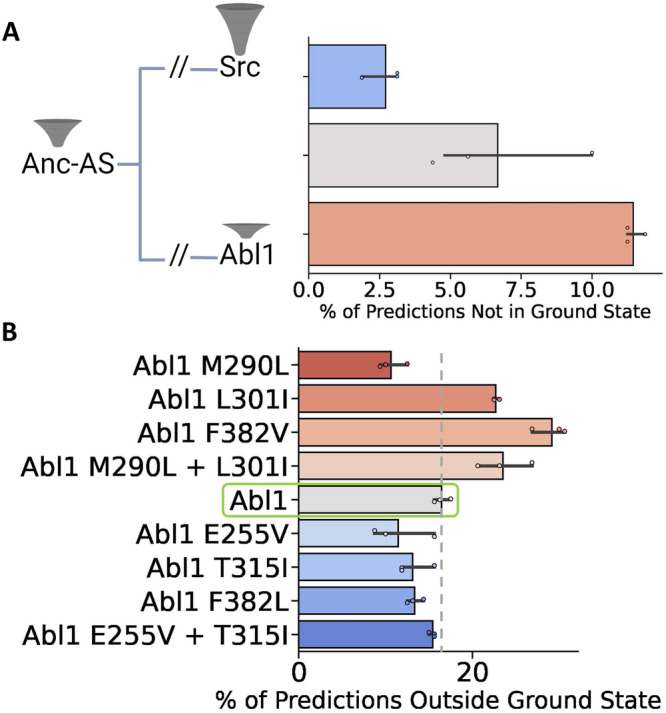
This paper presents an innovative approach for predicting the relative populations of protein conformations using AlphaFold 2, an AI-powered method that has revolutionized biology by enabling the accurate prediction of protein structures. While AlphaFold 2 has shown exceptional accuracy and speed, it is designed to predict proteins’ ground state conformations and is limited in its ability to predict conformational landscapes. Here, we demonstrate how AlphaFold 2 can directly predict the relative populations of different protein conformations by subsampling multiple sequence alignments. We tested our method against nuclear magnetic resonance experiments on two proteins with drastically different amounts of available sequence data, Abl1 kinase and the granulocyte-macrophage colony-stimulating factor, and predicted changes in their relative state populations with more than 80% accuracy. Our subsampling approach worked best when used to qualitatively predict the effects of mutations or evolution on the conformational landscape and well-populated states of proteins. It thus offers a fast and cost-effective way to predict the relative populations of protein conformations at even single-point mutation resolution, making it a useful tool for pharmacology, analysis of experimental results, and predicting evolution.
Overview
The claims and statistics of this paper haven’t been checked yet.
Run the check — free, no account needed. It reads the open-access text and checks the sources it cites.
Integrity signals
Registry
Cites
Statistics
Figures
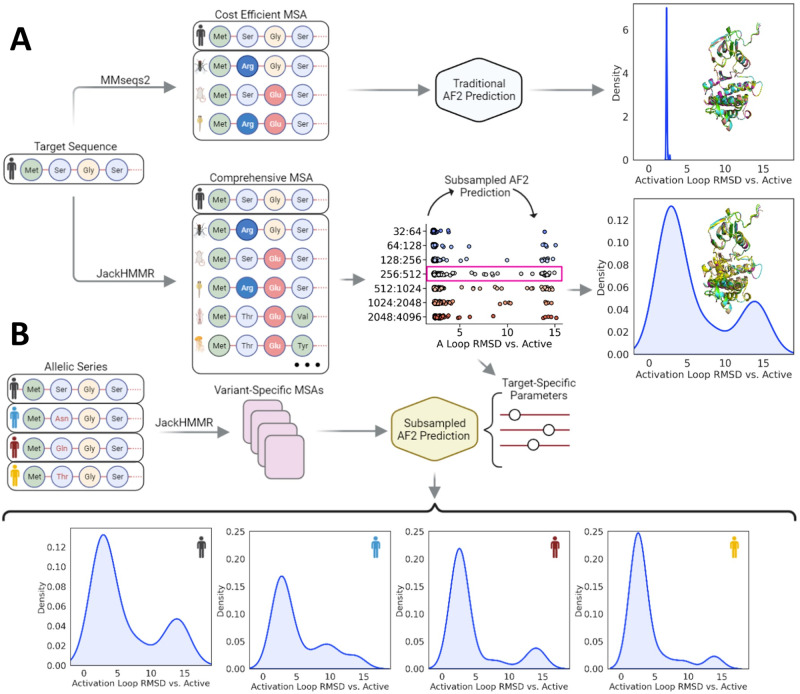
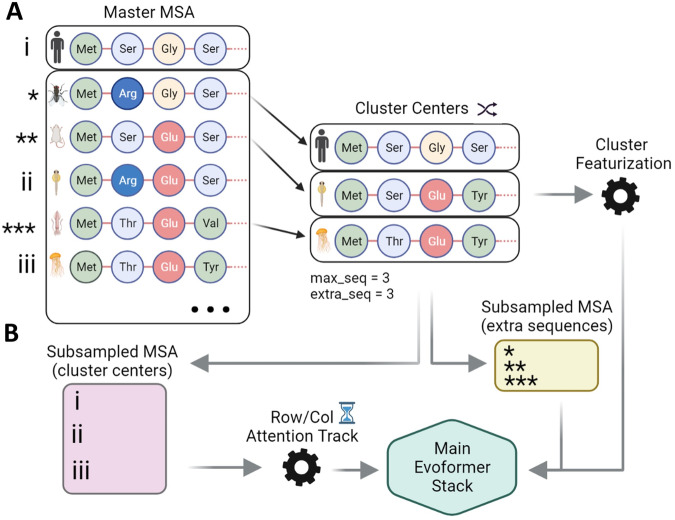
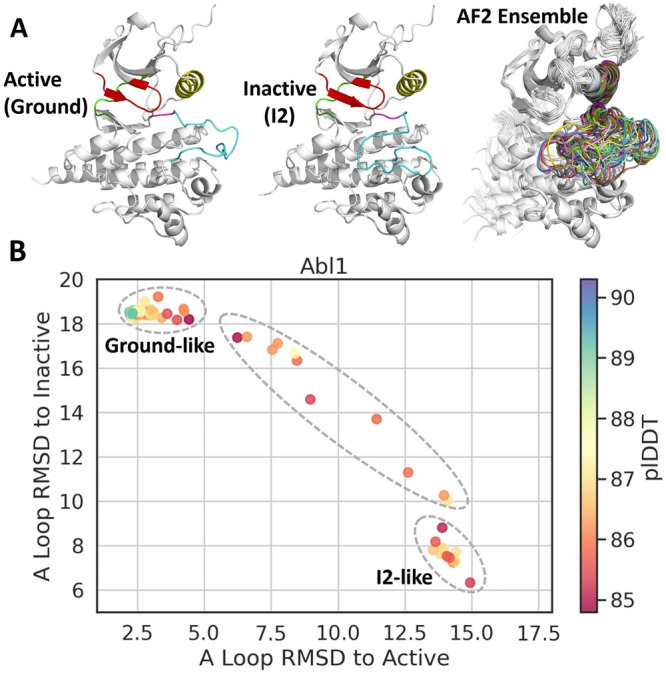
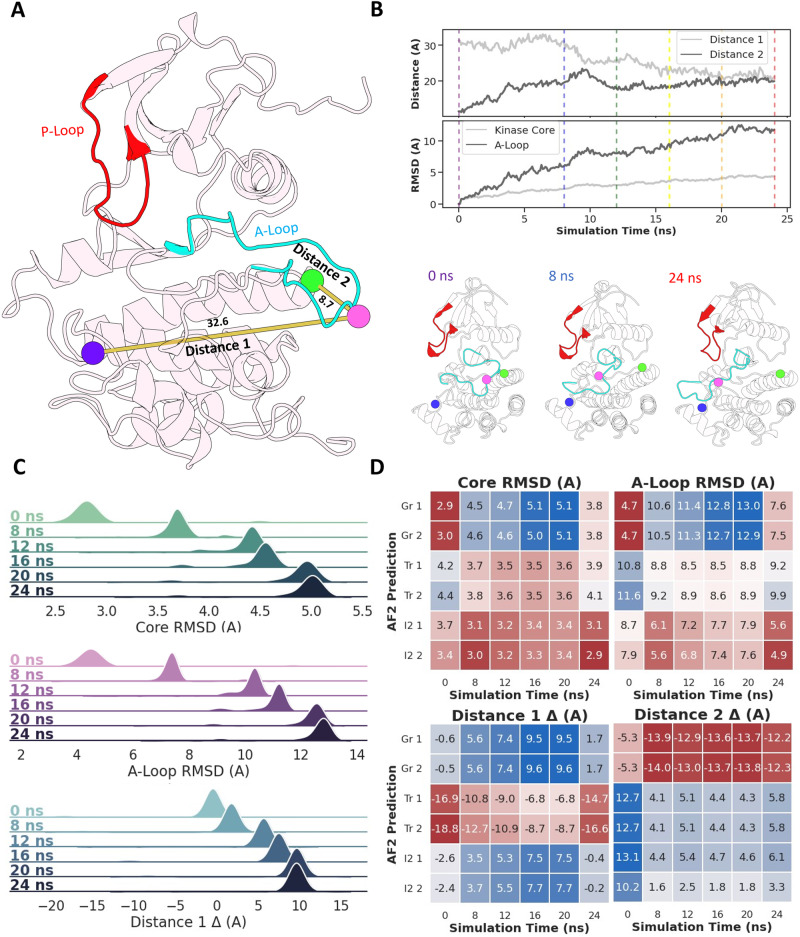
Verification
Claims the paper makes
The claims and statistics of this paper haven’t been checked yet.
Run the check — free, no account needed. It reads the open-access text and checks the sources it cites.
Claims other papers make about this one
Each is checked against this paper’s own text: does it say what the citing paper says it does?
In the citing paper
“Sequences were clustered by similarity [21], and one representative per cluster was randomly chosen to ensure diversity and reduce redundancy.”
From Reshaping biomolecular structure prediction through strategic conformational exploration with HelixFold-S1 (2026) · cites this paper as [21]
Self-check
Percentages, sums and reported differences re-computed from the paper’s own numbers.
The self-check needs the paper’s full text.
Citations
Cites
Highly accurate protein structure prediction with AlphaFold
Jumper, J., Evans, R., Pritzel, A., Green, T., Figurnov, M., Ronneberger, O., Tunyasuvunakool, K., Bates, R., Žídek, A., Potapenko, A., et al. (2021) · Nature · doi:10.1038/s41586-021-03819-2 · Cited by 43,764
NMRPipe: A multidimensional spectral processing system based on UNIX pipes
Delaglio, F., Grzesiek, S., Vuister, G. W., Zhu, G., Pfeifer, J., & Bax, A. (1995) · Journal of Biomolecular NMR · doi:10.1007/bf00197809 · Cited by 15,961
ColabFold - Making protein folding accessible to all
Mirdita, M., Schütze, K., Moriwaki, Y., Heo, L., Ovchinnikov, S., & Steinegger, M. (2021) · doi:10.1101/2021.08.15.456425 · Cited by 9,391
Evolutionary-scale prediction of atomic level protein structure with a language model
Lin, Z., Akin, H., Rao, R., Hie, B., Zhu, Z., Lu, W., Smetanin, N., Verkuil, R., Kabeli, O., Shmueli, Y., et al. (2022) · doi:10.1101/2022.07.20.500902 · Cited by 5,990
HMMER web server: interactive sequence similarity searching
Finn, R. D., Clements, J., & Eddy, S. R. (2011) · Nucleic Acids Research · doi:10.1093/nar/gkr367 · Cited by 5,952
Evans, D. J., & Holian, B. L. (1985) · The Journal of Chemical Physics · doi:10.1063/1.449071 · Cited by 3,644
Highly accurate protein structure prediction for the human proteome
Tunyasuvunakool, K., Adler, J., Wu, Z., Green, T., Zielinski, M., Žídek, A., Bridgland, A., Cowie, A., Meyer, C., Laydon, A., et al. (2021) · Nature · doi:10.1038/s41586-021-03828-1 · Cited by 3,025 · cited 1×
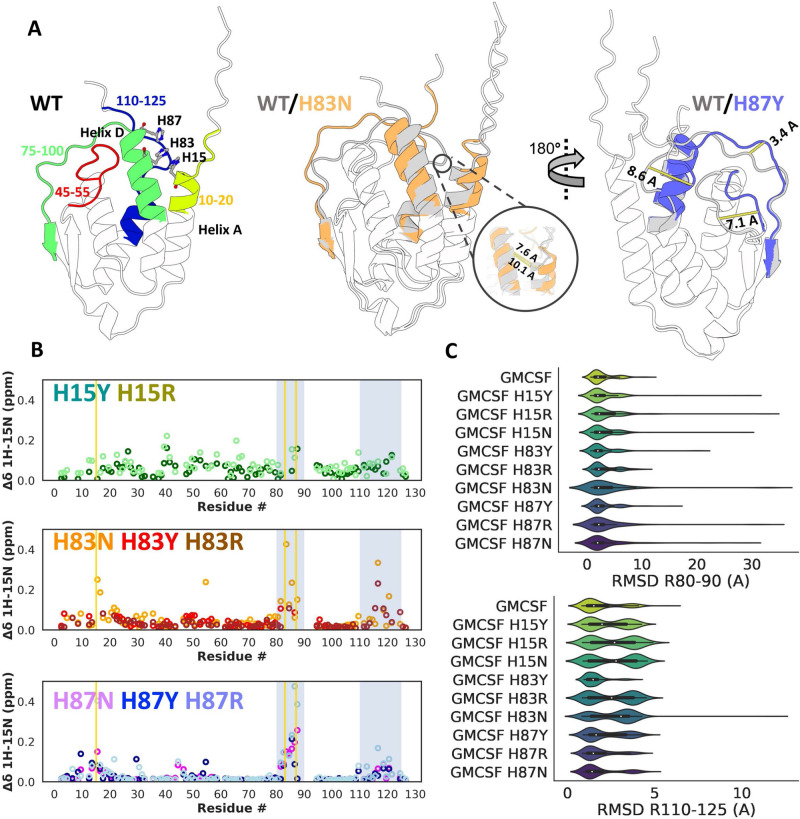
“11 and 12) have shown that point mutations in the aforementioned histidine triad lead tosigni fi cant chemicalshift perturbations,similartothosecaused byreductionsinpH 40 ,hintingatincreasedoccupancyoftheopenstate or other unknown conformations.”
OpenMM 7: Rapid development of high performance algorithms for molecular dynamics
Eastman, P., Swails, J., Chodera, J. D., McGibbon, R. T., Zhao, Y., Beauchamp, K. A., Wang, L.-P., Simmonett, A. C., Harrigan, M. P., Stern, C. D., et al. (2017) · PLOS Computational Biology · doi:10.1371/journal.pcbi.1005659 · Cited by 2,748
Kay, L. E., Keifer, P. A., & Saarinen, T. (1992) · Journal of the American Chemical Society · doi:10.1021/ja00052a088 · Cited by 2,261
NMRFAM-SPARKY: enhanced software for biomolecular NMR spectroscopy
Lee, W., Tonelli, M., & Markley, J. L. (2014) · Bioinformatics · doi:10.1093/bioinformatics/btu830 · Cited by 2,076
Research works printed but not linked: 1
- Palmer, A. G., Cavanagh, J., Wright, P. E. & Rance, M. Sensitivity improvement in proton-detected two-dimensional heteronuclear correlation nmr spectroscopy. J. Magn. Resonance 93, 151–170 (1991).
Cited by
Sorted by citations
Easy and accurate protein structure prediction using ColabFold
Kim, G., Lee, S., Karin, E. L., Kim, H., Moriwaki, Y., Ovchinnikov, S., Steinegger, M., & Mirdita, M. (2024) · Nature Protocols · doi:10.1038/s41596-024-01060-5 · Cited by 170
AlphaFold predictions of fold-switched conformations are driven by structure memorization
Chakravarty, D., Schafer, J. W., Chen, E. A., Thole, J. F., Ronish, L. A., Lee, M., & Porter, L. L. (2024) · Nature Communications · doi:10.1038/s41467-024-51801-z · Cited by 159
Molecular principles underlying aggressive cancers
Nussinov, R., Yavuz, B. R., & Jang, H. (2025) · Signal Transduction and Targeted Therapy · doi:10.1038/s41392-025-02129-7 · Cited by 91
Proteins with alternative folds reveal blind spots in AlphaFold-based protein structure prediction
Chakravarty, D., Lee, M., & Porter, L. L. (2025) · Current Opinion in Structural Biology · doi:10.1016/j.sbi.2024.102973 · Cited by 76
Beyond static structures: protein dynamic conformations modeling in the post-AlphaFold era
Cui, X., Ge, L., Chen, X., Lv, Z., Wang, S., Zhou, X., & Zhang, G. (2025) · Briefings in Bioinformatics · doi:10.1093/bib/bbaf340 · Cited by 70
Predicting protein conformational motions using energetic frustration analysis and AlphaFold2
Guan, X., Tang, Q.-Y., Ren, W., Chen, M., Wang, W., Wolynes, P. G., & Li, W. (2024) · Proceedings of the National Academy of Sciences · doi:10.1073/pnas.2410662121 · Cited by 62
Bacterial Metallostasis: Metal Sensing, Metalloproteome Remodeling, and Metal Trafficking
Capdevila, D. A., Rondón, J. J., Edmonds, K. A., Rocchio, J. S., Dujovne, M. V., & Giedroc, D. P. (2024) · Chemical Reviews · doi:10.1021/acs.chemrev.4c00264 · Cited by 64
Lee, M., Schafer, J. W., Prabakaran, J., Chakravarty, D., Clore, M. F., & Porter, L. L. (2025) · Nature Communications · doi:10.1038/s41467-025-60759-5 · Cited by 38
Lazou, M., Khan, O., Nguyen, T., Padhorny, D., Kozakov, D., Joseph‐McCarthy, D., & Vajda, S. (2024) · Proceedings of the National Academy of Sciences · doi:10.1073/pnas.2412719121 · Cited by 37
Artificial intelligence for medicine 2025: Navigating the endless frontier
Dai, J., Xu, H., Chen, T., Huang, T., Liang, W., Zhang, R., Xu, G.-X., Zhang, Z., Xue, L., Gao, Y. Q., et al. (2025) · The Innovation Medicine · doi:10.59717/j.xinn-med.2025.100120 · Cited by 35
Elgawish, M. S., Almatary, A. M., Zaitone, S. A., & Salem, M. S. H. (2025) · RSC Medicinal Chemistry · doi:10.1039/d5md00494b · Cited by 32
Empowering AlphaFold2 for protein conformation selective drug discovery with AlphaFold2-RAVE
Gu, X., Aranganathan, A., & Tiwary, P. (2024) · eLife · doi:10.7554/elife.99702.3 · Cited by 33
Tran‐Nguyen, V., & Camproux, A. (2025) · Current Opinion in Structural Biology · doi:10.1016/j.sbi.2025.103152 · Cited by 25
Olanders, G., Testa, G., Tibo, A., Nittinger, E., & Tyrchan, C. (2024) · Journal of Chemical Information and Modeling · doi:10.1021/acs.jcim.4c01475 · Cited by 27
Fadini, A., Li, M., McCoy, A. J., Banjara, S., Okumura, H., Napier, E., Fontana, P., Khan, A. R., Jovine, L., Terwilliger, T. C., et al. (2026) · Nature Methods · doi:10.1038/s41592-026-03047-4 · Cited by 22
Mieres‐Pérez, J., Almeida‐Hernández, Y., Sander, W., & Sánchez‐García, E. (2025) · Chemical Reviews · doi:10.1021/acs.chemrev.4c00807 · Cited by 22
Raisinghani, N., Alshahrani, M., Gupta, G., Tian, H., Xiao, S., Tao, P., & Verkhivker, G. M. (2024) · Journal of Chemical Theory and Computation · doi:10.1021/acs.jctc.4c00222 · Cited by 17
Exploring the conformational landscape of protein kinases
Gough, N. R., & Kalodimos, C. G. (2024) · Current Opinion in Structural Biology · doi:10.1016/j.sbi.2024.102890 · Cited by 23
Multimeric protein interaction and complex prediction: Structure, dynamics and function
Lu, D., Yu, S., Huang, Y., & Gong, X. (2025) · Computational and Structural Biotechnology Journal · doi:10.1016/j.csbj.2025.05.009 · Cited by 23
Zhang, Y., Zhang, Z., Kagaya, Y., Terashi, G., Zhao, B., Xiong, Y., & Kihara, D. (2025) · Communications Biology · doi:10.1038/s42003-025-08783-5 · Cited by 19
“Approaches include manipulation on multiple sequence alignments (MSAs) via subsampling 27 – 29 , clustering 30 , or amino acid replacements 31 , and deep generative models 32 – 34 .”
NMR-driven structure-based drug discovery by unveiling molecular interactions
Platzer, G., Mayer, M., McConnell, D. B., & Konrat, R. (2025) · Communications Chemistry · doi:10.1038/s42004-025-01542-x · Cited by 20
Soft Modes as a Predictive Framework for Low-Dimensional Biological Systems Across Scales
Russo, C. J., Husain, K. B., & Murugan, A. (2025) · Annual Review of Biophysics · doi:10.1146/annurev-biophys-081624-030543 · Cited by 25
Generation of protein dynamics by machine learning
Janson, G., & Feig, M. (2025) · Current Opinion in Structural Biology · doi:10.1016/j.sbi.2025.103115 · Cited by 21
Improving AlphaFold 3 structural modeling by incorporating explicit crosslinksPreprint
Gilep, K., Obarska-Kosińska, A., & Kosiński, J. (2024) · bioRxiv (Cold Spring Harbor Laboratory) · doi:10.1101/2024.12.03.626671 · Cited by 19
AlphaPulldown2—a general pipeline for high-throughput structural modeling
Molodenskiy, D., Maurer, V. J., Yu, D., Chojnowski, G., Bienert, S., Tauriello, G., Gilep, K., Schwede, T., & Kosinski, J. (2025) · Bioinformatics · doi:10.1093/bioinformatics/btaf115 · Cited by 15
Mahdi, M., Kiarie, I. W., Mótyán, J. A., Hoffka, G., Al-Muffti, A. S., Tóth, A., & Tőzsér, J. (2025) · Viruses · doi:10.3390/v17050691 · Cited by 16
Garcia, M., Dixit, S. M., & Rocklin, G. J. (2026) · Protein Science · doi:10.1002/pro.70453 · Cited by 26
Scaling down protein language modeling with MSA PairformerPreprint
Akiyama, Y., Zhang, Z., Mirdita, M., Steinegger, M., & Ovchinnikov, S. (2025) · bioRxiv (Cold Spring Harbor Laboratory) · doi:10.1101/2025.08.02.668173 · Cited by 18
Challenging AlphaFold in predicting proteins with large-scale allosteric transitions
Perkins-Jechow, B. H., Ahualli, J. P. I., Nhu, H. T., Omidi, A., Li, C., Holguin-Cruz, J. A., Cho, D., Na, D., Malhis, N., Bui, J. M., et al. (2025) · Communications Chemistry · doi:10.1038/s42004-025-01763-0 · Cited by 14
AlphaFold2's training set powers its predictions of some fold‐switched conformations
Schafer, J. W., & Porter, L. L. (2025) · Protein Science · doi:10.1002/pro.70105 · Cited by 12
Can Deep Learning Blind Docking Methods be Used to Predict Allosteric Compounds?
Chen, E. A., & Zhang, Y. (2025) · Journal of Chemical Information and Modeling · doi:10.1021/acs.jcim.5c00331 · Cited by 14
Unfreezing structural biology for drug discovery
Stachowski, T. R., & Fischer, M. M. (2025) · Nature Chemical Biology · doi:10.1038/s41589-025-02047-3 · Cited by 14
The physics-AI dialogue in drug design
Vargas-Rosales, P. A., & Caflisch, A. (2025) · RSC Medicinal Chemistry · doi:10.1039/d4md00869c · Cited by 15
Jiang, T., Thielges, M. C., & Feng, C. (2025) · Journal of Biological Chemistry · doi:10.1016/j.jbc.2025.108282 · Cited by 11
The Ensemble Basis of Allostery and Function: Insights from Models of Local Unfolding
Millard, C. E., Wrabl, J. O., Brantley, S. J., Grasso, E. M., Schmitz, A., White, J. T., & Hilser, V. J. (2025) · Journal of Molecular Biology · doi:10.1016/j.jmb.2025.169287 · Cited by 11
Non-standard proteins in the lens of AlphaFold 3: a case study of amyloids
Wojciechowska, A. W., Wojciechowski, J. W., Vriend, G., & Kotulska, M. (2026) · Scientific Reports · doi:10.1038/s41598-026-68041-4 · Cited by 11
Raisinghani, N., Parikh, V., Foley, B., & Verkhivker, G. M. (2024) · International Journal of Molecular Sciences · doi:10.3390/ijms252312968 · Cited by 10
af2rave: protein ensemble generation with physics-based sampling
Teng, D., Meraz, V. J., Aranganathan, A., Gu, X., & Tiwary, P. (2025) · Digital Discovery · doi:10.1039/d5dd00201j · Cited by 10
Hidden Structural States of Proteins Revealed by Conformer Selection with AlphaFold-NMRPreprint
Huang, Y. J., Ramelot, T. A., Spaman, L. E., Kobayashi, N., & Montelione, G. T. (2024) · bioRxiv (Cold Spring Harbor Laboratory) · doi:10.1101/2024.06.26.600902 · Cited by 9
Lidbrink, S. E., Howard, R. J., Haloi, N., & Lindahl, E. (2025) · PLOS Computational Biology · doi:10.1371/journal.pcbi.1013187 · Cited by 9
Generating Multistate Conformations of P-type ATPases with a Conditional Diffusion Model
Xu, J., & Wang, Y. (2024) · Journal of Chemical Information and Modeling · doi:10.1021/acs.jcim.4c01519 · Cited by 9
Rustamov, K., & Baev, A. (2024) · Bioinformatics Advances · doi:10.1093/bioadv/vbae197 · Cited by 13
Haloi, N., Lidbrink, S. E., Howard, R. J., & Lindahl, E. R. (2025) · Science Advances · doi:10.1126/sciadv.adq3788 · Cited by 9
Statistical Thermodynamics of the Protein Ensemble: Mediating Function and Evolution
Hilser, V. J., Wrabl, J. O., Millard, C. E., Schmitz, A., Brantley, S. J., Pearce, M., Rehfus, J., Russo, M. M., & Voortman‐Sheetz, K. (2025) · Annual Review of Biophysics · doi:10.1146/annurev-biophys-061824-104900 · Cited by 9
Li, H., Nithin, C., Kmiecik, S., & Huang, S. (2025) · Drug Discovery Today · doi:10.1016/j.drudis.2025.104382 · Cited by 9
Vost, L., Ziv, Y., & Deane, C. M. (2025) · Chemical Science · doi:10.1039/d5sc05748e · Cited by 11
AI-based methods for simulating, sampling, and predicting protein ensembles
Jing, B., Berger, B., & Jaakkola, T. (2026) · Current Opinion in Structural Biology · doi:10.1016/j.sbi.2026.103251 · Cited by 9
Empowering AlphaFold2 for protein conformation selective drug discovery with AlphaFold2-RAVEPreprint
Gu, X., Aranganathan, A., & Tiwary, P. (2024) · eLife · doi:10.7554/elife.99702.2 · Cited by 10
Physics-Grounded Evaluation to Guide Accurate Biomolecular PredictionPreprint
Lyu, N., Du, S., Shao, Q., Yang, Z. J., Ma, J., & Herschlag, D. (2025) · bioRxiv (Cold Spring Harbor Laboratory) · doi:10.1101/2025.06.30.662466 · Cited by 9
Does Sequence Clustering Confound AlphaFold2?
(2025) · doi:10.1016/j.jmb.2025.169376 · Cited by 8
AlphaFold modeling uncovers global structural features of class I and class II fungal hydrophobins
Yang, L., Hicks, D. J., Russo, P. S., & McShan, A. C. (2025) · Protein Science · doi:10.1002/pro.70279 · Cited by 8
Harnessing Deep Learning Methods for Voltage-Gated Ion Channel Drug Discovery
Mateos, D. L., Harris, B. J., González, A. H., Narang, K., & Yarov-Yarovoy, V. M. (2024) · Physiology · doi:10.1152/physiol.00029.2024 · Cited by 9
Raisinghani, N., Alshahrani, M., Gupta, G., & Verkhivker, G. M. (2024) · International Journal of Molecular Sciences · doi:10.3390/ijms251810082 · Cited by 7
Huang, Y., Zhang, Z., & Hattori, M. (2024) · Journal of Molecular Biology · doi:10.1016/j.jmb.2024.168809 · Cited by 7
Predicting Resistance to Small Molecule Kinase Inhibitors
Nagarajan, A., Amberg-Johnson, K., Paull, E., Huang, K., Ghanakota, P., Chandrasinghe, A., Elk, J. C., Sampson, J. M., Wang, L., Abel, R., et al. (2025) · Journal of Chemical Information and Modeling · doi:10.1021/acs.jcim.4c02313 · Cited by 8
Evaluating zero-shot prediction of protein design success by AlphaFold, ESMFold, and ProteinMPNNPreprint
Garcia, M., Dixit, S. M., & Rocklin, G. J. (2025) · bioRxiv (Cold Spring Harbor Laboratory) · doi:10.1101/2025.07.29.667290 · Cited by 8
A Deep Learning Approach to Uncover Voltage-Gated Ion Channels’ Intermediate States
Kacher, J., Sokolova, O. S., & Tarek, M. (2024) · The Journal of Physical Chemistry B · doi:10.1021/acs.jpcb.4c03182 · Cited by 7
Ille, A. M., Anas, E., Mathews, M. B., & Burley, S. K. (2025) · Structural Dynamics · doi:10.1063/4.0000765 · Cited by 8
Structure Prediction of Alternate Frame Folding Systems with AlphaFold3
Jiménez‐Osés, G., & Peccati, F. (2025) · Journal of Chemical Information and Modeling · doi:10.1021/acs.jcim.5c00906 · Cited by 7
ESMDynamic: Fast and accurate prediction of protein dynamic contact maps from single sequences
Kleiman, D. E., Feng, J., Xue, Z., & Shukla, D. (2026) · Nature Communications · doi:10.1038/s41467-026-76361-2 · Cited by 7
Piomponi, V., Cazzaniga, A., & Cuturello, F. (2025) · Journal of Chemical Information and Modeling · doi:10.1021/acs.jcim.5c01090 · Cited by 7
Lin, Y., Zhou, Z., Han, Y., Cheng, D., Wang, H. J., Ju, L. A., Zhang, Y., Cox, C. D., & Corry, B. (2026) · Nature Communications · doi:10.1038/s41467-026-68919-x · Cited by 7
Structures, dynamics, complexes, and functions: From classic computation to artificial intelligence
Frasnetti, E., Magni, A., Castelli, M., Serapian, S. A., Moroni, E., & Colombo, G. (2024) · Current Opinion in Structural Biology · doi:10.1016/j.sbi.2024.102835 · Cited by 7
Rahimzadeh, F., Khanli, L. M., Salehpoor, P., Golabi, F., & Pourbahrami, S. (2024) · Computers in Biology and Medicine · doi:10.1016/j.compbiomed.2024.108815 · Cited by 7
AF2χ: Predicting protein side-chain rotamer distributions with AlphaFold2Preprint
Cagiada, M., Thomasen, F. E., Ovchinnikov, S., Deane, C. M., & Lindorff‐Larsen, K. (2025) · bioRxiv (Cold Spring Harbor Laboratory) · doi:10.1101/2025.04.16.649219 · Cited by 7
Stratiichuk, R., Kyrylenko, R., Koleiev, I., Savchenko, I., Voitsitskyi, T., Husak, V., Yesylevskyy, S., Starosyla, S., & Nafiiev, A. (2025) · Journal of Chemical Information and Modeling · doi:10.1021/acs.jcim.5c01765 · Cited by 6
Beyond evolution: De novo designed protein toolkit rewriting the rules of synthetic biology
Zhang, G., Liu, C., Li, W., Lu, J., Li, A., & Zhu, L. (2025) · Biosafety and Health · doi:10.1016/j.bsheal.2025.09.004 · Cited by 6
Yang, D. T., Chong, L. T., & Gronenborn, A. M. (2025) · Proceedings of the National Academy of Sciences · doi:10.1073/pnas.2420371122 · Cited by 8
Wang, B., Wang, C., Chen, J., Liu, D., Sun, C., Zhang, J., Zhang, K., & Li, H. (2026) · Nature Machine Intelligence · doi:10.1038/s42256-026-01198-9 · Cited by 5
Lopez-Mateos, D., Narang, K., & Yarov-Yarovoy, V. (2024) · doi:10.1101/2024.10.15.618559 · Cited by 5
Aromatic–aromatic interactions drive fold switch of GA95 and GB95 with three residue difference
Chen, C., Zhang, Z., Duan, M., Wu, Q., Yang, M., Jiang, L., Liu, M., & Li, C. (2024) · Chemical Science · doi:10.1039/d4sc04951a · Cited by 5
The m⁶A epitranscriptome: A regulatory nexus linking cellular senescence and oncogenesis
Xu, Y., Zhou, X., Su, X., Xie, W., Huang, Z., Yu, S., Tan, J., He, J., & Zhang, J. (2026) · Ageing Research Reviews · doi:10.1016/j.arr.2026.103032 · Cited by 5
Protein dynamics prediction by integrating biophysics and artificial intelligence
Huang, H., Guan, X., Li, W., Zhang, J., & Wang, W. (2026) · Current Opinion in Structural Biology · doi:10.1016/j.sbi.2026.103223 · Cited by 6
Dissecting AlphaFold2’s capabilities with limited sequence information
Gut, J. A., & Lemmin, T. (2024) · Bioinformatics Advances · doi:10.1093/bioadv/vbae187 · Cited by 7
Yang, Q., Shi, Q., Dong, X., Yu, L., & Sun, Y. P. (2024) · International Journal of Biological Macromolecules · doi:10.1016/j.ijbiomac.2024.138636 · Cited by 5
Lopez-Mateos, D., Narang, K., & Yarov-Yarovoy, V. (2026) · Journal of General Physiology · doi:10.1085/jgp.202413705 · Cited by 5
Pinto-Anwandter, B. I. (2025) · Biophysical Journal · doi:10.1016/j.bpj.2025.06.029 · Cited by 5
Raisinghani, N., Alshahrani, M., Gupta, G., Tian, H., Xiao, S., Tao, P., & Verkhivker, G. M. (2024) · The Journal of Physical Chemistry B · doi:10.1021/acs.jpcb.4c04985 · Cited by 4
Li, J., Zhu, Z., & Song, C. (2026) · Quantitative Biology · doi:10.1101/2024.06.09.598121 · Cited by 6
Tang, Y., Yu, M., Bai, G., Li, X., Xu, Y., & Ma, B. (2024) · bioRxiv (Cold Spring Harbor Laboratory) · doi:10.1101/2024.06.27.600251 · Cited by 5
AlphaFold2’s training set powers its predictions of fold-switched conformationsPreprint
Schafer, J. W., & Porter, L. L. (2024) · bioRxiv (Cold Spring Harbor Laboratory) · doi:10.1101/2024.10.11.617857 · Cited by 5
Raju, A., Sharma, S., Riley, B. T., Djuraev, S., Tan, Y. L. K., Kim, M., Mahmud, T., & Keedy, D. A. (2025) · bioRxiv (Cold Spring Harbor Laboratory) · doi:10.1101/2025.05.23.655529 · Cited by 5
eRMSF: A Python Package for Ensemble-Based RMSF Analysis of Biomolecular Systems
Arantes, P. R., Ligabue-Braun, R., & Pedebos, C. (2025) · Journal of Chemical Information and Modeling · doi:10.1021/acs.jcim.5c02413 · Cited by 5
Mobility of four structural regions drives isoform-specific properties of photoenzyme LPOR in plants
Gabruk, M., Łuszczyński, M., Szafran, K., Ogrodzińska, W., Rubenstein, B. M., & da Silva, G. M. (2025) · Journal of Biological Chemistry · doi:10.1016/j.jbc.2025.108261 · Cited by 4
Self-citationCombining simulations and experiments – a perspective on maximum entropy methods
Stöckelmaier, J., & Oostenbrink, C. (2025) · Physical Chemistry Chemical Physics · doi:10.1039/d5cp01263e · Cited by 4
Jiang, T., Zhang, H., da Silva, G. M., Gyawali, Y. P., & Feng, C. (2025) · Journal of Biological Chemistry · doi:10.1016/j.jbc.2025.110673 · Cited by 4
Structural insights into cationic amino acid transport and viral receptor engagement by CAT1
Xia, L., Lin, B., Zou, R., Wu, Y., Xu, J., Pan, Y., Yuan, Y., Li, S., Yang, Y., & Chen, X. (2025) · Nature Communications · doi:10.1038/s41467-025-67704-6 · Cited by 4
Fine-Tuning DiffDock-L for Allosteric Kinase Docking
Chen, E., Green, J., & Zhang, Y. (2026) · Journal of Chemical Information and Modeling · doi:10.1021/acs.jcim.5c02846 · Cited by 6
AlphaFlex: Accuracy modeling of protein multiple conformations via predicted flexible residuesPreprint
Ge, L., Cui, X., Zhao, K., Zhou, X., Zhang, Y., & Zhang, G. (2025) · bioRxiv (Cold Spring Harbor Laboratory) · doi:10.1101/2025.07.11.664327 · Cited by 4
ConfRank+: Extending Conformer Ranking to Charged Molecules
Oerder, R., Hölzer, C., & Hamaekers, J. (2025) · Journal of Chemical Information and Modeling · doi:10.1021/acs.jcim.5c01259 · Cited by 3
ChronoSort: Revealing Hidden Dynamics in AlphaFold3 Structure Predictions
Argyle, M. E., Heaps, W. P., Kubalek, C., Gardiner, S., Bundy, B. C., & Corte, D. D. (2025) · SynBio · doi:10.3390/synbio3040018 · Cited by 3
Li, W., & Wang, W. (2025) · Quantitative Biology · doi:10.1002/qub2.70024 · Cited by 3
Budhathoki, A., Kinshuk, S., Nguyen, N. T., & Chan, C. T. Y. (2025) · Nucleic Acids Research · doi:10.1093/nar/gkaf1336 · Cited by 2
Gizzio, J., Faezov, B., Xu, Q., & Dunbrack, R. L. (2026) · Biochemical Journal · doi:10.1042/bcj20260137 · Cited by 3
Hierarchical AF2RAVE for Multiconformation Virtual Screening Targeting S100 Ca2+-Binding Proteins
Gu, X., Adury, V. S. S., Aranganathan, A., Zhuang, X., Varney, K. M., Weber, D. J., & Tiwary, P. (2025) · Journal of Chemical Theory and Computation · doi:10.1021/acs.jctc.5c01093 · Cited by 3
AI-driven mechanistic analysis of conformational dynamics in CNNM/CorC Mg2+ transporters
Ma, J., Song, X., Funato, Y., Teng, X., Huang, Y., Miki, H., Wang, W., & Hattori, M. (2024) · Structure · doi:10.1016/j.str.2024.10.021 · Cited by 3
van Aalst, E. J., & Wylie, B. J. (2024) · Protein Science · doi:10.1002/pro.70013 · Cited by 4
Benavides, T. L., & Montelione, G. T. (2024) · bioRxiv (Cold Spring Harbor Laboratory) · doi:10.1101/2024.09.19.613999 · Cited by 2
Conformational ensemble-based framework enables rapid development of Lassa virus vaccine candidatesPreprint
Mishra, N., Avillion, G., Callaghan, S., DiBiase, C. N., Hurtado, J., Liendo, N. S., Burbach, S. M., Messmer, T., & Briney, B. S. (2024) · bioRxiv (Cold Spring Harbor Laboratory) · doi:10.1101/2024.11.21.624760 · Cited by 3
Metadata
- Authors
- Monteiro da Silva, G., Cui, J. Y., Dalgarno, D. C., Lisi, G. P., & Rubenstein, B. M.
- Affiliations
- Brown University (US)
- Brooke (GB)
- Corresponding author
- Rubenstein, Brenda M.
- ORCID
- Venue
- Nature Communications
- Published
- 2024-03-27
- Volume
- 15
- Issue
- 1
- Pages
- 2464-2464
- ISSN
- 2041-1723 (ISSN-L)
- PMC
- PMC10973385
- OpenAlex
- W4393233076
- Cited by
- 196
- References
- 52
- Citations by year
- 2026: 60 · 2025: 85 · 2024: 51
- FWCI
- 26.40
- Type
- journal article
- Language
- en
- Update notices
- correction (2024-04-10)
- Open access
- gold
- doi.org
- Locations
- Nature Communications (publishedVersion, cc-by)
- PubMed Central (publishedVersion, cc-by)
- PubMed (publishedVersion)
- RePEc: Research Papers in Economics (submittedVersion)
- DOAJ (DOAJ: Directory of Open Access Journals) (submittedVersion)
- Funders
- National Science Foundation (2027108)
- U.S. Department of Health & Human Services | NIH | National Cancer Institute (R01GM144451)
- Blavatnik Family Foundation
- Topics
- Life Sciences › Biochemistry, Genetics and Molecular Biology › Molecular Biology › Protein Structure and Dynamics
- Life Sciences › Biochemistry, Genetics and Molecular Biology › Molecular Biology › Receptor Mechanisms and Signaling
- Life Sciences › Biochemistry, Genetics and Molecular Biology › Molecular Biology › Machine Learning in Bioinformatics
- Keywords
- protein conformational landscape, AlphaFold2, protein structure prediction, ABL1 kinase, GM-CSF, point mutations, protein evolution
- MeSH terms
- Mutation, Protein Conformation, Sequence Alignment, Point Mutation
About these checks
Registry, retraction, Cites and statistics results are computed, not judged, with one exception: a printed reference that no index lists is read once by a model before it counts as a citation error. Claims are extracted by a model and kept only when their quote appears verbatim in the text; each cited source is then checked, with a model’s help, for whether it says what the claim relies on. Those verdicts can be wrong — read the claim’s quote and the cited source before relying on one.
Statistics and arithmetic are recomputed, not judged.
Confidence bands are shown only for fields calibrated on our annotated test set. None is calibrated yet, so no band is shown.
What counts as a claim ›How we measure confidence ›How we check this ›
Are you an author, or do you see a problem with this page? Request a review
