

The DOI matches its Crossref record; 47 of the 47 references it cites were found in a registry or an index; none of the 40 sources its claims cite is checked for support yet.
Gadd45g insufficiency drives the pathogenesis of myeloproliferative neoplasms
Open accessAbstract
Despite the identification of driver mutations leading to the initiation of myeloproliferative neoplasms (MPNs), the molecular pathogenesis of MPNs remains incompletely understood. Here, we demonstrate that growth arrest and DNA damage inducible gamma (GADD45g) is expressed at significantly lower levels in patients with MPNs, and JAK2V617F mutation and histone deacetylation contribute to its reduced expression. Downregulation of GADD45g plays a tumor-promoting role in human MPN cells. Gadd45g insufficiency in the murine hematopoietic system alone leads to significantly enhanced growth and self-renewal capacity of myeloid-biased hematopoietic stem cells, and the development of phenotypes resembling MPNs. Mechanistically, the pathogenic role of GADD45g insufficiency is mediated through a cascade of activations of RAC2, PAK1 and PI3K-AKT signaling pathways. These data characterize GADD45g deficiency as a novel pathogenic factor in MPNs.
Overview
CoChat Summary
Written by AI from the paper’s full text.
TL;DR
GADD45g is downregulated in myeloproliferative neoplasms (MPNs), and its insufficiency alone is sufficient to drive MPN-like disease in mice through RAC2–PAK1–PI3K-AKT signaling. JAK2V617F and histone deacetylation contribute to GADD45g silencing, identifying GADD45g deficiency as a pathogenic factor in MPNs.
Key findings
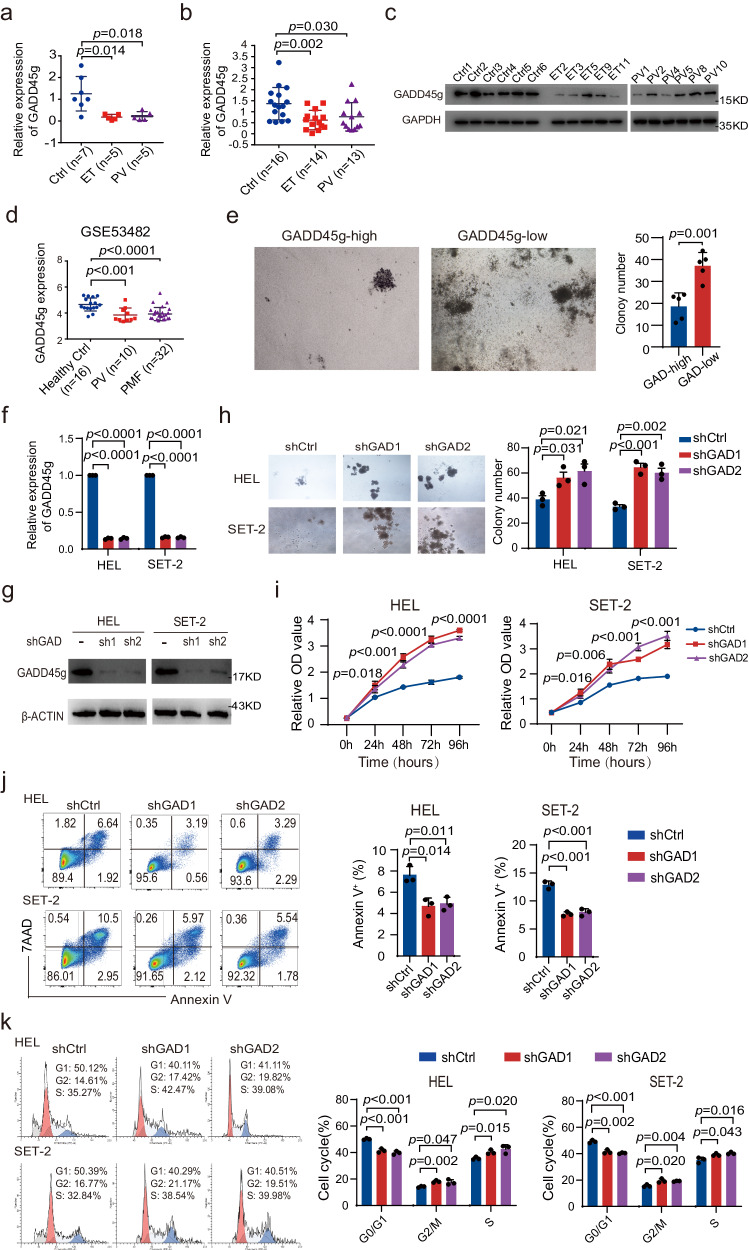
- GADD45g expression was significantly lower in primary CD34+ and BMMNCs from patients with ET and PV than in healthy controls; in GSE53482, GADD45g was downregulated in CD34+ cells from PV (n = 10) and PMF (n = 32) versus healthy volunteers (n = 16).
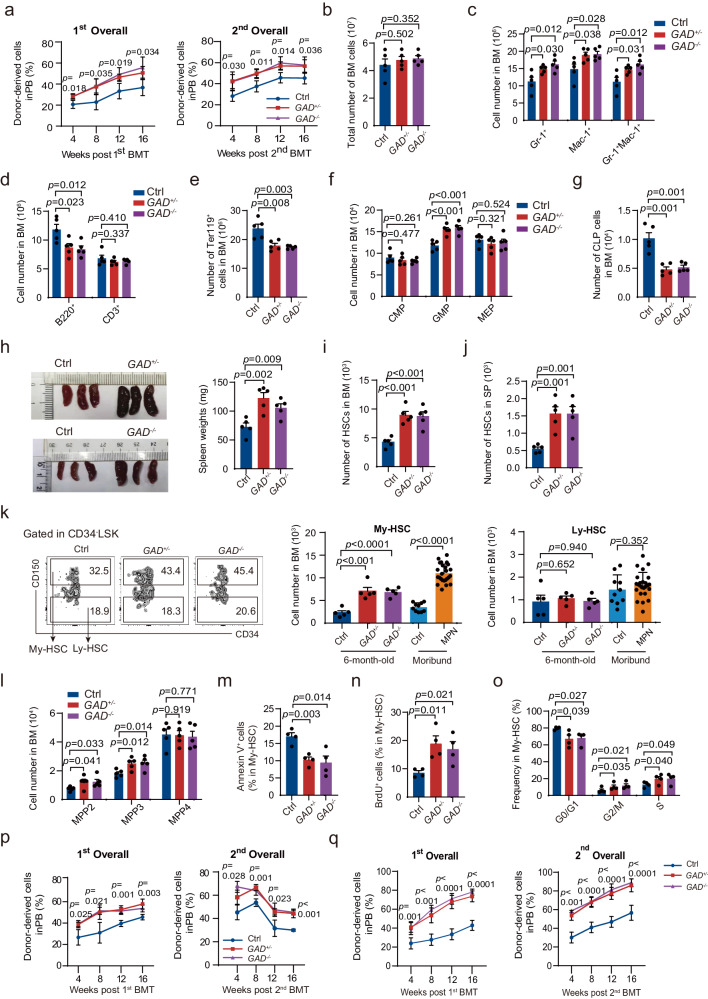
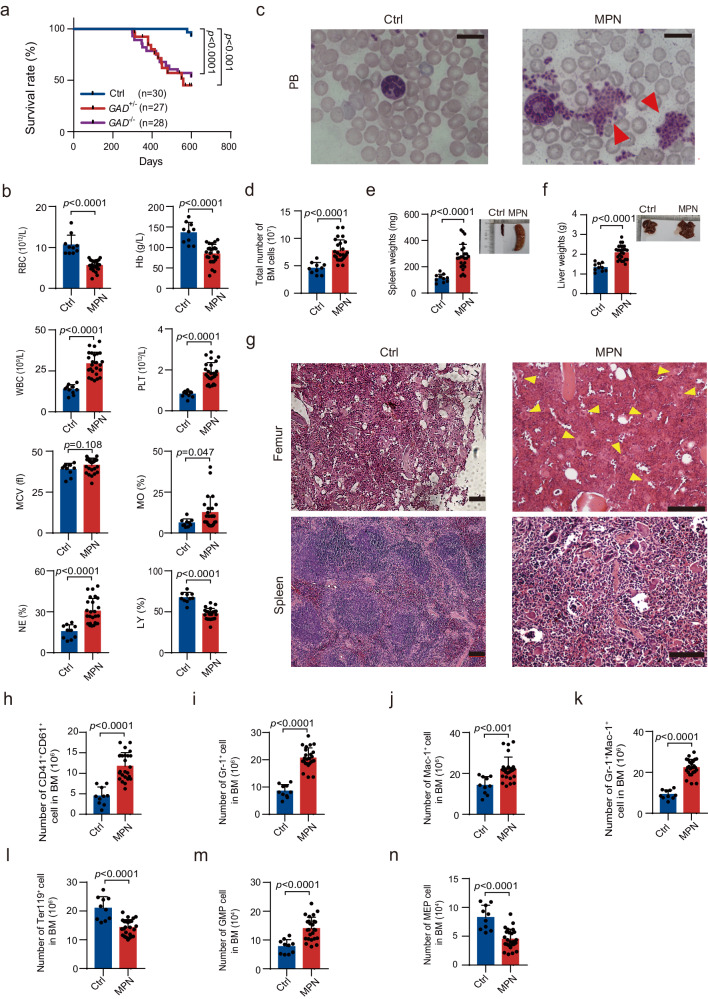
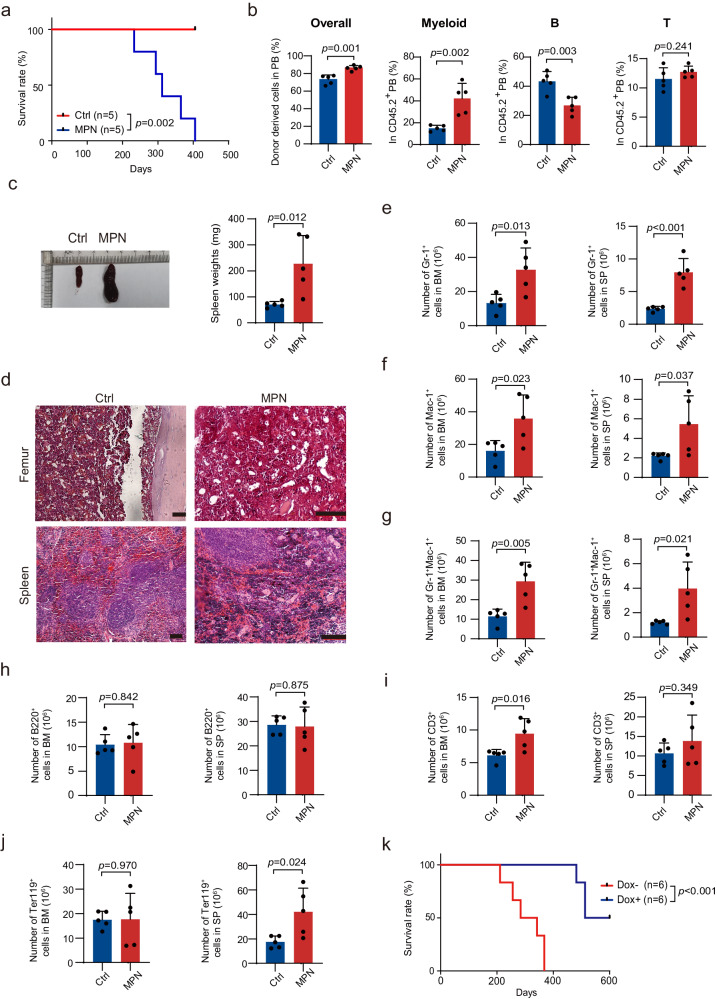
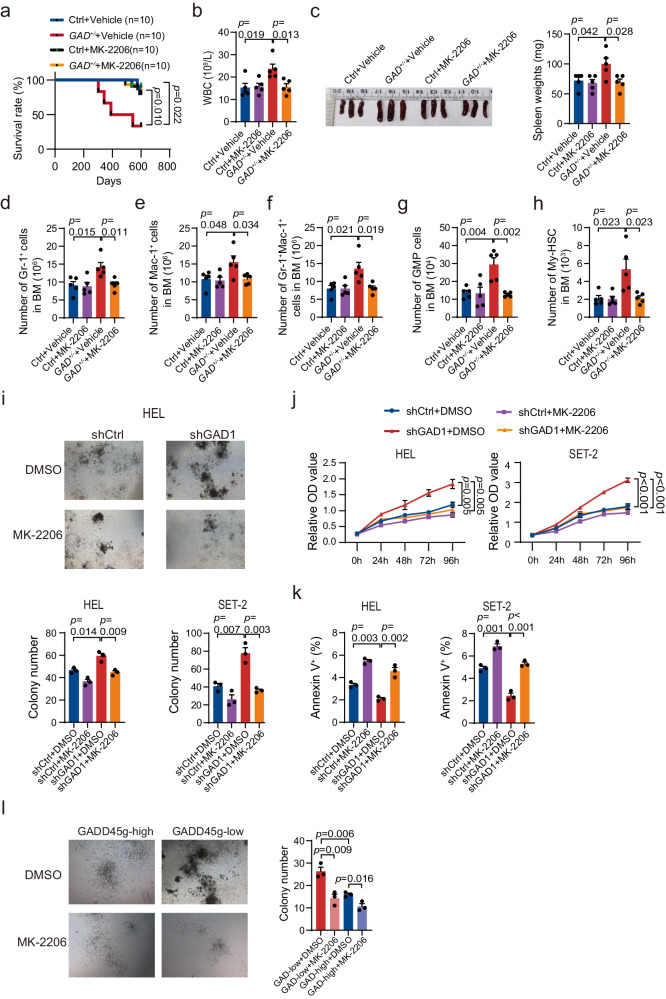
- Gadd45g insufficiency in mice enhanced myeloid-biased HSC self-renewal and caused MPN: 25 of 55 Gadd45g+/− and Gadd45g−/− mice developed MPN after 10 months of age, while no control mice did; the disease was transplantable with latency of 233–405 days, and reintroduction of Gadd45g prolonged survival.
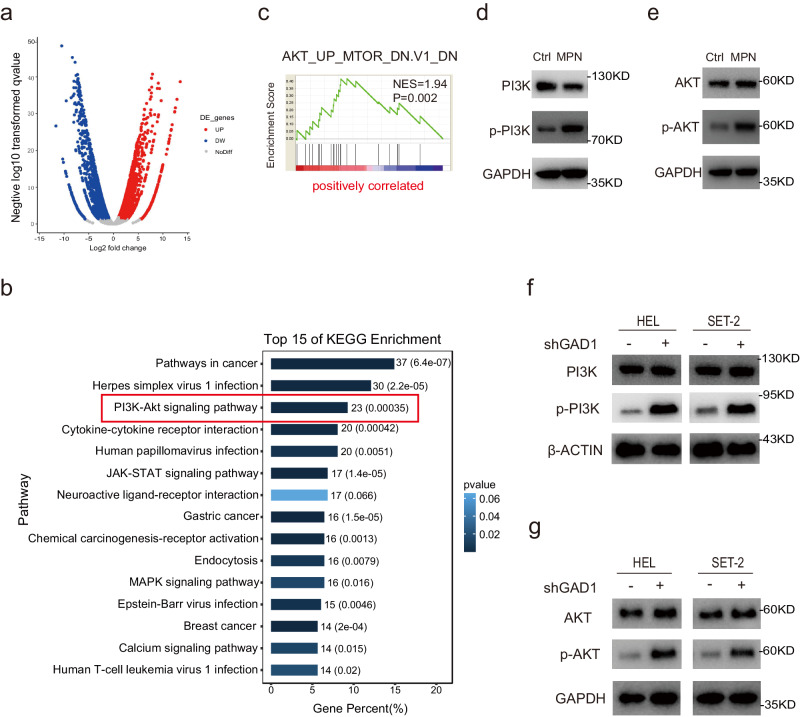
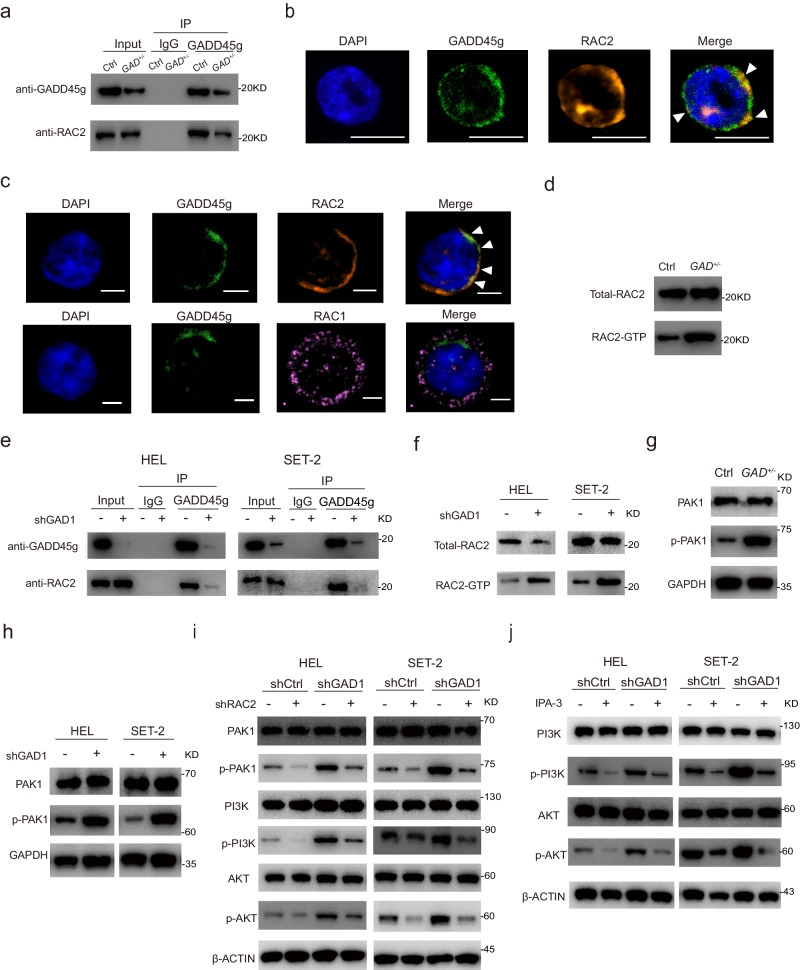
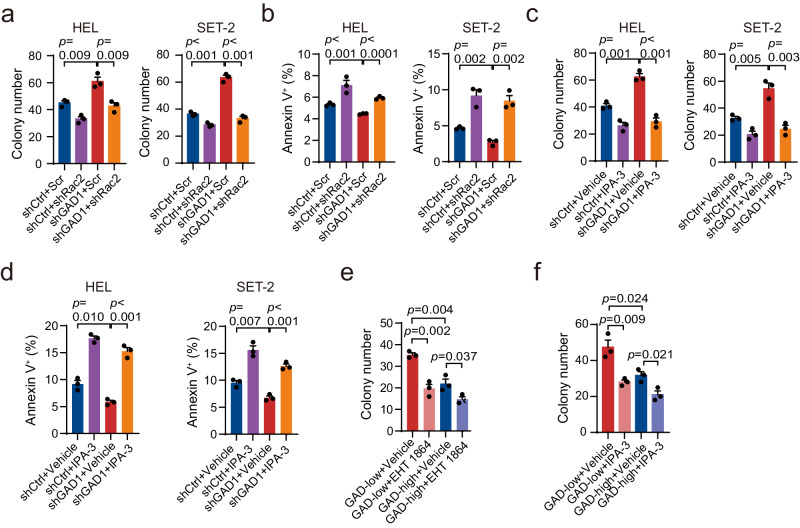
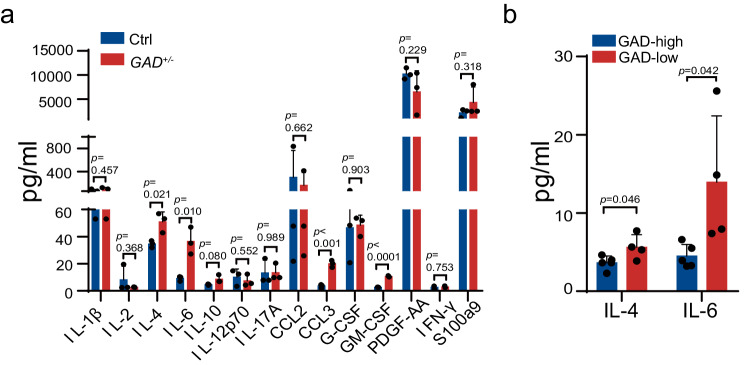
- Mechanistically, GADD45g deficiency activated RAC2, PAK1, and PI3K-AKT; RNA-seq of c-kit+ BM cells from Gadd45g+/− MPN mice showed 7,098 differentially expressed genes (3,665 upregulated, 3,433 downregulated), with PI3K-AKT signaling ranked top by KEGG enrichment.
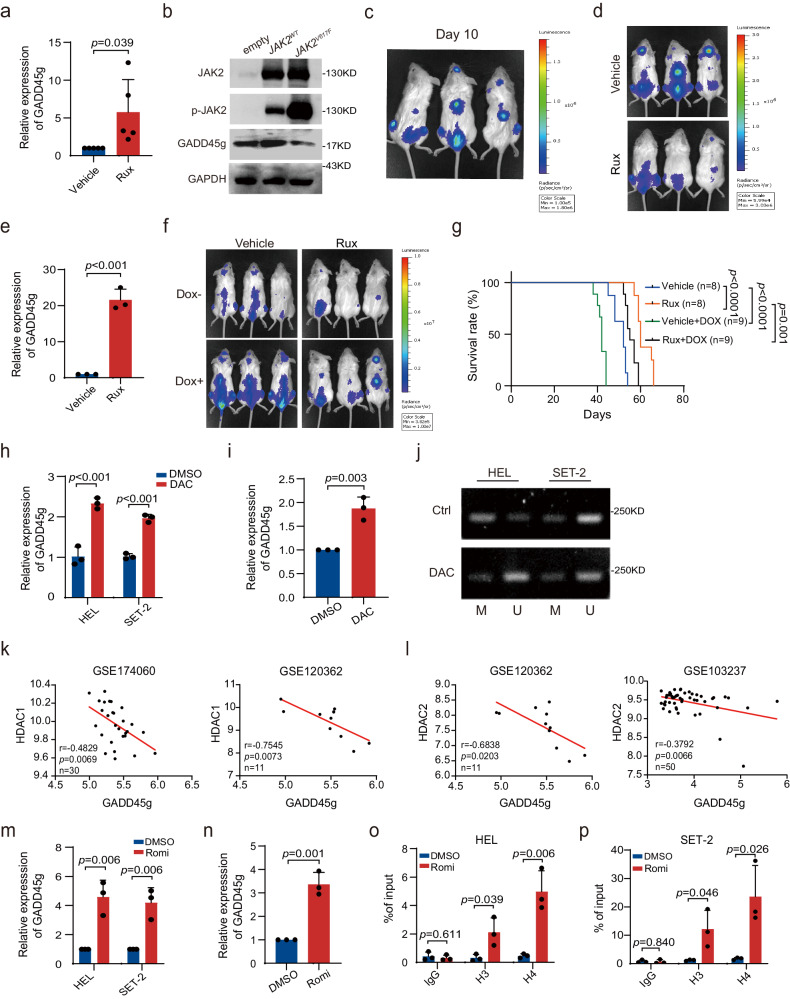
- JAK2V617F and histone deacetylation contributed to GADD45g repression: ruxolitinib increased GADD45g in PV BMMNCs; Romidepsin upregulated GADD45g more than 4-fold in MPN cell lines and approximately 3- to 4-fold in primary BMMNCs; Decitabine upregulated GADD45g about twofold, with DNA methylation playing a marginal role.
Methods
- Human bone marrow specimens were collected from healthy donors and patients with newly diagnosed MPNs (21 males, 14 females; median age 53 years, range 14–72; 16 ET, 19 PV), plus human cord blood; MPN cell lines HEL and SET-2, 293T cells, and HEL92.1.7-Luc cells were used.
- Mouse models included hematopoietic-specific Gadd45g+/− and Gadd45g−/− mice generated by crossing Gadd45gflox/flox with Vav-Cre, competitive transplantation, secondary transplantation, noncompetitive transplantation, and an NSG xenograft model with Dox-inducible GADD45g knockdown.
- Main analyses included qRT-PCR, Western blot, flow cytometry/cell sorting, colony formation, proliferation/apoptosis/cell-cycle assays, RNA-seq, whole-exome sequencing, immunoprecipitation/mass spectrometry, co-IP, ChIP-qPCR, MS-PCR, Luminex cytokine quantification, and drug treatments (MK-2206, IPA-3, EHT 1864, ruxolitinib, Romidepsin, Decitabine); statistics used GraphPad Prism v8, mean ± SD, Student’s t test, one-way ANOVA, and Kaplan-Meier log-rank tests.
Limitations
- The paper states that no appropriate MPN datasets were available for prognostic analysis, and that establishing the relevance of GADD45g levels to RAC2-PAK1-PI3K-AKT activation in patients was impeded by a lack of adequate primary cells.
- The paper states that whether My-biased HSCs are also augmented in human patients requires further investigation, and that whether GADD45g inactivation is an additional mechanism or mediates cytokine increases induced by somatic mutations needs further studies and large cohort analysis.
- The paper notes that JAK2V617F is not the only regulatory mechanism for low GADD45g in MPNs and that GADD45g reduction only partially mediates JAK2V617F activity in a xenograft model; evident limitations include reliance on mouse models and cell lines, and the Methods state that some experiments, such as Western blots, were not blinded.
Model-written summary. Check it against the paper before relying on it.
Integrity signals
Registry
Cites
Statistics
Figures
Verification
Claims the paper makes
98 Own result · 33 Own interpretation · 21 Check pending · 13 Own method · 5 No full text of the sources · 1 Not checked yet · 1 No basis given
A result the paper reports from its own data — it cites no other source for it, so there is none to check. The quote shows it is in the paper.
In the paper
“Analysis of hematopoietic stem and progenitor cells (HSPCs) revealed that, in the BM of all the moribund Gadd45g-insufficient mice, the number of My-biased HSCs was dramatically augmented, while the Ly-biased HSCs remained unchanged (Fig. 2k).”
§ Gadd45g insufficiency drives the pathogenesis of myeloproliferative neoplasms > Results > Gadd45g deficiency leads to the development of myeloproliferative neoplasm in mice after 10 months of age
plain- Asserted: passes — The authors put it forward as true.
- Checkable: passes — It can be checked against evidence.
- Load-bearing: unclear — It is unclear whether the paper’s conclusions depend on it.
- Based: passes — The paper gives a reason why it holds.
A result the paper reports from its own data — it cites no other source for it, so there is none to check. The quote shows it is in the paper.
In the paper
“The GMP population was markedly increased (Fig. 3m), whereas the number of MEPs was significantly decreased (Fig. 3n).”
§ Gadd45g insufficiency drives the pathogenesis of myeloproliferative neoplasms > Results > Gadd45g deficiency leads to the development of myeloproliferative neoplasm in mice after 10 months of age
plainstates an association- Asserted: passes — The authors put it forward as true.
- Checkable: passes — It can be checked against evidence.
- Load-bearing: passes — The paper’s conclusions depend on it.
- Based: passes — The paper gives a reason why it holds.
A result the paper reports from its own data — it cites no other source for it, so there is none to check. The quote shows it is in the paper.
In the paper
“Consistent with observations from mouse, knockdown of GADD45g in HEL and SET-2 cells resulted in enhanced activities of PI3K and AKT (Fig. 5f, g).”
§ Gadd45g insufficiency drives the pathogenesis of myeloproliferative neoplasms > Results > Gadd45g deficiency induces myeloproliferative neoplasms via activation of PI3K-AKT signaling pathway
plainstates a cause- Asserted: passes — The authors put it forward as true.
- Checkable: passes — It can be checked against evidence.
- Load-bearing: passes — The paper’s conclusions depend on it.
- Based: passes — The paper gives a reason why it holds.
A result the paper reports from its own data — it cites no other source for it, so there is none to check. The quote shows it is in the paper.
In the paper
“Continuous follow-up showed that Gadd45g+/− and Gadd45g−/− mice had a significantly shorter mean survival than Ctrl mice (Fig. 3a).”
§ Gadd45g insufficiency drives the pathogenesis of myeloproliferative neoplasms > Results > Gadd45g deficiency leads to the development of myeloproliferative neoplasm in mice after 10 months of age
plainstates an association- Asserted: passes — The authors put it forward as true.
- Checkable: passes — It can be checked against evidence.
- Load-bearing: passes — The paper’s conclusions depend on it.
- Based: passes — The paper gives a reason why it holds.
A result the paper reports from its own data — it cites no other source for it, so there is none to check. The quote shows it is in the paper.
In the paper
“cBioPortal analysis revealed that the rates of GADD45g gene mutation are extremely low in various myeloid malignancies (<0.5%), including AML, MPNs and MDSs (Supplementary Fig. 2a–c).”
§ Gadd45g insufficiency drives the pathogenesis of myeloproliferative neoplasms > Results > Gadd45g deficiency induces aberrations in hematological parameters in mice at 4–6 months of age
plain- Asserted: passes — The authors put it forward as true.
- Checkable: passes — It can be checked against evidence.
- Load-bearing: passes — The paper’s conclusions depend on it.
- Based: passes — The paper gives a reason why it holds.
- It may state two separate claims as one. 27
- The quote only partly states this claim. 1
- Probably not a substantial claim. 34
Create a free account to see these claims.
Create a free account to see these assumptions.
110 more claims
Create a free account to see all 172 claims and to verify the 32 references still open.
Self-check
Percentages, sums and reported differences re-computed from the paper’s own numbers.
Each contradiction between two passages listed here was confirmed by an independent check.
Rated minor: it would not touch a result — a value no result rests on, a p-value that stays on the same side of the significance level, or a conflict that is clerical, resolved elsewhere in the paper, or outside its own findings.
In the paper
§ Gadd45g insufficiency drives the pathogenesis of myeloproliferative neoplasms > Methods > RNA-seq and analysis
“Differentially expressed genes (DEGs) with log2 (fold change) > 1 and FDR < 0.05 were considered significant.”
§ Gadd45g insufficiency drives the pathogenesis of myeloproliferative neoplasms > Results > Gadd45g deficiency induces myeloproliferative neoplasms via activation of PI3K-AKT signaling pathway
“A total of 7098 (3665 upregulated and 3433 downregulated) were differentially expressed in Gadd45g+/− mice with MPN.”
Citations
Cites
iProX: an integrated proteome resource
Ma, J., Chen, T., Wu, S., Yang, C., Bai, M., Shu, K., Li, K., Zhang, G., Jin, Z., He, F., et al. (2018) · Nucleic Acids Research · doi:10.1093/nar/gky869 · Cited by 2,002
Tet2 loss leads to increased hematopoietic stem cell self-renewal and myeloid transformation
Moran-Crusio, K., Reavie, L., Shih, A., Abdel-Wahab, O., Ndiaye-Lobry, D., Lobry, C., Figueroa, M. E., Vasanthakumar, A., Patel, J., Zhao, X., et al. (2011) · Cancer Cell · doi:10.1016/j.ccr.2011.06.001 · Cited by 1,339
Epigenetic Determinants of Cancer
Baylin, S. B., & Jones, P. A. (2016) · Cold Spring Harbor Perspectives in Biology · doi:10.1101/cshperspect.a019505 · Cited by 1,226
iProX in 2021: connecting proteomics data sharing with big data
Chen, T., Ma, J., Liu, Y., Chen, Z., Xiao, N., Lu, Y., Fu, Y., Yang, C., Li, M., Wu, S., et al. (2021) · Nucleic Acids Research · doi:10.1093/nar/gkab1081 · Cited by 1,152
Hirai, H., Sootome, H., Nakatsuru, Y., Miyama, K., Taguchi, S., Tsujioka, K., Ueno, Y., Hatch, H., Majumder, P. K., Pan, B.-S., et al. (2010) · Molecular Cancer Therapeutics · doi:10.1158/1535-7163.mct-09-1012 · Cited by 860
Genetic basis and molecular pathophysiology of classical myeloproliferative neoplasms
Vainchenker, W., & Kralovics, R. (2017) · Blood · doi:10.1182/blood-2016-10-695940 · Cited by 616
Tefferi, A., Vaidya, R., Caramazza, D., Finke, C. M., Lasho, T. L., & Pardanani, A. D. (2011) · Journal of Clinical Oncology · doi:10.1200/jco.2010.32.9490 · Cited by 608
Heterogeneity and hierarchy within the most primitive hematopoietic stem cell compartment
Morita, Y., Ema, H., & Nakauchi, H. (2010) · The Journal of Experimental Medicine · doi:10.1084/jem.20091318 · Cited by 456
Cdc42, Rac1, and Rac2 Display Distinct Patterns of Activation during Phagocytosis
Hoppe, A. D., & Swanson, J. A. (2004) · Molecular Biology of the Cell · doi:10.1091/mbc.e03-11-0847 · Cited by 365
Shutes, A., Onesto, C., Picard, V., Leblond, B., Schweighoffer, F., & Der, C. J. (2007) · Journal of Biological Chemistry · doi:10.1074/jbc.m703571200 · Cited by 336
Gadd45 in Stress Signaling, Cell Cycle Control, and Apoptosis
Salvador, J. M., Brown-Clay, J. D., & Fornace, A. J. (2013) · Advances in Experimental Medicine and Biology · doi:10.1007/978-1-4614-8289-5_1 · Cited by 308
Hasselbalch, H. C. (2012) · Blood · doi:10.1182/blood-2011-11-394775 · Cited by 300
Deininger, M., Radich, J., Burn, T. C., Huber, R., Paranagama, D., & Verstovsek, S. (2015) · Blood · doi:10.1182/blood-2015-03-635235 · Cited by 173
Myeloproliferative neoplasm stem cells
Mead, A. J., & Mullally, A. (2017) · Blood · doi:10.1182/blood-2016-10-696005 · Cited by 169
Myeloproliferative neoplasms: from origins to outcomes
Nangalia, J., & Green, A. R. (2017) · Blood · doi:10.1182/blood-2017-06-782037 · Cited by 167
Myeloid malignancies: mutations, models and management
Murati, A., Brecqueville, M., Devillier, R., Mozziconacci, M.-J., Gelsi-Boyer, V., & Birnbaum, D. (2012) · BMC Cancer · doi:10.1186/1471-2407-12-304 · Cited by 139
Inflammation and myeloproliferative neoplasms
Lussana, F., & Rambaldi, A. (2017) · Journal of Autoimmunity · doi:10.1016/j.jaut.2017.06.010 · Cited by 136
Cytokine profiles in polycythemia vera and essential thrombocythemia patients: Clinical implications
Pourcelot, E., Trocme, C., Mondet, J., Bailly, S., Toussaint, B., & Mossuz, P. (2014) · Experimental Hematology · doi:10.1016/j.exphem.2014.01.006 · Cited by 132
Rac2 is critical for neutrophil primary granule exocytosis
Abdel-Latif, D., Steward, M., Macdonald, D. L., Francis, G. A., Dinauer, M. C., & Lacy, P. (2004) · Blood · doi:10.1182/blood-2003-07-2624 · Cited by 132
Zerbini, L. F., Wang, Y., Czibere, A., Correa, R. G., Cho, J.-Y., Ijiri, K., Wei, W., Joseph, M., Gu, X., Grall, F., et al. (2004) · Proceedings of the National Academy of Sciences · doi:10.1073/pnas.0402069101 · Cited by 129
Molecular pathogenesis of the myeloproliferative neoplasms
Greenfield, G., McMullin, M. F., & Mills, K. (2021) · Journal of Hematology & Oncology · doi:10.1186/s13045-021-01116-z · Cited by 129
Minor intron retention drives clonal hematopoietic disorders and diverse cancer predisposition
Inoue, D., Polaski, J. T., Taylor, J., Castel, P., Chen, S., Kobayashi, S., Hogg, S. J., Hayashi, Y., Pineda, J. M. B., El Marabti, E., et al. (2021) · Nature Genetics · doi:10.1038/s41588-021-00828-9 · Cited by 108
An allosteric kinase inhibitor binds the p21-activated kinase autoregulatory domain covalently
Viaud, J., & Peterson, J. R. (2009) · Molecular Cancer Therapeutics · doi:10.1158/1535-7163.mct-09-0102 · Cited by 104
Role of inflammation in the biology of myeloproliferative neoplasms
Koschmieder, S., & Chatain, N. (2020) · Blood Reviews · doi:10.1016/j.blre.2020.100711 · Cited by 94
Gene dosage imbalances: action, reaction, and models
Veitia, R. A., & Potier, M. (2015) · Trends in Biochemical Sciences · doi:10.1016/j.tibs.2015.03.011 · Cited by 76
AKT is a therapeutic target in myeloproliferative neoplasms
Khan, I., Huang, Z., Wen, Q., Stankiewicz, M. J., Gilles, L., Goldenson, B., Schultz, R., Diebold, L., Gurbuxani, S., Finke, C. M., et al. (2013) · Leukemia · doi:10.1038/leu.2013.167 · Cited by 74
Phospho‐STAT5 and phospho‐Akt expression in chronic myeloproliferative neoplasms
Grimwade, L. F., Happerfield, L., Tristram, C., McIntosh, G., Rees, M., Bench, A. J., Boyd, E. M., Hall, M., Quinn, A., Piggott, N., et al. (2009) · British Journal of Haematology · doi:10.1111/j.1365-2141.2009.07870.x · Cited by 69
Austin, R. J., Straube, J., Bruedigam, C., Pali, G., Jacquelin, S., Vu, T., Green, J., Gräsel, J., Lansink, L., Cooper, L., et al. (2020) · Leukemia · doi:10.1038/s41375-019-0638-y · Cited by 61
Kovačić, M. V., Ajtić, O. M., Beleslin‐Čokić, B. B., Djikić, D., Subotički, T., Diklić, M., Leković, D., Gotić, M., Mossuz, P., & Čokić, V. P. (2018) · Cellular Oncology · doi:10.1007/s13402-018-0392-6 · Cited by 60
Scuto, A., Kirschbaum, M., Buettner, R., Kujawski, M., Cermak, J. M., Atadja, P., & Jove, R. (2013) · Cell Death & Disease · doi:10.1038/cddis.2013.159 · Cited by 57
Autophosphorylation-dependent degradation of Pak1, triggered by the Rho-family GTPase, Chp
Weisz Hubsman, M., Volinsky, N., Manser, E., Yablonski, D., & Aronheim, A. (2007) · Biochemical Journal · doi:10.1042/bj20061696 · Cited by 56
Grabek, J., Straube, J., Bywater, M., & Lane, S. W. (2020) · Cells · doi:10.3390/cells9081901 · Cited by 53
Rationale for Targeting the PI3K/Akt/mTOR Pathway in Myeloproliferative Neoplasms
Bartalucci, N., Guglielmelli, P., & Vannucchi, A. M. (2013) · Clinical Lymphoma Myeloma and Leukemia · doi:10.1016/j.clml.2013.07.011 · Cited by 49
The Impact of Epigenetic Modifications in Myeloid Malignancies
Venney, D., Mohd-Sarip, A., & Mills, K. (2021) · International Journal of Molecular Sciences · doi:10.3390/ijms22095013 · Cited by 48
Pak and Rac GTPases promote oncogenic KIT–induced neoplasms
Martin, H., Mali, R. S., Ma, P., Chatterjee, A., Ramdas, B., Sims, E., Munugalavadla, V., Ghosh, J., Mattingly, R. R., Visconte, V., et al. (2013) · Journal of Clinical Investigation · doi:10.1172/jci67509 · Cited by 45
Zerbini, L. F., & Libermann, T. A. (2005) · Cell Cycle · doi:10.4161/cc.4.1.1363 · Cited by 44
Laubach, J. P., Fu, P., Jiang, X., Salter, K. H., Potti, A., & Arcasoy, M. O. (2009) · Experimental Hematology · doi:10.1016/j.exphem.2009.09.009 · Cited by 41
Nasillo, V., Riva, G., Paolini, A., Forghieri, F., Roncati, L., Lusenti, B., Maccaferri, M., Messerotti, A., Pioli, V., Gilioli, A., et al. (2021) · International Journal of Molecular Sciences · doi:10.3390/ijms22041906 · Cited by 39
Guo, D., Zhao, Y., Wang, N., You, N., Zhu, W., Zhang, P., Ren, Q., Yin, J., Cheng, T., & Ma, X. (2021) · Blood · doi:10.1182/blood.2020008229 · Cited by 36
Self-citationDorrance, A. M., De Vita, S., Radu, M., Reddy, P. N. G., McGuinness, M. K., Harris, C. E., Mathieu, R., Lane, S. W., Kosoff, R., Milsom, M. D., et al. (2013) · Blood · doi:10.1182/blood-2012-10-460709 · Cited by 33
Cominal, J. G., Cacemiro, M. D. C., Berzoti-Coelho, M. G., Pereira, I. E. G., Frantz, F. G., Souto, E. X., Covas, D. T., de Figueiredo‐Pontes, L. L., Oliveira, M. C., Malmegrim, K. C. R., et al. (2021) · Frontiers in Oncology · doi:10.3389/fonc.2021.665037 · Cited by 25
Rac2 Regulates the Migration of T Lymphoid Progenitors to the Thymus during Zebrafish Embryogenesis
Lu, X., Zhang, Y., Liu, F., & Wang, L. (2020) · The Journal of Immunology · doi:10.4049/jimmunol.1901494 · Cited by 21
Comparative Analysis of the Genetic Structure and Chromosomal Mapping of the Murine Gadd45g/CR6 Gene
Balliet, A. G., Hollander, M. C., Fornace, A. J., Hoffman‐Liebermann, B., & Liebermann, D. A. (2003) · DNA and Cell Biology · doi:10.1089/104454903322247334 · Cited by 19
Cell autonomous expression of CXCL-10 in JAK2V617F-mutated MPN
Schnöder, T. M., Eberhardt, J., Koehler, M., Bierhoff, H. B., Weinert, S., Pandey, A. D., Nimmagadda, S. C., Wolleschak, D., Jöhrens, K., Fischer, T., et al. (2017) · Journal of Cancer Research and Clinical Oncology · doi:10.1007/s00432-017-2354-1 · Cited by 13
Microbiota Signals Suppress B Lymphopoiesis With Aging in Mice
Krambs, J. R., Monlish, D. A., Gao, F., Schuettpelz, L. G., & Link, D. C. (2021) · Frontiers in Immunology · doi:10.3389/fimmu.2021.767267 · Cited by 11
Socoro-Yuste, N., Dagher, M.-C., Gonzalez De Peredo, A., Mondet, J., Zaccaria, A., Roux Dalvai, F., Plo, I., Cahn, J. Y., & Mossuz, P. (2016) · Biochimica et Biophysica Acta (BBA) - Molecular Cell Research · doi:10.1016/j.bbamcr.2016.08.012 · Cited by 8
Circulating CD133+/–CD34– Have Increased c-MYC Expression in Myeloproliferative Neoplasms
Uslu Bıçak, İ., Tokcan, B., Yavuz, A. S., & Tokdemir, S. S. (2023) · Turkish Journal of Hematology · doi:10.4274/tjh.galenos.2022.2022.0343 · Cited by 4
Cited by
New advances in the role of JAK2 V617F mutation in myeloproliferative neoplasms
Zhang, Y., Zhao, Y., Liu, Y., Zhang, M., & Zhang, J. (2024) · Cancer · doi:10.1002/cncr.35559 · Cited by 19
Genetic context of transgene insertion can influence neurodevelopment in zebrafish
Moyer, A. J., Chrabasz, J. A., Barcus, A. K., Cheng, J., Capps, M. E., Lalonde, R. L., Mosimann, C., & Thyme, S. B. (2025) · Genetics · doi:10.1093/genetics/iyaf195 · Cited by 8
Kuznetsov, N. V., Vlasova, D. D., Kotikova, A., Tomilovskaya, E., & Ljubisavljević, M. (2025) · International Journal of Molecular Sciences · doi:10.3390/ijms262211140 · Cited by 3
Schwartz, A. V., Chao, G., Robinson, M., Conley, B. M., Adam, M. A. A., Wells, G. A., Hoang, A. D., Albekioni, E., Gallo, C., Weeks, J. L., et al. (2025) · Journal of Biological Chemistry · doi:10.1016/j.jbc.2025.108477 · Cited by 2
Jiang, R., Huang, X., Ouyang, Y., Luo, B., Wan, H., Shou, F., Wu, X., Fan, J., Zhang, J., Sun, D., et al. (2026) · Materials Today Bio · doi:10.1016/j.mtbio.2026.102953 · Cited by 2
Metadata
- Authors
- Zhang, P., You, N., Ding, Y., Zhu, W., Wang, N., Xie, Y., Huang, W., Ren, Q., Qin, T., Fu, R., Zhang, L., Xiao, Z., Cheng, T., & Ma, X.
- Affiliations
- Chinese Academy of Medical Sciences & Peking Union Medical College (CN)
- Corresponding author
- Zhang, Lei
- Xiao, Zhijian
- Cheng, Tao
- Ma, Xiaotong
- ORCID
- Venue
- Nature Communications
- Published
- 2024-04-06
- Volume
- 15
- Issue
- 1
- Pages
- 2989-2989
- ISSN
- 2041-1723 (ISSN-L)
- PMC
- PMC10998908
- OpenAlex
- W4394014075
- Cited by
- 11
- References
- 47
- Citations by year
- 2026: 5 · 2025: 5 · 2024: 1
- FWCI
- 3.06
- Type
- journal article
- Language
- en
- Open access
- gold
- doi.org
- Locations
- Nature Communications (publishedVersion, cc-by)
- PubMed Central (publishedVersion, cc-by)
- PubMed (publishedVersion)
- RePEc: Research Papers in Economics (submittedVersion)
- DOAJ (DOAJ: Directory of Open Access Journals) (submittedVersion, cc-by-sa)
- Funders
- National Natural Science Foundation of China (82070113, 81890990, 82270122, 81730006)
- Topics
- Health Sciences › Medicine › Hematology › Myeloproliferative Neoplasms: Diagnosis and Treatment
- Health Sciences › Medicine › Hematology › Acute Myeloid Leukemia Research
- Health Sciences › Medicine › Hematology › Platelet Disorders and Treatments
- Keywords
- GADD45G, myeloproliferative neoplasms, JAK2 V617F mutation, histone deacetylation, hematopoietic stem cells, Rac2, PAK1, PI3K/Akt signaling, carcinogenesis, DNA damage response, self-renewal
- MeSH terms
- GADD45 Proteins, Animals, Humans, Mutation, Myeloproliferative Disorders, Neoplasms, Signal Transduction, Phosphatidylinositol 3-Kinases, Mice, Janus Kinase 2
About these checks
Registry, retraction, Cites and statistics results are computed, not judged, with one exception: a printed reference that no index lists is read once by a model before it counts as a citation error. Claims are extracted by a model and kept only when their quote appears verbatim in the text; each cited source is then checked, with a model’s help, for whether it says what the claim relies on. Those verdicts can be wrong — read the claim’s quote and the cited source before relying on one.
A language model drew the claims from the paper on 2026-11-12, under version 3 of the claim definition (model deepseek-v4.1-flash, prompt extract-v3).
A second model labelled each claim on 2026-11-12 (model jev-1.13-20260917, definition revision gold-guideline-v0.2).
Statistics and arithmetic are recomputed, not judged.
Confidence bands are shown only for fields calibrated on our annotated test set. None is calibrated yet, so no band is shown.
What counts as a claim ›How we measure confidence ›How we check this ›
Are you an author, or do you see a problem with this page? Request a review
