Cited by 8Genomics and Chromatin DynamicsNuclear Structure and FunctionProtein Structure and Dynamics

The DOI matches its Crossref record; 3 of the 3 references it cites were found in a registry or an index.

CODANIN-1 sequesters ASF1 by using a histone H3 mimic helix to regulate the histone supply

Open access
Jeong, Tae-Kyeong, Frater, R. Ciaran MacKenzie, Yoon, Jongha, Groth, Anja, Song, Ji-Joon·2025·Nature Communications

Published version of a preprint

Abstract

ASF1 is a major histone chaperone that regulates the supply of histone H3–H4 and facilitates nucleosome assembly to maintain chromatin structure during DNA replication and transcription. CODANIN-1 negatively regulates the function of ASF1. However, the molecular mechanism by which CODANIN-1 inhibits the ASF1-mediated histone supply remains elusive. Here, we present the cryo-EM structure of a human CODANIN-1_ASF1A complex at 3.75 Å resolution. The structure reveals that CODANIN-1 forms a dimer where each monomer holds two ASF1 molecules, utilizing two B-domains and two histone H3 mimic helices (HMHs). The interaction of CODANIN-1 with ASF1 via the HMH and B-domains inhibits the formation of an ASF1/H3–H4 complex and sequesters ASF1 in the cytoplasm. Our study provides a structural and molecular basis for the function of CODANIN-1 as negative regulator that highjacks ASF1 interaction sites with histones and downstream chaperones to inhibit nucleosome assembly. CODANIN-1 negatively regulates the function of ASF1, the key chaperone for histone H3-H4 supply. Here the authors present the cryo-EM structure of the CODANIN-1_ASF1A complex, showing that CODANIN-1 utilizes histone H3-mimic helices and B-domains to sequester ASF1A, thereby inhibiting ASF1 function.

Overview

The claims and statistics of this paper haven’t been checked yet.

Run the check — free, no account needed. It reads the open-access text and checks the sources it cites.

A few free checks a day · papers already verified open instantly · results are public

Integrity signals

Registry

Crossref · 10.1038/s41467-025-56976-7

Cites

3 of 3 references verified0 citation errors · 0 not checkable

Statistics

Figures

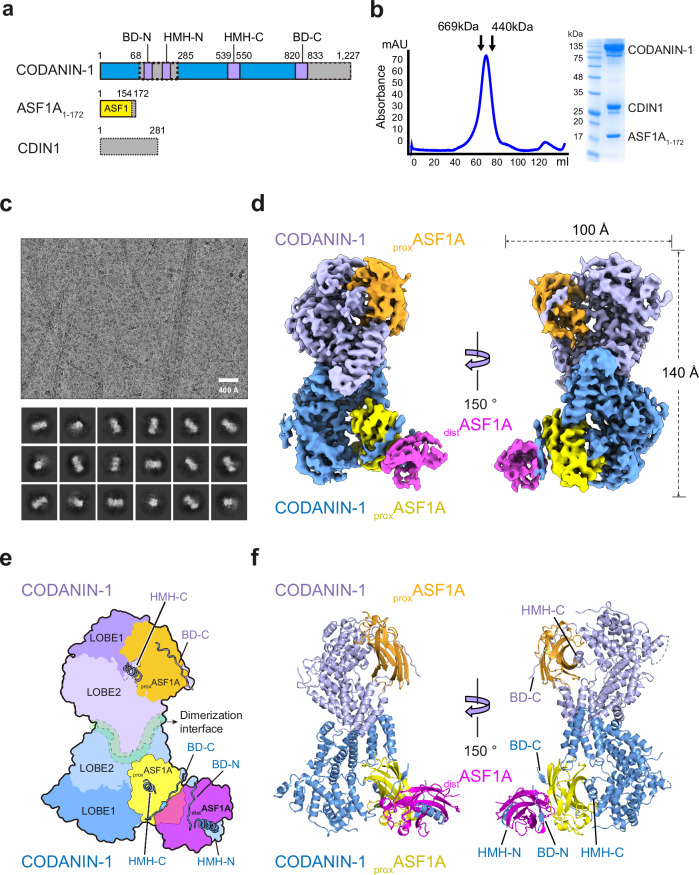
Fig. 1 Cryo-EM structure of the CODANIN-1 complex. a Schematic diagram of the CODANIN-1 complex composed of CODANIN-1 full-length (1–1227), C-terminal-truncated ASF1A1-172 (1–172 a.a.) and full-length CDIN1 (1–281 a.a.). The dotted boxes indicate the disordered region in the cryo-EM map. b Gel filtration profile and SDS‒PAGE analysis of the CODANIN-1 complex. The gel filtration profile is representative of n = 4 biological replicates. c Representative cryo-EM micrograph of the CODANIN-1 complex on a graphene oxide-covered grid and 2D class averages. The micrograph is representative of total 4075 selected micrographs. d Cryo-EM map of the CODANIN-1 complex. Two CODANIN-1 molecules in a dimer are colored pale blue and pale purple, the bound proximal ASF1A is yellow and orange, and the distal ASF1A is magenta. e Schematic diagram of the structure of the CODANIN-1_ASF1A complex. f The atomic structure of the CODANIN-1_ASF1A complex is shown in a ribbon diagram.
Fig. 1 Cryo-EM structure of the CODANIN-1 complex. a Schematic diagram of the CODANIN-1 complex composed of CODANIN-1 full-length (1–1227), C-terminal-truncated ASF1A1-172 (1–172 a.a.) and full-length CDIN1 (1–281 a.a.). The dotted boxes indicate the disordered region in the cryo-EM map. b Gel filtration profile and SDS‒PAGE analysis of the CODANIN-1 complex. The gel filtration profile is representative of n = 4 biological replicates. c Representative cryo-EM micrograph of the CODANIN-1 complex on a graphene oxide-covered grid and 2D class averages. The micrograph is representative of total 4075 selected micrographs. d Cryo-EM map of the CODANIN-1 complex. Two CODANIN-1 molecules in a dimer are colored pale blue and pale purple, the bound proximal ASF1A is yellow and orange, and the distal ASF1A is magenta. e Schematic diagram of the structure of the CODANIN-1_ASF1A complex. f The atomic structure of the CODANIN-1_ASF1A complex is shown in a ribbon diagram.CC BY-NC-ND · PubMed Central
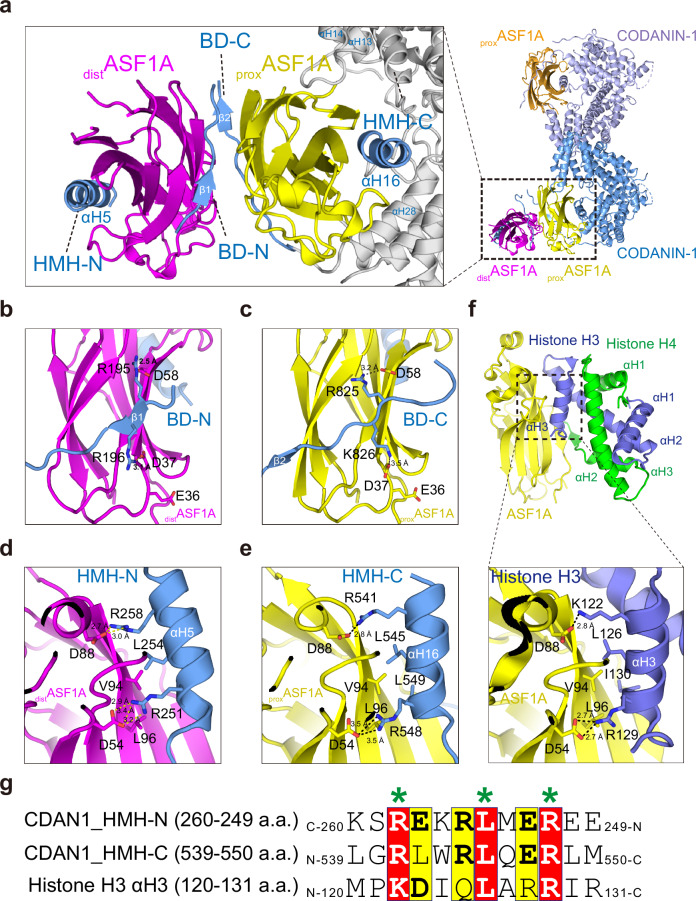
Fig. 2 CODANIN-1 has two ASF1A binding modules, each of which is composed of a B-domain (BD) and a histone mimic helix (HMH). a CODANIN-1 forms a dimer, and each molecule binds two ASF1A molecules: proximal ASF1A (proxASF1A) in yellow or orange and distal ASF1A (distASF1A) in magenta. proxASF1A is encapsulated by BD-C, the αH28 helix, a loop linking the αH13 and αH14 helices, and the αH16 helix (HMH-C). distASF1A is sandwiched by BD-N and the αH5 helix (HMH-N). b, c Detailed interactions between distASF1A and BD-N (193–202 a.a.) (b) and between proxASF1A and BD-C (820–833 a.a.) (c). D37 and D58 in distASF1A (b) and proxASF1A (c) form salt bridges with R196 and R195 in BD-N and K826 and R825 in BD-C, respectively. d, e, f Interaction modes of HMH-N with distASF1A (d), HMH-C with proxASF1A (e) and between histone H3 and the ASF1A complex (PDB 2IO5) (f). HMH-N and HMH-C occupy the histone H3 αH3-binding pockets of ASF1A. V94 in distASF1A and proxASF1A form hydrophobic interactions with HMH-N L254 and with HMH-C L545 and L549, respectively. D88 and D54 in distASF1A and proxASF1A form salt bridges with HMH-N R258 and R251 and with HMH-C R541 and R548, respectively. g Sequence comparison between the two CODANIN-1 HMHs (CDAN1_HMH-N and CDAN1_HMH-C) and histone H3 αH3. The residues that interact with ASF1A are marked with asterisks. HMH-N is aligned with HMH-C and histone H3 αH3 in the C-to-N direction.
Fig. 2 CODANIN-1 has two ASF1A binding modules, each of which is composed of a B-domain (BD) and a histone mimic helix (HMH). a CODANIN-1 forms a dimer, and each molecule binds two ASF1A molecules: proximal ASF1A (proxASF1A) in yellow or orange and distal ASF1A (distASF1A) in magenta. proxASF1A is encapsulated by BD-C, the αH28 helix, a loop linking the αH13 and αH14 helices, and the αH16 helix (HMH-C). distASF1A is sandwiched by BD-N and the αH5 helix (HMH-N). b, c Detailed interactions between distASF1A and BD-N (193–202 a.a.) (b) and between proxASF1A and BD-C (820–833 a.a.) (c). D37 and D58 in distASF1A (b) and proxASF1A (c) form salt bridges with R196 and R195 in BD-N and K826 and R825 in BD-C, respectively. d, e, f Interaction modes of HMH-N with distASF1A (d), HMH-C with proxASF1A (e) and between histone H3 and the ASF1A complex (PDB 2IO5) (f). HMH-N and HMH-C occupy the histone H3 αH3-binding pockets of ASF1A. V94 in distASF1A and proxASF1A form hydrophobic interactions with HMH-N L254 and with HMH-C L545 and L549, respectively. D88 and D54 in distASF1A and proxASF1A form salt bridges with HMH-N R258 and R251 and with HMH-C R541 and R548, respectively. g Sequence comparison between the two CODANIN-1 HMHs (CDAN1_HMH-N and CDAN1_HMH-C) and histone H3 αH3. The residues that interact with ASF1A are marked with asterisks. HMH-N is aligned with HMH-C and histone H3 αH3 in the C-to-N direction.CC BY-NC-ND · PubMed Central
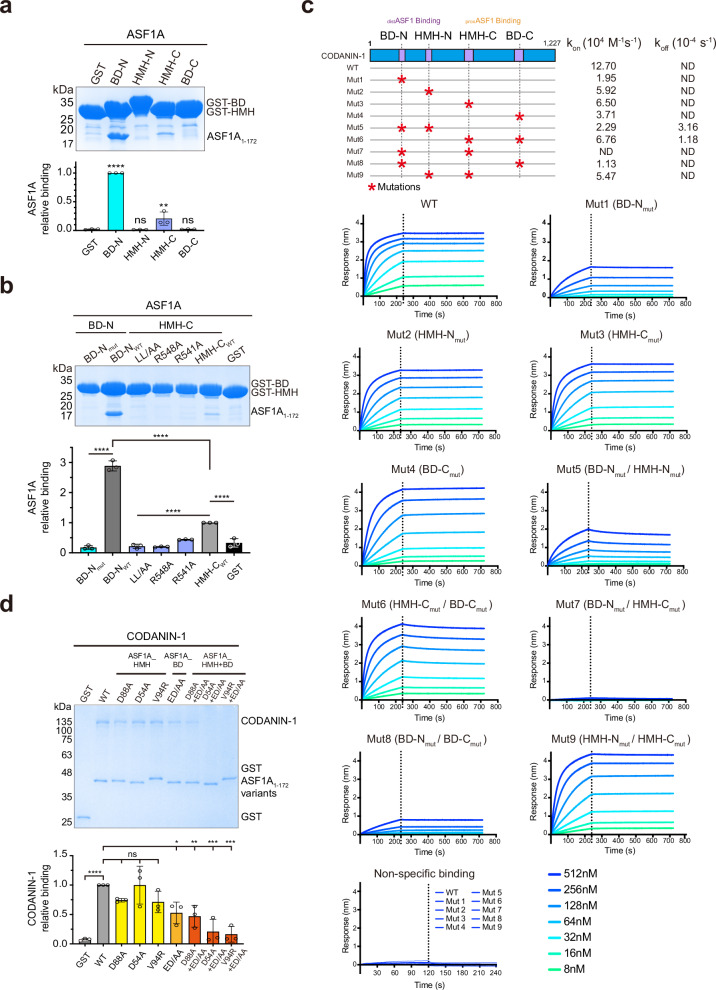
Fig. 3 HMH and the B-domain of CODANIN-1 synergistically contribute to ASF1A binding. a GST pulldowns of ASF1A with the GST-BD-N (183–217 a.a.), GST-HMH-N (255–285 a.a.), GST-HMH-C (520–557 a.a.) and GST-BD-N (816–843 a.a.) domains. For the bar graph, each dot represents a biological replicate (n = 3), error bars represent the mean ± SD. P-values were calculated with one-way analysis of variance (ANOVA) with Dunnett’s multiple comparisons test against GST (BD-N: p < 0.0001, HMH-N: p = 0.9998, HMH-C: p = 0.0043, BD-C: p > 0.9999). b GST pulldowns of ASF1A with GST-HMH-C mutants (R541A, R548A or LL/AA) and GST-BD-N mutants (BD-Nmut-R195A/R196A). For the bar graph, each dot represents a biological replicate (n = 3), error bars represent the mean ± SD. P-values were calculated with one-way analysis of variance (ANOVA) with Dunnett’s multiple comparisons test (BD-Nmut: p < 0.0001 against BD-Nwt, LL/AA, R548A and R541A: p < 0.0001 against HMH-Cwt, BD-Nwt and HMH-Cwt: p < 0.0001 against GST). c Biolayer interferometry (BLI) measurement of ASF1A binding to full-length CODANIN-1 and the indicated mutants. ASF1A was immobilized on the surface of the chips, and CODANIN-1 was injected at 8, 16, 32, 64, 128, 256, and 512 nM concentrations. The dotted line indicates the time points at which the analytes (CODANIN-1) were removed. Schematic diagram of the mutants (top panel): Mut1 (BD-Nmut), Mut2 (HMH-Nmut), Mut3 (HMH-Cmut), Mut4 (BD-Cmut), Mut5 (BD-Nmut/HMH-Nmut), Mut6 (HMH-Cmut/BD-Cmut), Mut7 (BD-Nmut/HMH-Cmut), Mut8 (BD-Nmut/BD-Cmut) and Mut9 (HMH-Nmut/HMH-Cmut). ND ( < 10−7 or no binding). None of the mutants bound to the chip surface without ASF1A immobilization (nonspecific binding). d GST pulldowns of full-length CODANIN-1 using wild-type GST-ASF1A and the indicated mutants. ASF1A mutants on the HMH binding surface (D88A, D54A, V94R), the B-domain binding surface in ASF1A (ED/AA: E36A/D37A), and double mutants of both (D88A + ED/AA, D54A + ED/AA, V94R + ED/AA) were tested. For the bar graph, each dot represents a biological replicate (n = 3), error bars represent the mean ± SD. P-values were calculated with one-way analysis of variance (ANOVA) with Dunnett’s multiple comparisons test against WT (GST: p < 0.0001, D88A: p = 0.3572, D54A: p > 0.9999, V94R: p = 0.2566, ED/AA: p = 0.0209, D88A + ED/AA: p = 0.0087, D54A + ED/AA: p = 0.0002, V94R + ED/AA: p = 0.0001). For the all bar graphs, ns: not significant, *: p < 0.05, **: p < 0.01, ***: p < 0.001, ****: p < 0.0001. Source data are provided as a Source Data file.
Fig. 3 HMH and the B-domain of CODANIN-1 synergistically contribute to ASF1A binding. a GST pulldowns of ASF1A with the GST-BD-N (183–217 a.a.), GST-HMH-N (255–285 a.a.), GST-HMH-C (520–557 a.a.) and GST-BD-N (816–843 a.a.) domains. For the bar graph, each dot represents a biological replicate (n = 3), error bars represent the mean ± SD. P-values were calculated with one-way analysis of variance (ANOVA) with Dunnett’s multiple comparisons test against GST (BD-N: p < 0.0001, HMH-N: p = 0.9998, HMH-C: p = 0.0043, BD-C: p > 0.9999). b GST pulldowns of ASF1A with GST-HMH-C mutants (R541A, R548A or LL/AA) and GST-BD-N mutants (BD-Nmut-R195A/R196A). For the bar graph, each dot represents a biological replicate (n = 3), error bars represent the mean ± SD. P-values were calculated with one-way analysis of variance (ANOVA) with Dunnett’s multiple comparisons test (BD-Nmut: p < 0.0001 against BD-Nwt, LL/AA, R548A and R541A: p < 0.0001 against HMH-Cwt, BD-Nwt and HMH-Cwt: p < 0.0001 against GST). c Biolayer interferometry (BLI) measurement of ASF1A binding to full-length CODANIN-1 and the indicated mutants. ASF1A was immobilized on the surface of the chips, and CODANIN-1 was injected at 8, 16, 32, 64, 128, 256, and 512 nM concentrations. The dotted line indicates the time points at which the analytes (CODANIN-1) were removed. Schematic diagram of the mutants (top panel): Mut1 (BD-Nmut), Mut2 (HMH-Nmut), Mut3 (HMH-Cmut), Mut4 (BD-Cmut), Mut5 (BD-Nmut/HMH-Nmut), Mut6 (HMH-Cmut/BD-Cmut), Mut7 (BD-Nmut/HMH-Cmut), Mut8 (BD-Nmut/BD-Cmut) and Mut9 (HMH-Nmut/HMH-Cmut). ND ( < 10−7 or no binding). None of the mutants bound to the chip surface without ASF1A immobilization (nonspecific binding). d GST pulldowns of full-length CODANIN-1 using wild-type GST-ASF1A and the indicated mutants. ASF1A mutants on the HMH binding surface (D88A, D54A, V94R), the B-domain binding surface in ASF1A (ED/AA: E36A/D37A), and double mutants of both (D88A + ED/AA, D54A + ED/AA, V94R + ED/AA) were tested. For the bar graph, each dot represents a biological replicate (n = 3), error bars represent the mean ± SD. P-values were calculated with one-way analysis of variance (ANOVA) with Dunnett’s multiple comparisons test against WT (GST: p < 0.0001, D88A: p = 0.3572, D54A: p > 0.9999, V94R: p = 0.2566, ED/AA: p = 0.0209, D88A + ED/AA: p = 0.0087, D54A + ED/AA: p = 0.0002, V94R + ED/AA: p = 0.0001). For the all bar graphs, ns: not significant, *: p < 0.05, **: p < 0.01, ***: p < 0.001, ****: p < 0.0001. Source data are provided as a Source Data file.CC BY-NC-ND · PubMed Central
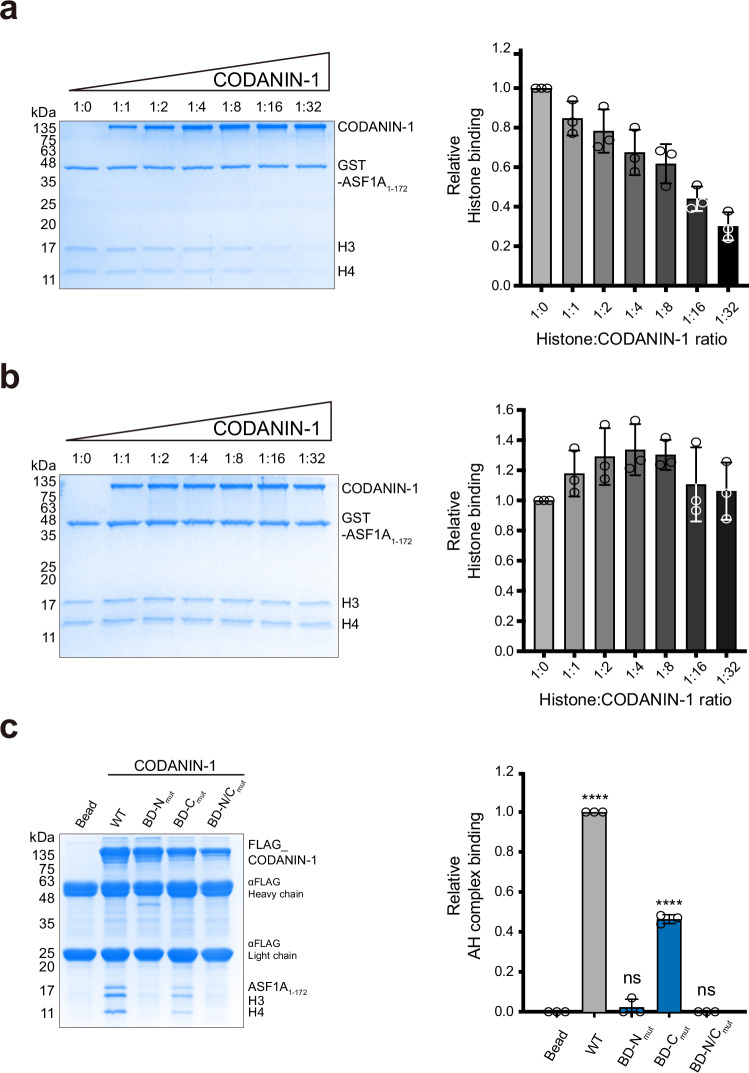
Fig. 4 CODANIN-1 sequesters free ASF1A to prevent complex formation with histone H3–H4. a GST-ASF1A pulldown experiment using CODANIN-1 and histone H3–H4 (left panel). The ratio of histone H3–H4 to CODANIN-1 is indicated above each gel lane. Quantification of histone H3–H4 relative to GST-ASF1A (right panel). The value was normalized to the histone H3–H4 band in the absence of CODANIN-1 (1:0 ratio). b Pulldown of CODANIN-1 with a preformed GST-ASF1A/H3–H4 complex (left panel). The ratio of histone H3–H4 to CODANIN-1 is indicated. Quantification of histone H3–H4 relative to GST-ASF1A (right panel). The value was normalized to the histone H3–H4 band in the absence of CODANIN-1 (1:0 ratio). c FLAG-pulldown experiments in which FLAG-tagged full-length CODANIN-1 wild type and mutants (BD-Nmut, BD-Cmut, and BD-N/Cmut) were used for ASF1A/H3–H4 binding. A representative SDS‒PAGE gel is shown in the left panel, and the quantification of the binding (n = 3) is shown in the bar graphs. Each dot represents a biological replicate (n = 3), and bars and error bars represent the mean ± SD. P-values were calculated by one-way analysis of variance (ANOVA) with Dunnett’s multiple comparisons test against ‘Bead’ control (ns: not significant, ****: p < 0.0001, WT: p < 0.0001, BD-Nmut: p = 0.4762, BD-Cmut: p < 0.0001, BD-N/Cmut: p > 0.9999). Source data are provided as a Source Data file.
Fig. 4 CODANIN-1 sequesters free ASF1A to prevent complex formation with histone H3–H4. a GST-ASF1A pulldown experiment using CODANIN-1 and histone H3–H4 (left panel). The ratio of histone H3–H4 to CODANIN-1 is indicated above each gel lane. Quantification of histone H3–H4 relative to GST-ASF1A (right panel). The value was normalized to the histone H3–H4 band in the absence of CODANIN-1 (1:0 ratio). b Pulldown of CODANIN-1 with a preformed GST-ASF1A/H3–H4 complex (left panel). The ratio of histone H3–H4 to CODANIN-1 is indicated. Quantification of histone H3–H4 relative to GST-ASF1A (right panel). The value was normalized to the histone H3–H4 band in the absence of CODANIN-1 (1:0 ratio). c FLAG-pulldown experiments in which FLAG-tagged full-length CODANIN-1 wild type and mutants (BD-Nmut, BD-Cmut, and BD-N/Cmut) were used for ASF1A/H3–H4 binding. A representative SDS‒PAGE gel is shown in the left panel, and the quantification of the binding (n = 3) is shown in the bar graphs. Each dot represents a biological replicate (n = 3), and bars and error bars represent the mean ± SD. P-values were calculated by one-way analysis of variance (ANOVA) with Dunnett’s multiple comparisons test against ‘Bead’ control (ns: not significant, ****: p < 0.0001, WT: p < 0.0001, BD-Nmut: p = 0.4762, BD-Cmut: p < 0.0001, BD-N/Cmut: p > 0.9999). Source data are provided as a Source Data file.CC BY-NC-ND · PubMed Central
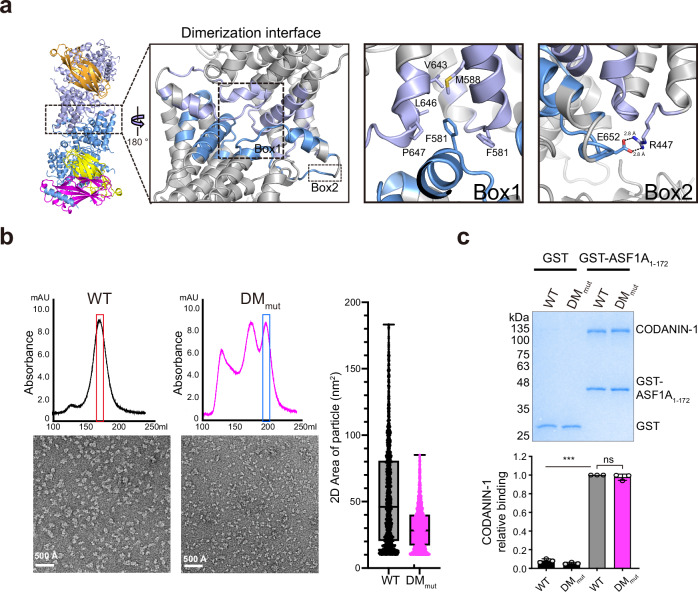
Fig. 5 Dimerization of the CODANIN-1 complex. a Detailed view of the dimer interface of the CODANIN-1 complex. The dashed-line boxes (Boxes 1 and 2) indicate the dimerization interfaces of CODANIN-1 and the enlarged view of the CODANIN-1 dimerization interface. The F581 residue of each CODANIN-1 is inserted into a hydrophobic pocket formed by the F581, M588, V643, L646, and P647 residues from the other CODANIN-1 (Box 1). The R447 and E652 residues from the two different CODANIN-1 molecules form a salt bridge (Box 2). b Size-exclusion chromatograms and negative-stain EM micrograph images of wild-type CODANIN-1 and DMmut (left panel). Box and whisker plot with all points shows the 2-dimensional area of the particles (minimum whisker: minimum value, lower quartile: 25% percentile, center line: median, upper quartile: 75% percentile, maximum whisker: maximum value). The number of particles used in the analysis 1405 for WT and 1862 for DMmut (right panel). c, GST-pulldown experiment with GST-ASF1A and CODANIN-1 wild-type and DMmut (top panel). The bar graph represents the quantification of CODANIN-1 relative to GST-ASF1A normalized to wild-type CODANIN-1 (right panel). For the bar graphs, each dot represents a biological replicate (n = 3), and bars and error bars represent the mean ± SD. The statistical P-values were calculated with one-way analysis of variance (ANOVA) with Dunnett’s multiple comparisons test against GST-ASF1A bound WT. (ns: not significant, ** p < 0.01, ***: p < 0.001, GST bound WT: p = 0.0009, GST bound DMmut: p = 0.0003, GST-ASF1A bound DMmut: p = 0.4153). Source data are provided as a Source Data file.
Fig. 5 Dimerization of the CODANIN-1 complex. a Detailed view of the dimer interface of the CODANIN-1 complex. The dashed-line boxes (Boxes 1 and 2) indicate the dimerization interfaces of CODANIN-1 and the enlarged view of the CODANIN-1 dimerization interface. The F581 residue of each CODANIN-1 is inserted into a hydrophobic pocket formed by the F581, M588, V643, L646, and P647 residues from the other CODANIN-1 (Box 1). The R447 and E652 residues from the two different CODANIN-1 molecules form a salt bridge (Box 2). b Size-exclusion chromatograms and negative-stain EM micrograph images of wild-type CODANIN-1 and DMmut (left panel). Box and whisker plot with all points shows the 2-dimensional area of the particles (minimum whisker: minimum value, lower quartile: 25% percentile, center line: median, upper quartile: 75% percentile, maximum whisker: maximum value). The number of particles used in the analysis 1405 for WT and 1862 for DMmut (right panel). c, GST-pulldown experiment with GST-ASF1A and CODANIN-1 wild-type and DMmut (top panel). The bar graph represents the quantification of CODANIN-1 relative to GST-ASF1A normalized to wild-type CODANIN-1 (right panel). For the bar graphs, each dot represents a biological replicate (n = 3), and bars and error bars represent the mean ± SD. The statistical P-values were calculated with one-way analysis of variance (ANOVA) with Dunnett’s multiple comparisons test against GST-ASF1A bound WT. (ns: not significant, ** p < 0.01, ***: p < 0.001, GST bound WT: p = 0.0009, GST bound DMmut: p = 0.0003, GST-ASF1A bound DMmut: p = 0.4153). Source data are provided as a Source Data file.CC BY-NC-ND · PubMed Central
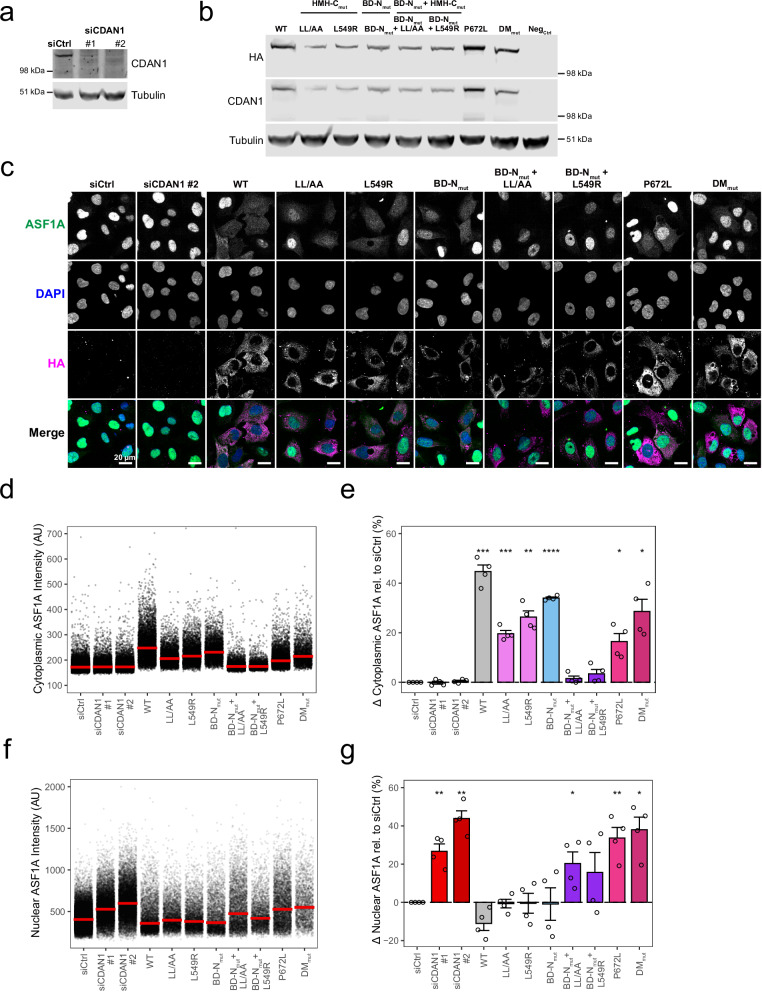
Fig. 6 One B-domain and one HMH are required for cytoplasmic sequestration of ASF1A is required for cytoplasmic sequestration by CODANIN-1. a Western blot of endogenous CODANIN-1 after 48 h of siRNA treatment with control siRNA (siCtrl) or siRNA targeting CDAN1 (siCDAN1 #1 and #2). b Western blot showing the expression of HA-tagged CODANIN-1 after 24 h of treatment with doxycycline and Shield1. WT: wild type, HMH and B-domain mutants, DMmut: dimerization mutant, Neg: no exogenous CODANIN-1. The Western blot is representative of n = 2 biological replicates. c Representative images of ASF1A localization in cell lines complemented with exogenous WT and mutant CODANIN-1 as indicated. The siCtrl and siCDAN1 #2 panels represent the parental cell lines with control or CDAN1 knockdown, respectively. Each cell line was treated with CDAN1#2 siRNA for 48 h, and doxycycline and Shield1 were added for the last 24 h to induce the expression of exogenous CODANIN-1. d Cytoplasmic ASF1A intensity quantified in individual cells from a single biological replicate as in c. For complementation with exogenous CODANIN-1, only HA-expressing cells were included. The bars repserent the median and interquartile range of each condition. e Relative change in cytoplasmic ASF1A intensity compared with that of the control. For each condition the difference in median cytoplasmic ASF1A intensity compared with the median of siCtrl was calculated (% change). Each dot represents a biological replicate (n = 4), and the bars and error bars represent the means±SDs. P-values were calculated by two-sided paired t-test against siCtrl (* p < 0.05, ** p < 0.01, *** p < 0.001, **** p < 0.0001, WT: p = 4.4 × 10⁻⁴, LL/AA: p = 5 × 10⁻⁴, L549R: p = 1.6 × 10⁻³, BD-Nmut: p = 4.8 × 10⁻⁵, P672L: p = 1.5 × 10⁻², DMmut: p = 1.2 × 10⁻²). f, g Nuclear ASF1A intensity quantified in HA-expressing cells using the same methods as in d,e. A minimum of 2000 cells HA-expressing were considered per condition. Each dot represents a biological replicate (n = 4), and bars and error bars represent the mean±SD. P-values were calculated by two-sided paired t-test against siCtrl (* p < 0.05, ** p < 0.01, *** p < 0.001, **** p < 0.0001, siCDAN1 #1: p = 8.3 × 10⁻³, siCDAN1 #2: p = 1.5 × 10⁻³, BD-Nmut + LL/AA: p = 4 × 10⁻², P672L: p = 8.1 × 10⁻³, DMmut: p = 1 × 10⁻²). Source data are provided as a Source Data file.
Fig. 6 One B-domain and one HMH are required for cytoplasmic sequestration of ASF1A is required for cytoplasmic sequestration by CODANIN-1. a Western blot of endogenous CODANIN-1 after 48 h of siRNA treatment with control siRNA (siCtrl) or siRNA targeting CDAN1 (siCDAN1 #1 and #2). b Western blot showing the expression of HA-tagged CODANIN-1 after 24 h of treatment with doxycycline and Shield1. WT: wild type, HMH and B-domain mutants, DMmut: dimerization mutant, Neg: no exogenous CODANIN-1. The Western blot is representative of n = 2 biological replicates. c Representative images of ASF1A localization in cell lines complemented with exogenous WT and mutant CODANIN-1 as indicated. The siCtrl and siCDAN1 #2 panels represent the parental cell lines with control or CDAN1 knockdown, respectively. Each cell line was treated with CDAN1#2 siRNA for 48 h, and doxycycline and Shield1 were added for the last 24 h to induce the expression of exogenous CODANIN-1. d Cytoplasmic ASF1A intensity quantified in individual cells from a single biological replicate as in c. For complementation with exogenous CODANIN-1, only HA-expressing cells were included. The bars repserent the median and interquartile range of each condition. e Relative change in cytoplasmic ASF1A intensity compared with that of the control. For each condition the difference in median cytoplasmic ASF1A intensity compared with the median of siCtrl was calculated (% change). Each dot represents a biological replicate (n = 4), and the bars and error bars represent the means±SDs. P-values were calculated by two-sided paired t-test against siCtrl (* p < 0.05, ** p < 0.01, *** p < 0.001, **** p < 0.0001, WT: p = 4.4 × 10⁻⁴, LL/AA: p = 5 × 10⁻⁴, L549R: p = 1.6 × 10⁻³, BD-Nmut: p = 4.8 × 10⁻⁵, P672L: p = 1.5 × 10⁻², DMmut: p = 1.2 × 10⁻²). f, g Nuclear ASF1A intensity quantified in HA-expressing cells using the same methods as in d,e. A minimum of 2000 cells HA-expressing were considered per condition. Each dot represents a biological replicate (n = 4), and bars and error bars represent the mean±SD. P-values were calculated by two-sided paired t-test against siCtrl (* p < 0.05, ** p < 0.01, *** p < 0.001, **** p < 0.0001, siCDAN1 #1: p = 8.3 × 10⁻³, siCDAN1 #2: p = 1.5 × 10⁻³, BD-Nmut + LL/AA: p = 4 × 10⁻², P672L: p = 8.1 × 10⁻³, DMmut: p = 1 × 10⁻²). Source data are provided as a Source Data file.CC BY-NC-ND · PubMed Central

Verification

Claims the paper makes

The claims and statistics of this paper haven’t been checked yet.

Run the check — free, no account needed. It reads the open-access text and checks the sources it cites.

A few free checks a day · papers already verified open instantly · results are public

Self-check

Percentages, sums and reported differences re-computed from the paper’s own numbers.

The self-check needs the paper’s full text.

Citations

Cites

Research works printed but not linked: 63

  1. Luger, K., Mäder, A. W., Richmond, R. K., Sargent, D. F. & Richmond, T. J. Crystal structure of the nucleosome core particle at 2.8 Å resolution. Nature 389, 251–260 (1997). · DOI · Paper page
  2. Bannister, A. J. & Kouzarides, T. Regulation of chromatin by histone modifications. Cell Res. 21, 381–395 (2011). · DOI · Paper page
  3. Li, B., Carey, M. & Workman, J. L. The role of chromatin during transcription. Cell 128, 707–719 (2007). · DOI
  4. Kornberg, R. D. & Lorch, Y. Twenty-five years of the nucleosome, fundamental particle of the eukaryote chromosome. Cell 98, 285–294 (1999). · DOI
  5. Groth, A., Rocha, W., Verreault, A. & Almouzni, G. Chromatin challenges during DNA replication and repair. Cell 128, 721–733 (2007). · DOI
  6. Teves, S. S., Weber, C. M. & Henikoff, S. Transcribing through the nucleosome. Trends Biochem Sci. 39, 577–586 (2014). · DOI
  7. Hammond, C. M., Strømme, C. B., Huang, H., Patel, D. J. & Groth, A. Histone chaperone networks shaping chromatin function. Nat. Rev. Mol. Cell Biol. 18, 141–158 (2017). · DOI
  8. Groth, A. et al. Human Asf1 regulates the flow of S phase histones during replicational stress. Mol. Cell 17, 301–311 (2005). · DOI
  9. Corpet, A. et al. Asf1b, the necessary Asf1 isoform for proliferation, is predictive of outcome in breast cancer. EMBO J. 30, 480–493 (2011). · DOI
  10. Jasencakova, Z. et al. Replication stress interferes with histone recycling and predeposition marking of new histones. Mol. Cell 37, 736–743 (2010). · DOI
  11. Campos, E. I. et al. The program for processing newly synthesized histones H3.1 and H4. Nat. Struct. Mol. Biol. 17, 1343–1351 (2010). · DOI
  12. Hammond, C. M. et al. DNAJC9 integrates heat shock molecular chaperones into the histone chaperone network. Mol. Cell 81, 2533–2548.e9 (2021). · DOI
  13. Ai, X. & Parthun, M. R. The nuclear Hat1p/Hat2p complex: a molecular link between type B histone acetyltransferases and chromatin assembly. Mol. Cell 14, 195–205 (2004). · DOI
  14. Barman, H. K. et al. Histone acetyltransferase-1 regulates integrity of cytosolic histone H3-H4 containing complex. Biochem Biophys. Res Commun. 373, 624–630 (2008). · DOI
  15. Yoon, J. et al. Integrative structural investigation on the architecture of human importin4_Histone H3/H4_Asf1a complex and its histone H3 tail binding. J. Mol. Biol. 430, 822–841 (2018). · DOI
  16. Bernardes, N. E., Fung, H. Y. J., Li, Y., Chen, Z. & Chook, Y. M. Structure of IMPORTIN-4 bound to the H3–H4–ASF1 histone–histone chaperone complex. Proc. Natl Acad. Sci. 119, e2207177119 (2022). · DOI
  17. Tyler, J. K. et al. The RCAF complex mediates chromatin assembly during DNA replication and repair. Nature 402, 555–560 (1999). · DOI
  18. Mello, J. A. et al. Human Asf1 and CAF‐1 interact and synergize in a repair‐coupled nucleosome assembly pathway. EMBO Rep. 3, 329–334 (2002). · DOI
  19. Ray-Gallet, D. et al. HIRA is critical for a nucleosome assembly pathway independent of DNA synthesis. Mol. Cell 9, 1091–1100 (2002). · DOI
  20. Tagami, H., Ray-Gallet, D., Almouzni, G. & Nakatani, Y. Histone H3.1 and H3.3 complexes mediate nucleosome assembly pathways dependent or independent of DNA synthesis. Cell 116, 51–61 (2004). · DOI
  21. Loppin, B. et al. The histone H3.3 chaperone HIRA is essential for chromatin assembly in the male pronucleus. Nature 437, 1386–1390 (2005). · DOI
  22. Groth, A. et al. Regulation of replication fork progression through histone supply and demand. Science 318, 1928–1931 (2007). · DOI
  23. Sanematsu, F. et al. Asf1 is required for viability and chromatin assembly during DNA replication in vertebrate cells. J. Biol. Chem. 281, 13817–13827 (2006). · DOI
  24. Schulz, L. L. & Tyler, J. K. The histone chaperone ASF1 localizes to active DNA replication forks to mediate efficient DNA replication. FASEB J. 20, 488–490 (2006). · DOI
  25. English, C. M., Adkins, M. W., Carson, J. J., Churchill, M. E. A. & Tyler, J. K. Structural basis for the histone chaperone activity of Asf1. Cell 127, 495–508 (2006). · DOI
  26. Natsume, R. et al. Structure and function of the histone chaperone CIA/ASF1 complexed with histones H3 and H4. Nature 446, 338–341 (2007). · DOI
  27. Tang, Y. et al. Structure of a human ASF1a-HIRA complex and insights into specificity of histone chaperone complex assembly. Nat. Struct. Mol. Biol. 13, 921–929 (2006). · DOI
  28. Malay, A. D., Umehara, T., Matsubara-Malay, K., Padmanabhan, B. & Yokoyama, S. Crystal structures of fission yeast histone chaperone Asf1 complexed with the Hip1 B-domain or the Cac2 C terminus. J. Biol. Chem. 283, 14022–14031 (2008). · DOI
  29. Ask, K. et al. Codanin-1, mutated in the anaemic disease CDAI, regulates Asf1 function in S-phase histone supply. Embo j. 31, 2013–2023 (2012). · DOI
  30. Shroff, M., Knebel, A., Toth, R. & Rouse, J. A complex comprising C15ORF41 and Codanin-1: the products of two genes mutated in congenital dyserythropoietic anaemia type I (CDA-I). Biochemical J. 477, 1893–1905 (2020). · DOI
  31. Swickley, G. et al. Characterization of the interactions between Codanin-1 and C15Orf41, two proteins implicated in congenital dyserythropoietic anemia type I disease. BMC Mol. Cell Biol. 21, 18 (2020). · DOI
  32. Stojaspal, M. et al. Structural insights into inherited anemia CDA-I: disease-associated mutations disrupt CDIN1-Codanin1 complex. bioRxiv, https://doi.org/10.1101/2023.05.25.542057 (2023). · DOI
  33. Dgany, O. et al. Congenital dyserythropoietic anemia type i is caused by mutations in codanin-1. Am. J. Hum. Genet. 71, 1467–1474 (2002). · DOI · Paper page
  34. Babbs, C. et al. Homozygous mutations in a predicted endonuclease are a novel cause of congenital dyserythropoietic anemia type I. Haematologica 98, 1383–1387 (2013). · DOI
  35. Heimpel, H., Forteza-Vila, J., Qveisser, W. & Spiertz, E. Electron and light microscopic study of the erythroblasts of patients with congenital dyserythropoietic anemia. Blood 37, 299–310 (1971). · DOI
  36. Noy-Lotan, S. et al. Cdan1 is essential for primitive erythropoiesis. Front. Physiol. 12, 685242 (2021). · DOI
  37. Noy-Lotan, S. et al. Codanin-1, the protein encoded by the gene mutated in congenital dyserythropoietic anemia type I (CDAN1), is cell cycle-regulated. Haematologica 94, 629 (2009). · DOI
  38. Carraro, M. et al. DAXX adds a de novo H3.3K9me3 deposition pathway to the histone chaperone network. Mol. Cell 83, 1075–1092.e9 (2023). · DOI
  39. Haugwitz, M., Garachtchenko, T., Nourzaie, O., Gandlur, S. & Sagawa, H. Rapid, on-demand protein stabilization and destabilization using the ProteoTuner™ systems. Nat. Methods 5, iii–iv (2008). · DOI
  40. Sedor, S. F. & Shao, S. Mechanism of ASF1 Inhibition by CDAN1. bioRxiv https://doi.org/10.1101/2024.08.08.607204 (2024). · DOI
  41. Jiao, Y. et al. Surprising complexity of the Asf1 histone chaperone-Rad53 kinase interaction. Proc. Natl Acad. Sci. USA 109, 2866–2871 (2012). · DOI
  42. Simon, B. et al. Tousled-like kinase 2 targets ASF1 histone chaperones through client mimicry. Nat. Commun. 13, 749 (2022). · DOI
  43. Lercher, L., Danilenko, N., Kirkpatrick, J. & Carlomagno, T. Structural characterization of the Asf1-Rtt109 interaction and its role in histone acetylation. Nucleic Acids Res 46, 2279–2289 (2018). · DOI
  44. Feng, S. et al. RIF1-ASF1-mediated high-order chromatin structure safeguards genome integrity. Nat. Commun. 13, 957 (2022). · DOI
  45. Olijnik, A.-A. et al. Genetic and functional insights into CDA-I prevalence and pathogenesis. J. Med. Genet. 58, 185 (2021). · DOI
  46. Popova, E. Y. et al. Chromatin condensation in terminally differentiating mouse erythroblasts does not involve special architectural proteins but depends on histone deacetylation. Chromosome Res 17, 47–64 (2009). · DOI
  47. Ji, P., Yeh, V., Ramirez, T., Murata-Hori, M. & Lodish, H. F. Histone deacetylase 2 is required for chromatin condensation and subsequent enucleation of cultured mouse fetal erythroblasts. Haematologica 95, 2013–2021 (2010). · DOI
  48. Hattangadi, S. M. et al. Histones to the cytosol: exportin 7 is essential for normal terminal erythroid nuclear maturation. Blood 124, 1931–1940 (2014). · DOI
  49. Zhao, B. et al. Nuclear condensation during mouse erythropoiesis requires caspase-3-mediated nuclear opening. Dev. Cell 36, 498–510 (2016). · DOI
  50. Roy, N. B. A. & Babbs, C. The pathogenesis, diagnosis and management of congenital dyserythropoietic anaemia type I. Br. J. Haematol. 185, 436–449 (2019). · DOI
  51. Marra, R. et al. Unveiling the genetic landscape of suspected congenital dyserythropoietic anemia type I: a retrospective cohort study of 36 patients. Am. J. Hematol. 99, 1511–1522 (2024). · DOI
  52. Kastner, B. et al. GraFix: sample preparation for single-particle electron cryomicroscopy. Nat. Methods 5, 53–55 (2008). · DOI
  53. Punjani, A., Rubinstein, J. L., Fleet, D. J. & Brubaker, M. A. cryoSPARC: algorithms for rapid unsupervised cryo-EM structure determination. Nat. Methods 14, 290–296 (2017). · DOI · Paper page
  54. Zheng, S. Q. et al. MotionCor2: anisotropic correction of beam-induced motion for improved cryo-electron microscopy. Nat. Methods 14, 331–332 (2017). · DOI
  55. Rohou, A. & Grigorieff, N. CTFFIND4: Fast and accurate defocus estimation from electron micrographs. J. Struct. Biol. 192, 216–221 (2015). · DOI
  56. Bepler, T. et al. Positive-unlabeled convolutional neural networks for particle picking in cryo-electron micrographs. Nat. Methods 16, 1153–1160 (2019). · DOI
  57. Rubinstein, J. L. & Brubaker, M. A. Alignment of cryo-EM movies of individual particles by optimization of image translations. J. Struct. Biol. 192, 188–195 (2015). · DOI
  58. Punjani, A., Zhang, H. & Fleet, D. J. Non-uniform refinement: adaptive regularization improves single-particle cryo-EM reconstruction. Nat. Methods 17, 1214–1221 (2020). · DOI
  59. Pettersen, E. F. et al. UCSF ChimeraX: Structure visualization for researchers, educators, and developers. Protein Sci. 30, 70–82 (2021). · DOI
  60. Emsley, P., Lohkamp, B., Scott, W. G. & Cowtan, K. Features and development of Coot. Acta Crystallogr D. Biol. Crystallogr 66, 486–501 (2010). · DOI · Paper page
  61. Liebschner, D. et al. Macromolecular structure determination using X-rays, neutrons and electrons: recent developments in Phenix. Acta Crystallogr. Sect. D. 75, 861–877 (2019). · DOI · Paper page
  62. Croll, T. ISOLDE: a physically realistic environment for model building into low-resolution electron-density maps. Acta Crystallogr. Sect. D. 74, 519–530 (2018). · DOI
  63. Mazo, G. QuickFigures: a toolkit and imageJ PlugIn to quickly transform microscope images into scientific figures. PLoS One 16, e0240280 (2021). · DOI

Metadata

Authors
Jeong, T.-K., Frater, R. C. M., Yoon, J., Groth, A., & Song, J.-J.
Affiliations
  • Korea Advanced Institute of Science and Technology (KR)
  • University of Copenhagen (DK)
Corresponding author
  • Groth, Anja
  • Song, Ji-Joon
Venue
Nature Communications
Published
2025-03-04
Volume
16
Issue
1
Pages
2181-2181
ISSN
2041-1723 (ISSN-L)
OpenAlex
W4408149786
Cited by
8
References
3
Citations by year
2026: 4 · 2025: 2
FWCI
1.80
Type
journal article
Language
en
Open access
Locations
  • Nature Communications (publishedVersion, cc-by-nc-nd)
  • bioRxiv (Cold Spring Harbor Laboratory) (acceptedVersion, cc-by-nc-nd)
  • PubMed Central (publishedVersion, cc-by-nc-nd)
  • PubMed (publishedVersion)
  • Research at the University of Copenhagen (University of Copenhagen) (publishedVersion, cc-by-nc-nd)
  • RePEc: Research Papers in Economics (submittedVersion)
  • DOAJ (DOAJ: Directory of Open Access Journals) (submittedVersion, cc-by-sa)
Funders
  • National Research Foundation of Korea (RS-2023-00266300, RS-2024-00440614)
  • Novo Nordisk Fonden (NNF21OC0067425, NNF14CC0001)
Topics
  • Life Sciences › Biochemistry, Genetics and Molecular Biology › Molecular Biology › Genomics and Chromatin Dynamics
  • Life Sciences › Biochemistry, Genetics and Molecular Biology › Molecular Biology › Nuclear Structure and Function
  • Life Sciences › Biochemistry, Genetics and Molecular Biology › Molecular Biology › Protein Structure and Dynamics
Keywords
Asf1, histone chaperone, nucleosome assembly, negative regulation, protein complex structure, B domain, cytoplasmic sequestration, chromatin structure
MeSH terms
Histones, Humans, Models, Molecular, Nucleosomes, Protein Binding, Transcription Factors, Cell Cycle Proteins, Molecular Chaperones, Cryoelectron Microscopy, Protein Multimerization, Histone Chaperones

About these checks

Registry, retraction, Cites and statistics results are computed, not judged, with one exception: a printed reference that no index lists is read once by a model before it counts as a citation error. Claims are extracted by a model and kept only when their quote appears verbatim in the text; each cited source is then checked, with a model’s help, for whether it says what the claim relies on. Those verdicts can be wrong — read the claim’s quote and the cited source before relying on one.

Statistics and arithmetic are recomputed, not judged.

Confidence bands are shown only for fields calibrated on our annotated test set. None is calibrated yet, so no band is shown.

What counts as a claim ›How we measure confidence ›How we check this ›

Are you an author, or do you see a problem with this page? Request a review