

The DOI matches its Crossref record; 11 of the 11 references it cites were found in a registry or an index.
Design of high-affinity binders to immune modulating receptors for cancer immunotherapy
Abstract
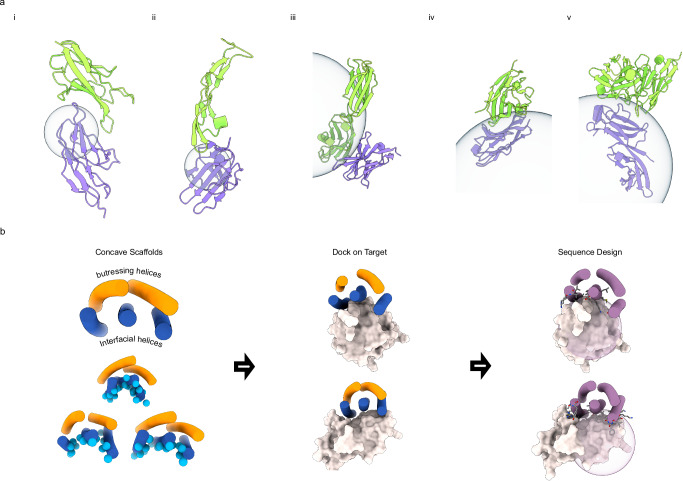
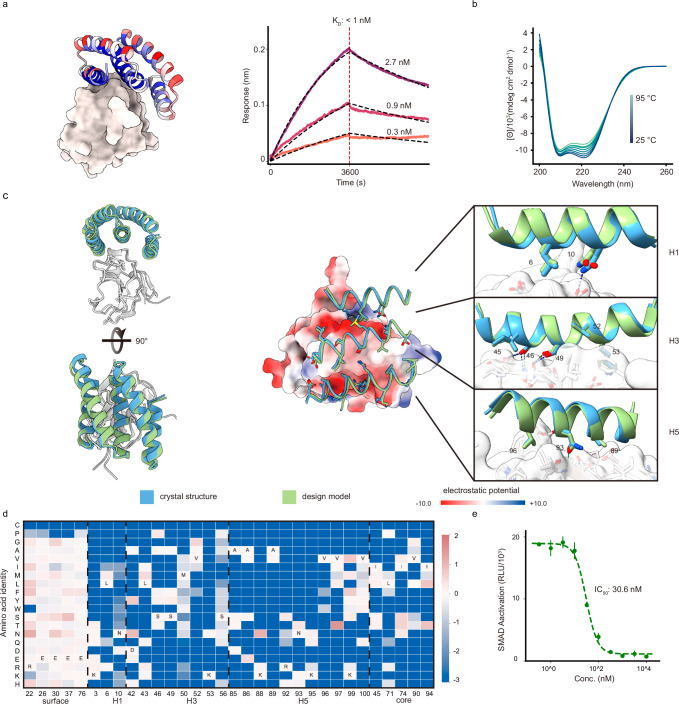
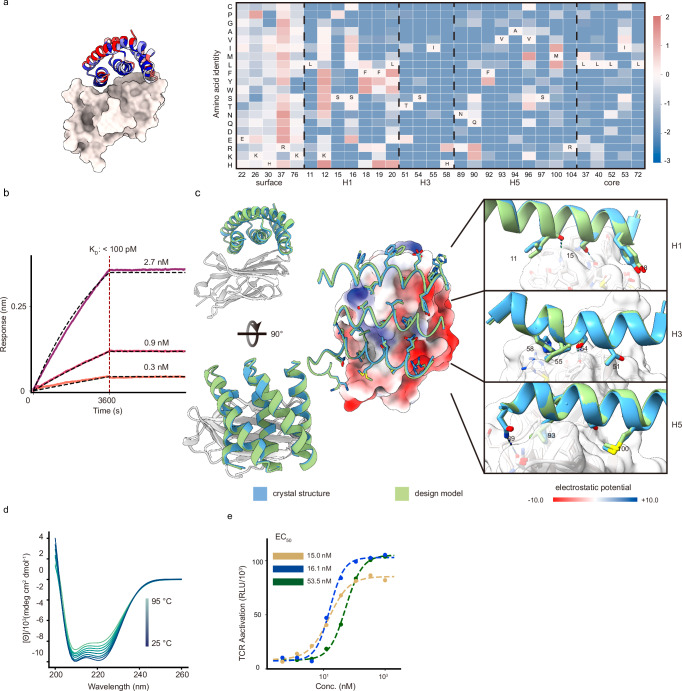
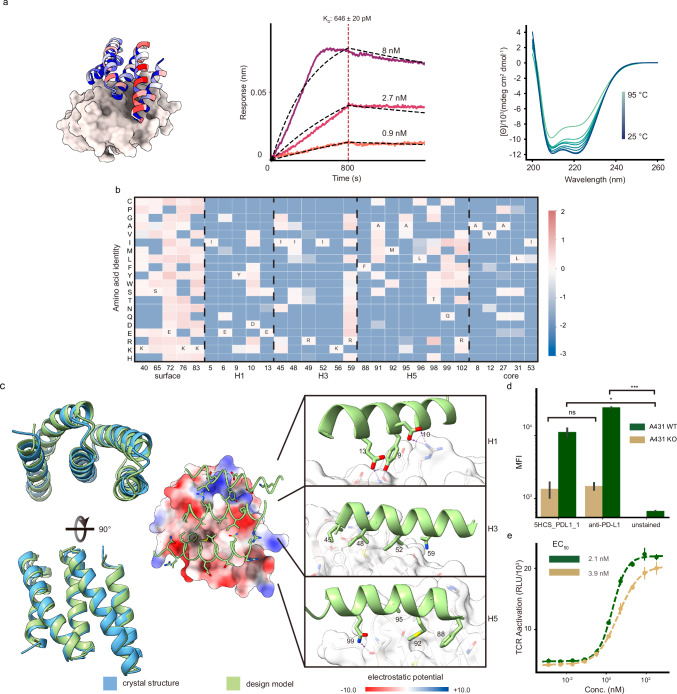
Immune receptors have emerged as critical therapeutic targets for cancer immunotherapy. Designed protein binders can have high affinity, modularity, and stability and hence could be attractive components of protein therapeutics directed against these receptors, but traditional Rosetta based protein binder methods using small globular scaffolds have difficulty achieving high affinity on convex targets. Here we describe the development of helical concave scaffolds tailored to the convex target sites typically involved in immune receptor interactions. We employed these scaffolds to design proteins that bind to TGFβRII, CTLA-4, and PD-L1, achieving low nanomolar to picomolar affinities and potent biological activity following experimental optimization. Co-crystal structures of the TGFβRII and CTLA-4 binders in complex with their respective receptors closely match the design models. These designs should have considerable utility for downstream therapeutic applications.
Overview
The claims and statistics of this paper haven’t been checked yet.
Run the check — free, no account needed. It reads the open-access text and checks the sources it cites.
Integrity signals
Registry
Cites
Statistics
Figures
Verification
Claims the paper makes
The claims and statistics of this paper haven’t been checked yet.
Run the check — free, no account needed. It reads the open-access text and checks the sources it cites.
Claims other papers make about this one
Each is checked against this paper’s own text: does it say what the citing paper says it does?
In the citing paper
“Strategies such as reducing intrinsic affinity, lowering ligand copy number, or optimizing spatial presentation allow carriers to bypass perivascular sequestration and achieve deeper interstitial penetration [93].”
From Overcoming tumor microenvironment barriers: transformable and bioinspired nanomedicine strategies for deep tumor penetration (2026) · cites this paper as [93]
Self-check
Percentages, sums and reported differences re-computed from the paper’s own numbers.
The self-check needs the paper’s full text.
Citations
Cites
Highly accurate protein structure prediction with AlphaFold
Jumper, J., Evans, R., Pritzel, A., Green, T., Figurnov, M., Ronneberger, O., Tunyasuvunakool, K., Bates, R., Žídek, A., Potapenko, A., et al. (2021) · Nature · doi:10.1038/s41586-021-03819-2 · Cited by 43,764
A guide to cancer immunotherapy: from T cell basic science to clinical practice
Waldman, A. D., Fritz, J. M., & Lenardo, M. J. (2020) · Nature Reviews Immunology · doi:10.1038/s41577-020-0306-5 · Cited by 4,154
Watson, J. L., Juergens, D., Bennett, N. R., Trippe, B. L., Yim, J., Eisenach, H. E., Ahern, W., Borst, A. J., Ragotte, R. J., Milles, L. F., et al. (2022) · doi:10.1101/2022.12.09.519842 · Cited by 2,369
Self-citationDe novo design of protein structure and function with RFdiffusion
Watson, J. L., Juergens, D., Bennett, N. R., Trippe, B. L., Yim, J., Eisenach, H. E., Ahern, W., Borst, A. J., Ragotte, R. J., Milles, L. F., et al. (2023) · Nature · doi:10.1038/s41586-023-06415-8 · Cited by 2,325
Self-citationRobust deep learning–based protein sequence design using ProteinMPNN
Dauparas, J., Anishchenko, I., Bennett, N., Bai, H., Ragotte, R. J., Milles, L. F., Wicky, B. I. M., Courbet, A., de Haas, R. J., Bethel, N., et al. (2022) · Science · doi:10.1126/science.add2187 · Cited by 2,210
Self-citationRobust deep learning based protein sequence design using ProteinMPNN
Dauparas, J., Anishchenko, I., Bennett, N., Bai, H., Ragotte, R. J., Milles, L. F., Wicky, B. I. M., Courbet, A., de Haas, R. J., Bethel, N., et al. (2022) · doi:10.1101/2022.06.03.494563 · Cited by 2,107
Self-citationThe Rosetta All-Atom Energy Function for Macromolecular Modeling and Design
Alford, R. F., Leaver-Fay, A., Jeliazkov, J. R., O’Meara, M. J., DiMaio, F. P., Park, H., Shapovalov, M. V., Renfrew, P. D., Mulligan, V. K., Kappel, K., et al. (2017) · Journal of Chemical Theory and Computation · doi:10.1021/acs.jctc.7b00125 · Cited by 1,532
Self-citationTGFβ biology in cancer progression and immunotherapy
Derynck, R., Turley, S. J., & Akhurst, R. J. (2021) · Nature Reviews Clinical Oncology · doi:10.1038/s41571-020-0403-1 · Cited by 944
De novo design of potent and selective mimics of IL-2 and IL-15
Silva, D.-A., Yu, S., Ulge, U. Y., Spangler, J. B., Jude, K. M., Labão-Almeida, C., Ali, L. R., Quijano-Rubio, A., Ruterbusch, M., Leung, I., et al. (2019) · Nature · doi:10.1038/s41586-018-0830-7 · Cited by 531
Self-citationScaffolding protein functional sites using deep learning
Wang, J., Lisanza, S., Juergens, D., Tischer, D., Watson, J. L., Castro, K. M., Ragotte, R., Saragovi, A., Milles, L. F., Baek, M., et al. (2022) · Science · doi:10.1126/science.abn2100 · Cited by 487
Self-citationMassively parallel de novo protein design for targeted therapeutics
Chevalier, A., Silva, D.-A., Rocklin, G. J., Hicks, D. R., Vergara, R., Murapa, P., Bernard, S. M., Zhang, L., Lam, K.-H., Yao, G., et al. (2017) · Nature · doi:10.1038/nature23912 · Cited by 453 · cited 2×
“We used the RIF-based docking protocol of Cao et al 6 to dock both the 5HCS scaffolds described above and the globularmini proteinscaffold library used in the previous studies 5,23 to the binding site of transforming growth factor-β 3 (TGF-β 3) on the TGF-β receptor type-2 (TGF β RII) 24 (Fig.1a).”
Self-citation
Research works printed but not linked: 47
- Strzelec, M., Detka, J., Mieszczak, P., Sobocińska, M. K. & Majka, M. Immunomodulation—a general review of the current state-of-the-art and new therapeutic strategies for targeting the immune system. Front. Immunol. 14, https://doi.org/10.3389/fimmu.2023.1127704 (2023). · DOI
- Johnson, D. B., Nebhan, C. A., Moslehi, J. J. & Balko, J. M. Immune-checkpoint inhibitors: long-term implications of toxicity. Nat. Rev. Clin. Oncol. 19, 254–267 (2022). · DOI · Paper page
- Wang, D.-R., Wu, X.-L. & Sun, Y.-L. Therapeutic targets and biomarkers of tumor immunotherapy: response versus non-response. Signal Transduct. Target. Ther. 7, 1–27 (2022). · DOI
- Cao, L. et al. Design of protein-binding proteins from the target structure alone. Nature 605, 551–560 (2022). · DOI · Paper page
- Bennett, N. R. et al. Improving de novo protein binder design with deep learning. Nat. Commun. 14, 2625 (2023). · DOI · Paper page
- Zhang, J. Z. et al. Thermodynamically coupled biosensors for detecting neutralizing antibodies against SARS-CoV-2 variants. Nat. Biotechnol. 40, 1336–1340 (2022). · DOI
- Sahtoe, D. D. et al. Reconfigurable asymmetric protein assemblies through implicit negative design. Science 375, eabj7662 (2022). · DOI
- Yang, E. C. et al. Computational design of non-porous pH-responsive antibody nanoparticles. Nat. Struct. Mol. Biol. 31, 1404–1412 (2024). · DOI
- Pillai, A. et al. De novo design of allosterically switchable protein assemblies. Nature 632, 911–920 (2024). · DOI
- Cannon, J. P. et al. Recognition of additional roles for immunoglobulin domains in immune function. Semin. Immunol. 22, 17–24 (2010). · DOI
- Brady, G. P. & Sharp, K. A. Entropy in protein folding and in protein—protein interactions. Curr. Opin. Struct. Biol. 7, 215–221 (1997). · DOI
- Béhar, G. et al. Tolerance of the archaeal Sac7d scaffold protein to alternative library designs: characterization of anti-immunoglobulin G Affitins. Protein Eng. Des. Sel. 26, 267–275 (2013). · DOI
- Vazquez-Lombardi, R. et al. Challenges and opportunities for non-antibody scaffold drugs. Drug Discov. Today 20, 1271–1283 (2015). · DOI
- Brunette, T. J. et al. Exploring the repeat protein universe through computational protein design. Nature 528, 580–584 (2015). · DOI
- Hicks, D. R. et al. De novo design of protein homodimers containing tunable symmetric protein pockets. Proc. Natl. Acad. Sci. USA 119, e2113400119 (2022). · DOI
- Hiranuma, N. et al. Improved protein structure refinement guided by deep learning based accuracy estimation. Nat. Commun. 12, 1340 (2021). · DOI · Paper page
- Rocklin, G. J. et al. Global analysis of protein folding using massively parallel design, synthesis, and testing. Science 357, 168–175 (2017). · DOI · Paper page
- Hart, P. J. et al. Crystal structure of the human TbetaR2 ectodomain-TGF-beta3 complex. Nat. Struct. Biol. 9, 203–208 (2002).
- Wojtukiewicz, M. Z. et al. Inhibitors of immune checkpoints—PD-1, PD-L1, CTLA-4—new opportunities for cancer patients and a new challenge for internists and general practitioners. Cancer Metastasis Rev. 40, 949–982 (2021). · DOI
- He, M. et al. Remarkably similar CTLA-4 binding properties of therapeutic ipilimumab and tremelimumab antibodies. Oncotarget 8, 67129–67139 (2017). · DOI
- Edman, N. I. et al. Modulation of FGF pathway signaling and vascular differentiation using designed oligomeric assemblies. Cell 187, 3726–3740 (2024). · DOI
- Case, J. B. et al. Ultrapotent miniproteins targeting the SARS-CoV-2 receptor-binding domain protect against infection and disease. Cell Host Microbe 29, 1151–1161 (2021). · DOI · Paper page
- Tries, R. S. et al. Gdf-8 Propeptide binds to GDF-8 and antagonizes biological activity by inhibiting GDF-8 receptor binding. Growth Factors 18, 251–259 (2001). · DOI
- Kim, S. K. et al. An engineered transforming growth factor β (TGF-β) monomer that functions as a dominant negative to block TGF-β signaling. J. Biol. Chem. 292, 7173–7188 (2017). · DOI · Paper page
- Evans, P. Scaling and assessment of data quality. Acta Crystallogr. D Biol. Crystallogr. 62, 72–82 (2006). · DOI
- Evans, P. R. & Murshudov, G. N. How good are my data and what is the resolution? Acta Crystallogr. D Biol. Crystallogr. 69, 1204–1214 (2013). · DOI
- Zwart, P. H. Anomalous signal indicators in protein crystallography. Acta Crystallogr. D Biol. Crystallogr. 61, 1437–1448 (2005). · DOI
- Yeates, T. O. Simple statistics for intensity data from twinned specimens. Acta Crystallogr. A 44, 142–144 (1988). · DOI
- Padilla, J. E. & Yeates, T. O. A statistic for local intensity differences: robustness to anisotropy and pseudo-centering and utility for detecting twinning. Acta Crystallogr. D Biol. Crystallogr. 59, 1124–1130 (2003). · DOI
- French, S. & Wilson, K. On the treatment of negative intensity observations. Acta Crystallogr. A 34, 517–525 (1978). · DOI
- Dauter, Z. Estimation of anomalous signal in diffraction data. Acta Crystallogr. D Biol. Crystallogr. 62, 867–876 (2006). · DOI
- Winn, M. D. et al. Overview of the CCP4 suite and current developments. Acta Crystallogr. D Biol. Crystallogr. 67, 235–242 (2011). · DOI · Paper page
- McCoy, A. J. et al. Phaser crystallographic software. J. Appl. Crystallogr. 40, 658–674 (2007). · DOI · Paper page
- Murshudov, G. N., Vagin, A. A. & Dodson, E. J. Refinement of macromolecular structures by the maximum-likelihood method. Acta Crystallogr. D Biol. Crystallogr. 53, 240–255 (1997). · DOI
- Pannu, N. S., Murshudov, G. N., Dodson, E. J. & Read, R. J. Incorporation of prior phase information strengthens maximum-likelihood structure refinement. Acta Crystallogr. D Biol. Crystallogr. 54, 1285–1294 (1998). · DOI
- Murshudov, G. N., Vagin, A. A., Lebedev, A., Wilson, K. S. & Dodson, E. J. Efficient anisotropic refinement of macromolecular structures using FFT. Acta Crystallogr. D Biol. Crystallogr. 55, 247–255 (1999). · DOI
- Winn, M. D., Isupov, M. N. & Murshudov, G. N. Use of TLS parameters to model anisotropic displacements in macromolecular refinement. Acta Crystallogr. D Biol. Crystallogr. 57, 122–133 (2001). · DOI
- Steiner, R. A., Lebedev, A. A. & Murshudov, G. N. Fisher’s information in maximum-likelihood macromolecular crystallographic refinement. Acta Crystallogr. D Biol. Crystallogr. 59, 2114–2124 (2003). · DOI
- Winn, M. D., Murshudov, G. N. & Papiz, M. Z. in Methods in Enzymology vol. 374 300–321 (Academic Press, 2003). · DOI
- Skubák, P., Murshudov, G. N. & Pannu, N. S. Direct incorporation of experimental phase information in model refinement. Acta Crystallogr. D Biol. Crystallogr. 60, 2196–2201 (2004). · DOI
- Vagin, A. A. et al. REFMAC5 dictionary: organization of prior chemical knowledge and guidelines for its use. Acta Crystallogr. D Biol. Crystallogr. 60, 2184–2195 (2004). · DOI
- Emsley, P., Lohkamp, B., Scott, W. G. & Cowtan, K. Features and development of Coot. Acta Crystallogr. D Biol. Crystallogr. 66, 486–501 (2010). · DOI · Paper page
- Battye, T. G. G., Kontogiannis, L., Johnson, O., Powell, H. R. & Leslie, A. G. W. iMOSFLM: a new graphical interface for diffraction-image processing with MOSFLM. Acta Crystallogr. D Biol. Crystallogr. 67, 271–281 (2011). · DOI
- Kabsch, W. XDS. Acta Crystallogr. D Biol. Crystallogr. 66, 125–132 (2010). · DOI · Paper page
- Liebschner, D. et al. Macromolecular structure determination using X-rays, neutrons and electrons: recent developments in Phenix. Acta Crystallogr. Sect. Struct. Biol. 75, 861–877 (2019). · DOI · Paper page
- Chen, V. B. et al. MolProbity: all-atom structure validation for macromolecular crystallography. Acta Crystallogr. D Biol. Crystallogr. 66, 12–21 (2010). · DOI · Paper page
- Ramachandran, G. N., Ramakrishnan, C. & Sasisekharan, V. Stereochemistry of polypeptide chain configurations. J. Mol. Biol. 7, 95–99 (1963). · DOI
Cited by
Sorted by citations
Sheng, J., Yuan, W., Zhang, M., Chen, Z., Qi, Y., Zhao, Y., & Zhang, S. (2026) · Journal of Nanobiotechnology · doi:10.1186/s12951-026-04028-7 · Cited by 35
Chen, Y., Nguyen, L. B. T., Zhong, Q.-Z., Tan, E. X., Wang, L., Phang, I. Y., Lv, Y., & Ling, X. Y. (2026) · ACS Applied Materials & Interfaces · doi:10.1021/acsami.6c01066
Metadata
- Authors
- Yang, W., Hicks, D. R., Ghosh, A., Schwartze, T. A., Conventry, B., Goreshnik, I., Allen, A., Halabiya, S. F., Kim, C. J., Hinck, C. S., Lee, D. S., Bera, A. K., Li, Z., Wang, Y., Schlichthaerle, T., Cao, L., Huang, B., Garrett, S., Gerben, S. R., Rettie, S., Heine, P., Murray, A., Edman, N., Carter, L., Stewart, L., Almo, S. C., Hinck, A. P., & Baker, D.
- Venue
- Nature Communications
- Published
- 2025-02-26
- Volume
- 16
- Issue
- 1
- ISSN
- 2041-1723
- PMC
- PMC11865580
- Cited by
- 40
- References
- 11
- Language
- en
- Funders
- U.S. Department of Health & Human Services | NIH | National Institute on Aging (R01AG063845, U19AG065156)
- United States Department of Defense | Defense Advanced Research Projects Agency (HR001120S0052, HR001117S0003)
- Gates Ventures;Audacious Project;Open Philanthropy Project Improving Protein Design Fund;Howard Hughes Medical Institute
About these checks
Registry, retraction, Cites and statistics results are computed, not judged, with one exception: a printed reference that no index lists is read once by a model before it counts as a citation error. Claims are extracted by a model and kept only when their quote appears verbatim in the text; each cited source is then checked, with a model’s help, for whether it says what the claim relies on. Those verdicts can be wrong — read the claim’s quote and the cited source before relying on one.
Statistics and arithmetic are recomputed, not judged.
Confidence bands are shown only for fields calibrated on our annotated test set. None is calibrated yet, so no band is shown.
What counts as a claim ›How we measure confidence ›How we check this ›
Are you an author, or do you see a problem with this page? Request a review
