

The DOI matches its Crossref record; 10 of the 10 references it cites were found in a registry or an index.
Pupil size reveals arousal level fluctuations in human sleep
Published version of a preprint
Abstract
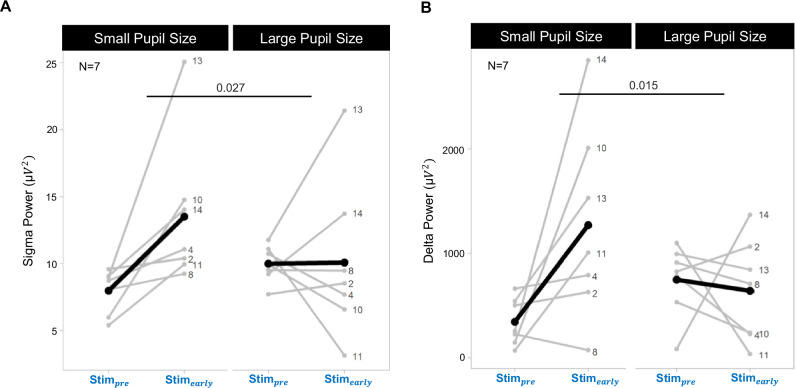
Recent animal research has revealed the intricate dynamics of arousal levels that are important for maintaining proper sleep resilience and memory consolidation. In humans, changes in arousal level are believed to be a determining characteristic of healthy and pathological sleep but tracking arousal level fluctuations has been methodologically challenging. Here we measured pupil size, an established indicator of arousal levels, by safely taping the right eye open during overnight sleep and tested whether pupil size affects cortical response to auditory stimulation. We show that pupil size dynamics change as a function of important sleep events across different temporal scales. In particular, our results show pupil size to be inversely related to the occurrence of sleep spindle clusters, a marker of sleep resilience. Additionally, we found pupil size prior to auditory stimulation to influence the evoked response, most notably in delta power, a marker of several restorative and regenerative functions of sleep. Recording pupil size dynamics provides insights into the interplay between arousal levels and sleep oscillations.
Overview
The claims and statistics of this paper haven’t been checked yet.
Run the check — free, no account needed. It reads the open-access text and checks the sources it cites.
Integrity signals
Registry
Cites
Statistics
Figures
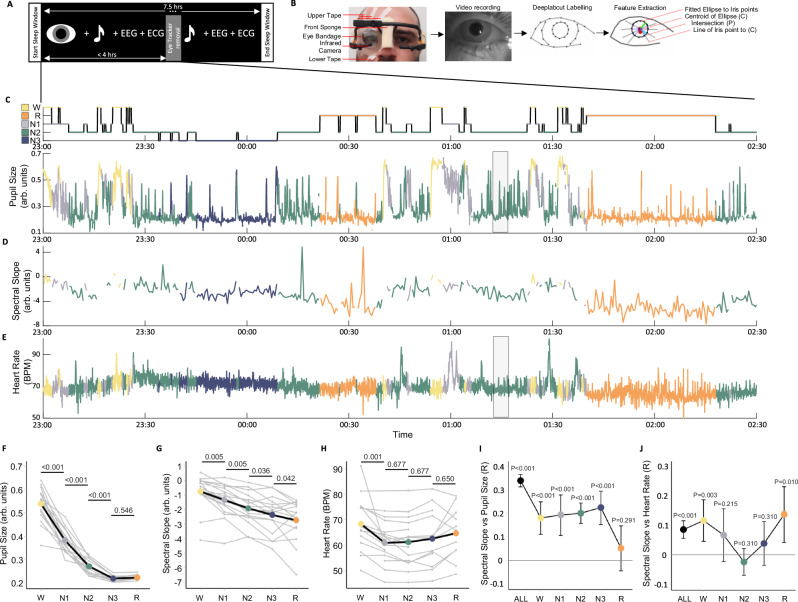
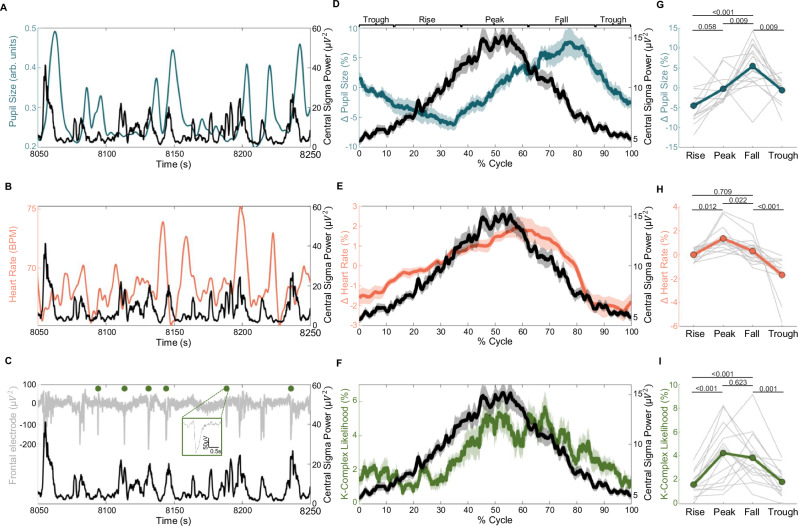
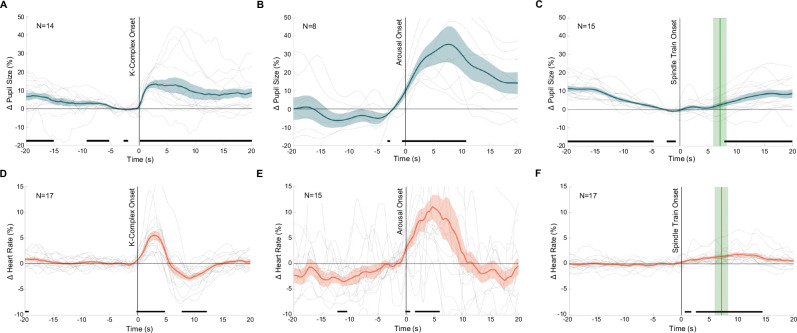
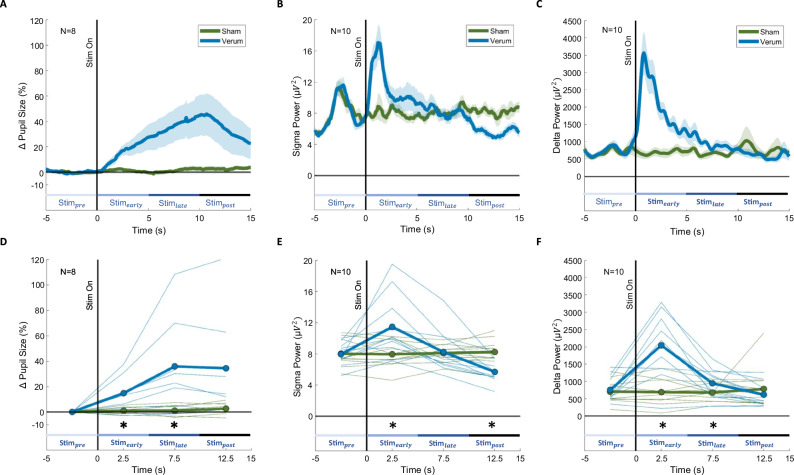
Verification
Claims the paper makes
The claims and statistics of this paper haven’t been checked yet.
Run the check — free, no account needed. It reads the open-access text and checks the sources it cites.
Claims other papers make about this one
Each is checked against this paper’s own text: does it say what the citing paper says it does?
In the citing paper
“the pupil size, which is controlled by NE110 exhibit fluctuations that are anticorrelated with sleep spindles in the same frequency range in humans111.”
From Norepinephrine-mediated slow vasomotion drives glymphatic clearance during sleep (2025) · cites this paper as [111]
Self-check
Percentages, sums and reported differences re-computed from the paper’s own numbers.
The self-check needs the paper’s full text.
Citations
Cites
Khalifa, A. A. Z., Ichikawa, M., Dai, D., Kubo, S., Black, C. S., Peri, K., McAlear, T. S., Veyron, S., Yang, S. K., Vargas, J., et al. (2020) · eLife · doi:10.7554/elife.52760 · Cited by 1,676
Pupil fluctuations track rapid changes in adrenergic and cholinergic activity in cortex
Reimer, J., McGinley, M. J., Liu, Y., Rodenkirch, C., Wang, Q., McCormick, D. A., & Tolias, A. S. (2016) · Nature Communications · doi:10.1038/ncomms13289 · Cited by 926
Renard, Y., Lotte, F., Gibert, G., Congedo, M., Maby, E., Delannoy, V., Bertrand, O., & Lécuyer, A. (2010) · Presence: Teleoperators and Virtual Environments · doi:10.1162/pres.19.1.35 · Cited by 830
Pupil diameter covaries with BOLD activity in human locus coeruleus
Murphy, P. R., O'Connell, R. G., O'Sullivan, M., Robertson, I. H., & Balsters, J. H. (2014) · Human Brain Mapping · doi:10.1002/hbm.22466 · Cited by 819
Waking state: rapid variations modulate neural and behavioral responses
McGinley, M. J., Vinck, M., Reimer, J., Batista-Brito, R., Zagha, E., Cadwell, C. R., Tolias, A. S., Cardin, J. A., & McCormick, D. A. (2015) · Neuron · doi:10.1016/j.neuron.2015.09.012 · Cited by 801
Cortical membrane potential signature of optimal states for sensory signal detection
McGinley, M. J., David, S. V., & McCormick, D. A. (2015) · Neuron · doi:10.1016/j.neuron.2015.05.038 · Cited by 728
Lecci, S., Fernandez, L. M. J., Weber, F. D., Cardis, R., Chatton, J.-Y., Born, J., & Lüthi, A. (2017) · Science Advances · doi:10.1126/sciadv.1602026 · Cited by 242
Self-citationEschenko, O., Magri, C., Panzeri, S., & Sara, S. J. (2012) · Cerebral Cortex · doi:10.1093/cercor/bhr121 · Cited by 194
Siclari, F., Bernardi, G., Riedner, B. A., LaRocque, J. J., Benca, R. M., & Tononi, G. (2014) · Sleep · doi:10.5665/sleep.4070 · Cited by 181
Swift, K. M., Gross, B. A., Frazer, M. A., Bauer, D. S., Clark, K. J. D., Vazey, E. M., Aston-Jones, G., Li, Y., Pickering, A. E., Sara, S. J., et al. (2018) · Current Biology · doi:10.1016/j.cub.2018.09.054 · Cited by 158
Research works printed but not linked: 84
- Poe, G. R. et al. Locus coeruleus: a new look at the blue spot. Nat. Rev. Neurosci. 21, 644–659 (2020). · DOI · Paper page
- Osorio-Forero, A., Cherrad, N., Banterle, L., Fernandez, L. M. J. & Lüthi, A. When the Locus Coeruleus speaks up in sleep: recent insights, emerging perspectives. Int. J. Mol. Sci. 23. https://doi.org/10.3390/ijms23095028 (2022). · DOI
- Aston-Jones, G. & Cohen, J. D. An integrative theory of locus coeruleus-norepinephrine function: adaptive gain and optimal performance. Annu. Rev. Neurosci. 28, 403–450 (2005). · DOI · Paper page
- Jones, B. E. Activity, modulation and role of basal forebrain cholinergic neurons innervating the cerebral cortex. Prog. Brain Res. 145, 157–169 (2004). · DOI
- Jones, B. E. Arousal systems. Front. Biosci. 8, 438–451 (2003). · DOI
- de Lecea, L. et al. The hypocretins: hypothalamus-specific peptides with neuroexcitatory activity. Proc. Natl Acad. Sci. USA 95, 322–327 (1998). · DOI · Paper page
- Cazettes, F., Reato, D., Morais, J. P., Renart, A. & Mainen Z. F. Phasic activation of dorsal raphe serotonergic neurons increases pupil size. Curr. Biol. 192–197. https://doi.org/10.1016/j.cub.2020.09.090 (2020). · DOI
- Grujic, N., Tesmer, A., Bracey, E., Peleg-Raibstein, D. & Burdakov D. Control and coding of pupil size by hypothalamic orexin neurons. Nat. Neurosci. 26, 1160–1164 (2023). · DOI
- Xu, Y. L. et al. Neuropeptide S: a neuropeptide promoting arousal and anxiolytic-like effects. Neuron 43, 487–497 (2004). · DOI
- Jodoj, E., Chiang, C. & Aston-Jones, G. Potent excitatory influence of prefrontal cortex activity on noradrenergic locus coeruleus neurons. Neuroscience 83, 63–79 (1998). · DOI · Paper page
- Dorr, A. E. & Debonnel, G. Effect of vagus nerve stimulation on serotonergic and noradrenergic transmission. J. Pharmacol. Exp. Therap. 318, 890–898 (2006). · DOI · Paper page
- Halász, P., Terzano, M., Parrino, L. & Bódizs R. The nature of arousal in sleep. J Sleep Res. 13:1–23. https://doi.org/10.1111/J.1365-2869.2004.00388.X (2004). · DOI
- Halász, P. The K-complex as a special reactive sleep slow wave-a theoretical update. Sleep. Med Rev. 29, 34–40 (2016). · DOI
- Osorio-Forero, A. et al. Noradrenergic circuit control of non-REM sleep substates. Curr. Biol. 31, 5009–5023.e7 (2021). · DOI · Paper page
- Iber, C., Ancoli-Israel, S., Chesson, A. L. & Quan, S. F. The AASM Manual for the Scoring of Sleep and Associated Events (October 2012) 1–17 (American Academy of Sleep Medicine, Westchester, 2007) · DOI
- Kjaerby, C. et al. Memory-enhancing properties of sleep depend on the oscillatory amplitude of norepinephrine. Nat Neurosci. 25(August). https://doi.org/10.1038/s41593-022-01102-9 (2022). · DOI · Paper page
- Yüzgeç, Ö., Prsa, M., Zimmermann, R. & Huber, D. Pupil size coupling to cortical states protects the stability of deep sleep via parasympathetic modulation. Curr. Biol. 28, 392–400.e3 (2018). · DOI
- Lázár, Z. I., Dijk, D. J. & Lázár, A. S. Infraslow oscillations in human sleep spindle activity. J. Neurosci. Methods. 316, 22–34 (2019). · DOI · Paper page
- Joshi, S. & Gold, J. I. Pupil size as a window on neural substrates of cognition. Trends Cogn. Sci. 24, 466–480 (2020). · DOI
- Zerbi, V. et al. Rapid reconfiguration of the functional connectome after chemogenetic locus coeruleus activation article rapid reconfiguration of the functional connectome after chemogenetic locus coeruleus activation. Neuron 103, 702–718 (2019). · DOI
- Megemont, M., McBurney-Lin, J. & Yang, H. Pupil diameter is not an accurate real-time readout of locus coeruleus activity. Elife 11, e70510 (2022). · DOI
- Hayat, H. et al. Locus coeruleus norepinephrine activity mediates sensory-evoked awakenings from sleep. Sci. Adv. 6, https://doi.org/10.1126/sciadv.aaz4232 (2020). · DOI
- Alnæs, D. et al. Pupil size signals mental effort deployed during multiple object tracking and predicts brain activity in the dorsal attention network and the locus coeruleus. J, Vis. 14, 1 (2014). · DOI
- de Gee, J. W. et al. Dynamic modulation of decision biases by brainstem arousal systems. Elife 6. https://doi.org/10.7554/ELIFE.23232 (2017). · DOI
- Oswald, I. Falling asleep open-eyed during intense rhythmic stimulation. Br. Med J. 1, 1450–1455 (1960). · DOI
- McNab, A. A. The eye and sleep. Clin. Exp. Ophthalmol. 33, 117–125 (2005). · DOI
- Weygandt Mathis, M. & Bethge, M. DeepLabCut: markerless pose estimation of user-defined body parts with deep learning. Nat. Neurosci. https://doi.org/10.1038/s41593-018-0209-y. · DOI · Paper page
- Nath, T. et al. Using DeepLabCut for 3D markerless pose estimation across species and behaviors. Nat. Protoc. 14, 2152–2176 (2019). · DOI
- Lendner, J. D. et al. An electrophysiological marker of arousal level in humans. Elife 9, 1–29 (2020). · DOI
- Höhn, C., Hahn, M. A., Lendner, J. D. & Hoedlmoser, K. Spectral slope and Lempel-Ziv complexity as robust markers of brain states during sleep and wakefulness. eNeuro 11 (2024). · DOI
- Joshi, S., Li, Y., Kalwani, R. M. & Gold, J. I. Relationships between pupil diameter and neuronal activity in the locus coeruleus, colliculi, and cingulate cortex. Neuron 89, 221–234 (2016). · DOI · Paper page
- Kobayashi, G., Tanaka, K. F. & Takata, N. Pupil dynamics-derived sleep stage classification of a head-fixed mouse using a recurrent neural network. Keio J. Med. 72, 44–59 (2023). · DOI
- Tsunematsu, T., Patel, A. A., Onken, A. & Sakata, S. State-dependent brainstem ensemble dynamics and their interactions with hippocampus across sleep states. Elife 9, 1–22 (2020). · DOI
- Gao. R., Peterson E. J. & Voytek, B. Inferring synaptic excitation/inhibition balance from field potentials. Published online. https://doi.org/10.1016/j.neuroimage.2017.06.078 (2017). · DOI
- Bódizs, R. et al. A set of composite, non-redundant EEG measures of NREM sleep based on the power law scaling of the Fourier spectrum. Sci. Rep. 11, 1–18 (2021). · DOI
- Miskovic, V., Macdonald, K. J., Rhodes, J. L. & Cote, K. A. Changes in EEG multiscale entropy and power-law frequency scaling during the human sleep cycle. Published online. https://doi.org/10.1002/hbm.24393 (2018). · DOI
- Antony, J. W. et al. Sleep spindle refractoriness segregates periods of memory reactivation. Curr. Biol. 28, 1736–1743.e4 (2018). · DOI · Paper page
- Bernardi, G. et al. Local and widespread slow waves in stable NREM sleep: evidence for distinct regulation mechanisms. Published online. https://doi.org/10.3389/fnhum.2018.00248 (2018). · DOI
- Cardis, R. et al. Cortico-autonomic local arousals and heightened somatosensory arousability during NREMS of mice in neuropathic pain. Elife 10, 1–27 (2021). · DOI
- Sforza, E., Jouny, C. & Ibanez, V. Cardiac activation during arousal in humans: further evidence for hierarchy in the arousal response. https://doi.org/10.1016/s1388-2457(00)00363-1 (2000). · DOI
- de Zambotti, M. et al. K-complexes: interaction between the central and autonomic nervous systems during sleep. Sleep 39, 1129–1137 (2016). · DOI
- Scoring, E. A. EEG arousals: scoring rules and examples: a preliminary report from the sleep disorders atlas task force of the American Sleep Disorders Association. Sleep 15, 174–184 (1992). · DOI
- Pfeffer, T. et al. Coupling of pupil-and neuronal population dynamics reveals diverse influences of arousal on cortical processing. Elife 11, e71890 (2022). · DOI
- Boutin A., Doyon J. A sleep spindle framework for motor memory consolidation. Philos.Trans. R. Soc. B Biol. Sci. 375. https://doi.org/10.1098/rstb.2019.0232 (2020). · DOI
- Ngo, H. V., Martinetz, T., Born, J. & Molle, M. Auditory closed-loop stimulation of the sleep slow oscillation enhances memory. Neuron. https://doi.org/10.1016/j.neuron.2013.03.006 (2013). · DOI · Paper page
- Ngo, H. V. V., Seibold, M., Boche, D. C., Mölle, M. & Born, J. Insights on auditory closed-loop stimulation targeting sleep spindles in slow oscillation up-states. J. Neurosci. Methods 316, 117–124 (2019). · DOI
- Osorio-Forero, A. et al. Infraslow noradrenergic locus coeruleus activity fluctuations are gatekeepers of the NREM–REM sleep cycle. Nat. Neurosci. 28, 84–96 (2025). · DOI
- Naji, M., Krishnan, G. P., McDevitt, E. A., Bazhenov, M. & Mednick, S. C. Coupling of autonomic and central events during sleep benefits declarative memory consolidation. Neurobiol. Learn Mem. 157, 139–150 (2019). · DOI
- Boutin, A. et al. Temporal cluster-based organization of sleep spindles underlies motor memory consolidation. Proc. R. Soc. B. 291, https://doi.org/10.1098/rspb.2023.1408 (2024). · DOI
- Huwiler, S. et al. Effects of auditory sleep modulation approaches on brain oscillatory and cardiovascular dynamics. Sleep zsac155. https://doi.org/10.1093/sleep/zsac155 (2022). · DOI
- Besedovsky, L. et al. Auditory closed-loop stimulation of EEG slow oscillations strengthens sleep and signs of its immune-supportive function. Nat. Commun. 8, 1984 (2017). · DOI · Paper page
- Krugliakova, E. et al. Boosting recovery during sleep. auditory stimulation. Front. Neurosci. 16, 755958 (2022). · DOI
- Leminen, M. M. et al. Enhanced memory consolidation via automatic sound stimulation during non-REM sleep. Sleep 40, zsx003 (2017). · DOI
- Lustenberger, C. et al. Auditory deep sleep stimulation in older adults at home: a randomized crossover trial. Commun. Med. 2, 30 (2022). · DOI
- Weigenand, A., Mölle, M., Werner, F., Martinetz, T. & Marshall, L. Timing matters: open-loop stimulation does not improve overnight consolidation of word pairs in humans. Eur. J. Neurosci. 44, 2357–2368 (2016). · DOI
- Grimaldi, D. et al. Strengthening sleep-autonomic interaction via acoustic enhancement of slow oscillations. Sleep. 1–11. https://doi.org/10.1093/sleep/zsz036 (2019). · DOI
- Bellesi, M., Riedner, B. A., Garcia-Molina, G. N., Cirelli, C. & Tononi, G. Enhancement of sleep slow waves: underlying mechanisms and practical consequences. Front. Syst. Neurosci. 8, 1–17 (2014). · DOI · Paper page
- Colrain, I. M. The K-complex: a 7-decade history review. Sleep 28, 255 (2005). · DOI
- Neves, R. M., van Keulen, S., Yang, M., Logothetis, N. K. & Eschenko, O. Locus coeruleus phasic discharge is essential for stimulus-induced gamma oscillations in the prefrontal cortex. J. Neurophysiol. 119, 904–920 (2017). · DOI
- Kokkinos, V. & Kostopoulos, G. K. Human non-rapid eye movement stage II sleep spindles are blocked upon spontaneous K-complex coincidence and resume as higher frequency spindles afterwards. J. Sleep. Res. 20, 57–72 (2011). · DOI
- Lustenberger, C. et al. Auditory deep sleep stimulation in older adults at home: a randomized crossover trial. Commun. Med. 2, 1–16 (2022). · DOI
- Van Egroo, M., Koshmanova, E., Vandewalle, G. & Jacobs, H. I. L. Importance of the locus coeruleus-norepinephrine system in sleep-wake regulation: Implications for aging and Alzheimer’s disease. Sleep. Med. Rev. 62, 101592 (2022). · DOI
- Van Someren, E. J. W. Brain mechanisms of insomnia: new perspectives on causes and consequences. Physiol. Rev. 101, 995–1046 (2021). · DOI
- McCall, J. G. et al. CRH engagement of the locus coeruleus noradrenergic system mediates stress-induced anxiety. Neuron 87, 605–620 (2015). · DOI · Paper page
- Wood, C. S., Valentino, R. J. & Wood, S. K. Individual differences in the locus coeruleus-norepinephrine system: relevance to stress-induced cardiovascular vulnerability. Physiol. Behav. 172, 40–48 (2017). · DOI
- Ben Barak-Dror, O. et al. Touchless short-wave infrared imaging for dynamic rapid pupillometry and gaze estimation in closed eyes. Commun. Med. 4, 157 (2024). · DOI
- Schiffman, R. M., Christianson, M. D., Jacobsen, G., Hirsch, J. D. & Reis, B. L. Reliability and validity of the Ocular Surface Disease Index. Arch. Ophthalmol. 118, 615–621 (2000). · DOI
- Delorme, A. & Makeig, S. EEGLAB: an open source toolbox for analysis of single-trial EEG dynamics including independent component analysis. J. Neurosci. Methods 134, 9–21 (2004). · DOI · Paper page
- Vallat, R., Walker MP, P. & Walker, M. An open-source, high-performance tool for automated sleep staging. Elife 10, 1–24 (2021). · DOI
- Hill, S. L. et al. Visbrain: a multi-purpose GPU-accelerated open-source suite for multimodal brain data visualization. Front. Neuroinformat. | www.frontiersin.org. 1:14. https://doi.org/10.3389/fninf.2019.00014 (2019). · DOI
- Lustenberger, C., Wehrle, F., Tüshaus, L., Achermann, P. & Huber, R. The multidimensional aspects of sleep spindles and their relationship to word-pair memory consolidation. Sleep 38, 1093–1103 (2015). · DOI
- Prerau, M. J., Brown, R. E., Bianchi, M. T., Ellenbogen, J. M. & Purdon, P. L. Sleep neurophysiological dynamics through the lens of multitaper spectral analysis. Physiology 32, 60–92 (2017). · DOI
- Donoghue, T. et al. Parameterizing neural power spectra into periodic and aperiodic components. Nat. Neurosci. 23, 1655–1665 (2020). · DOI
- Lacourse, K., Yetton B., Mednick S. C. & Warby S. Massive online data annotation, crowdsourcing to generate high quality sleep spindle annotations from EEG data. Sci. Data 7, 190 (2020). · DOI
- Lacourse, K., Delfrate J., Beaudry J., Peppard P. & Warby S. C. A sleep spindle detection algorithm that emulates human expert spindle scoring. Published online. https://doi.org/10.1016/j.jneumeth.2018.08.014 (2018). · DOI
- Fernández-Varela I., Alvarez-Estevez D., Hernández-Pereira E. & Moret-Bonillo V. A simple and robust method for the automatic scoring of EEG arousals in polysomnographic recordings. https://doi.org/10.1016/j.compbiomed.2017.05.011 (2017). · DOI
- Alvarez-Estevez, D. & Fernández-Varela, I. Large-scale validation of an automatic EEG arousal detection algorithm using different heterogeneous databases. Published online. https://doi.org/10.1016/j.sleep.2019.01.025 (2019). · DOI
- Kret, M. E. & Sjak-Shie, E. E. Preprocessing pupil size data: guidelines and code. Behav. Res Methods 51, 1336–1342 (2019). · DOI
- Behar, J. A. et al. PhysioZoo: a novel open access platform for heart rate variability analysis of mammalian electrocardiographic data. Front. Physiol. 9, 01390 (2018) · DOI
- Ferster, M. L. et al. Benchmarking real-time algorithms for in-phase auditory stimulation of low amplitude slow waves with wearable EEG devices during sleep. IEEE Trans. Biomed. Eng. 69, 2916–2925 (2022). · DOI
- Bates, D., Mächler, M., Bolker, B. & Walker, S. Fitting linear mixed-effects models using {lme4}. J. Stat. Softw. 67, 1–48 (2015). · DOI · Paper page
- Kuznetsova, A., Brockhoff, P. B. & Christensen, R. H. B. {lmerTest} Package: tests in linear mixed effects models. J. Stat. Softw. 82, 1–26 (2017). · DOI · Paper page
- Bakdash, J. Z. & Marusich, L. R. Package ‘rmcorr’. Front. Psychol. 8, 456 (2017). · DOI
- Wickham H. Ggplot2: Elegant Graphics for Data Analysis. (Springer-Verlag, New York, 2016). · DOI
Cited by
Sorted by citations
Norepinephrine-mediated slow vasomotion drives glymphatic clearance during sleep
Hauglund, N. L., Andersen, M., Tokarska, K., Radovanovic, T., Kjaerby, C., Sørensen, F. L., Bojarowska, Z., Untiet, V., Ballestero, S. B., Kolmos, M. G., et al. (2025) · Cell · doi:10.1016/j.cell.2024.11.027 · Cited by 349
Metadata
- Authors
- Carro-Domínguez, M., Huwiler, S., Oberlin, S., Oesch, T. L., Badii, G., Lüthi, A., Wenderoth, N., Meissner, S. N., & Lustenberger, C.
- ORCID
- Venue
- Nature Communications
- Published
- 2025-02-28
- Volume
- 16
- Issue
- 1
- ISSN
- 2041-1723
- PMC
- PMC11871316
- Cited by
- 41
- References
- 10
- Language
- en
About these checks
Registry, retraction, Cites and statistics results are computed, not judged, with one exception: a printed reference that no index lists is read once by a model before it counts as a citation error. Claims are extracted by a model and kept only when their quote appears verbatim in the text; each cited source is then checked, with a model’s help, for whether it says what the claim relies on. Those verdicts can be wrong — read the claim’s quote and the cited source before relying on one.
Statistics and arithmetic are recomputed, not judged.
Confidence bands are shown only for fields calibrated on our annotated test set. None is calibrated yet, so no band is shown.
What counts as a claim ›How we measure confidence ›How we check this ›
Are you an author, or do you see a problem with this page? Request a review
