

The DOI matches its Crossref record; 8 of the 8 references it cites were found in a registry or an index.
TET2 deficiency increases the competitive advantage of hematopoietic stem and progenitor cells through upregulation of thrombopoietin receptor signaling
Published version of a preprint
Overview
The claims and statistics of this paper haven’t been checked yet.
Run the check — free, no account needed. It reads the open-access text and checks the sources it cites.
Integrity signals
Registry
Cites
Statistics
Figures
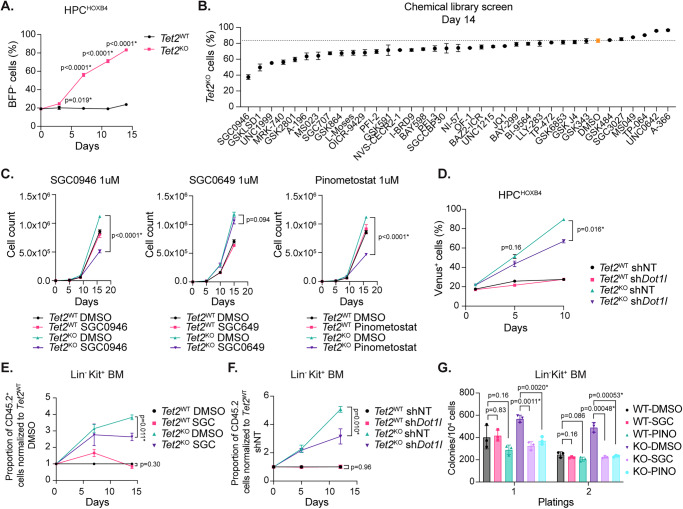
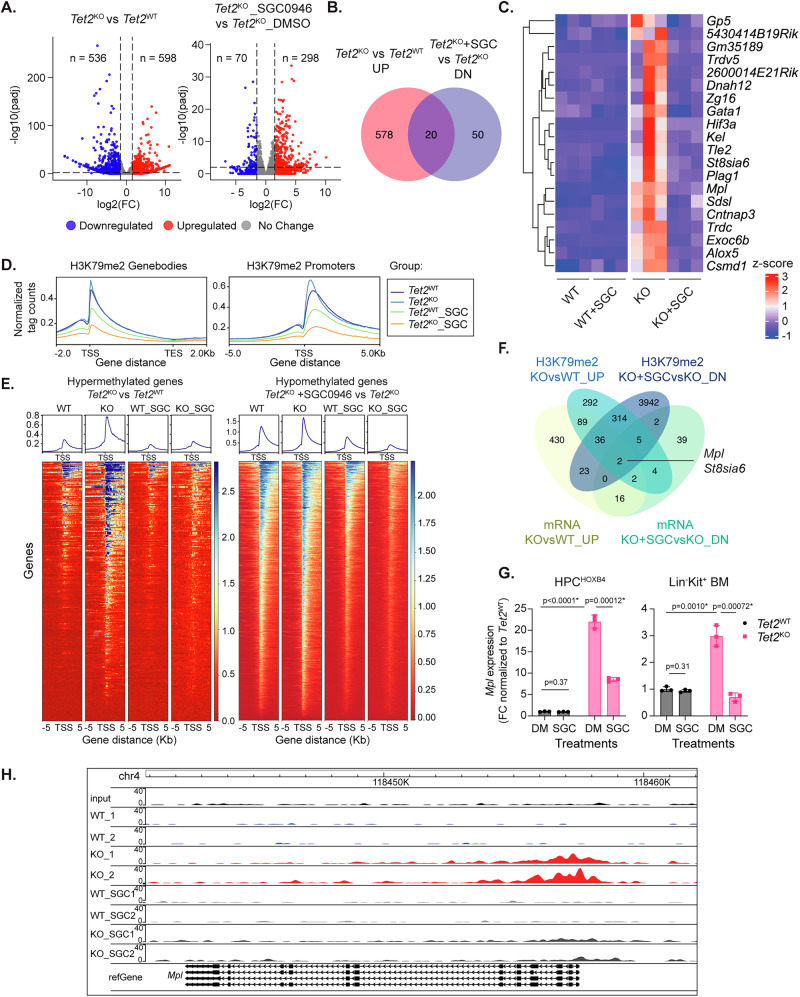
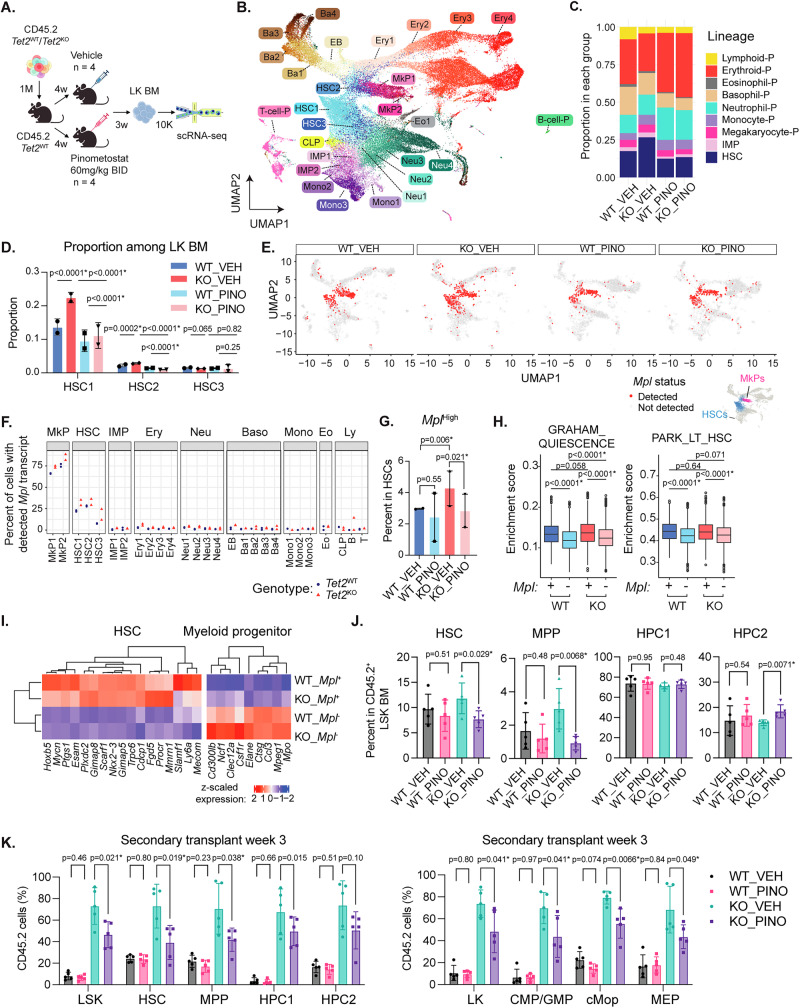
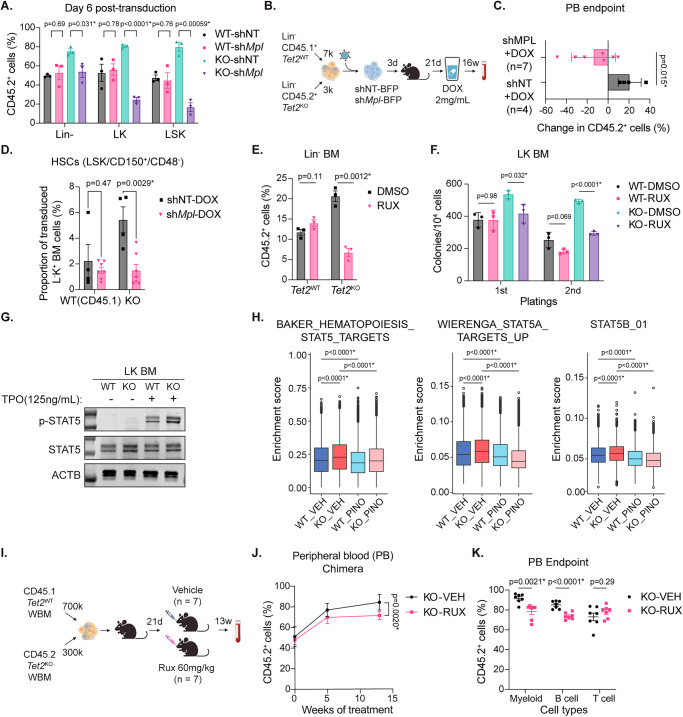
Verification
Claims the paper makes
The claims and statistics of this paper haven’t been checked yet.
Run the check — free, no account needed. It reads the open-access text and checks the sources it cites.
Claims other papers make about this one
Each is checked against this paper’s own text: does it say what the citing paper says it does?
In the citing paper
“Moreover, previous reports have provided global evidence for the competitive advantage of TET2-mutant clones (Yang et al, 2025), as well as DNMT3A, ASXL1 (Cooper & Young, 2017) and other hematological mutations in relation to non-mutant clones (Ferrando & Lopez-Otin, 2017;Watson et al, 2024)”
From A scalable in vitro cell competition model identifies preleukemic super competitor clones (2026) · cites this paper as Yang et al, 2025
Self-check
Percentages, sums and reported differences re-computed from the paper’s own numbers.
The self-check needs the paper’s full text.
Citations
Cites
Tet2 loss leads to increased hematopoietic stem cell self-renewal and myeloid transformation
Moran-Crusio, K., Reavie, L., Shih, A., Abdel-Wahab, O., Ndiaye-Lobry, D., Lobry, C., Figueroa, M. E., Vasanthakumar, A., Patel, J., Zhao, X., et al. (2011) · Cancer Cell · doi:10.1016/j.ccr.2011.06.001 · Cited by 1,339
Clonal hematopoiesis in human aging and disease
Jaiswal, S., & Ebert, B. L. (2019) · Science · doi:10.1126/science.aan4673 · Cited by 1,156 · cited 1×
“CHIP carriers are at a higher risk of developing hematologic malignancies and other age-related in fl ammatory illnesses such as cardiovascular diseases, relative to non-carriers 1,3,4 .”
Prediction of acute myeloid leukaemia risk in healthy individuals
Abelson, S., Collord, G., Ng, S. W. K., Weissbrod, O., Mendelson Cohen, N., Niemeyer, E., Barda, N., Zuzarte, P. C., Heisler, L., Sundaravadanam, Y., et al. (2018) · Nature · doi:10.1038/s41586-018-0317-6 · Cited by 850
Potent inhibition of DOT1L as treatment of MLL-fusion leukemia
Daigle, S. R., Olhava, E. J., Therkelsen, C. A., Basavapathruni, A., Jin, L., Boriack-Sjodin, P. A., Allain, C. J., Klaus, C. R., Raimondi, A., Scott, M. P., et al. (2013) · Blood · doi:10.1182/blood-2013-04-497644 · Cited by 722
Cai, Z., Kotzin, J. J., Ramdas, B., Chen, S., Nelanuthala, S., Palam, L. R., Pandey, R., Mali, R. S., Liu, Y., Kelley, M. R., et al. (2018) · Cell Stem Cell · doi:10.1016/j.stem.2018.10.013 · Cited by 394
Tet2 restrains inflammatory gene expression in macrophages
Cull, A. H., Snetsinger, B., Buckstein, R., Wells, R. A., & Rauh, M. J. (2017) · Experimental Hematology · doi:10.1016/j.exphem.2017.08.001 · Cited by 295
DNA methylation disruption reshapes the hematopoietic differentiation landscape
Izzo, F., Lee, S. C., Poran, A., Chaligne, R., Gaiti, F., Gross, B., Murali, R. R., Deochand, S. D., Ang, C., Jones, P. W., et al. (2020) · Nature Genetics · doi:10.1038/s41588-020-0595-4 · Cited by 236
Wang, Y., Sano, S., Yura, Y., Ke, Z., Sano, M., Oshima, K., Ogawa, H., Horitani, K., Min, K.-D., Miura-Yura, E., et al. (2020) · JCI Insight · doi:10.1172/jci.insight.135204 · Cited by 167
Research works printed but not linked: 71
- Steensma, D. P. et al. Clonal hematopoiesis of indeterminate potential and its distinction from myelodysplastic syndrome. Blood. https://doi.org/10.1182/blood-2015-03-631747 (2015). · DOI · Paper page
- Marnell, C. S., Bick, A. & Natarajan, P. Clonal hematopoiesis of indeterminate potential (CHIP): Linking somatic mutations, hematopoiesis, chronic inflammation and cardiovascular disease. J. Mol. Cell Cardiol. https://doi.org/10.1016/j.yjmcc.2021.07.004 (2021). · DOI
- Libby, P. et al. Clonal hematopoiesis: Crossroads of aging, cardiovascular disease, and cancer: JACC review topic of the week. J. Am. Coll. Cardiol. 74, 567–577 (2019). · DOI
- Ito, S. et al. Role of Tet proteins in 5mC to 5hmC conversion, ES cell self-renewal, and ICM specification. Nature 466, 1129 (2010). · DOI · Paper page
- Jaiswal, S. et al. Clonal hematopoiesis and risk of atherosclerotic cardiovascular disease. N. Engl. J. Med. 377, 111–121 (2017). · DOI · Paper page
- Genovese, G. et al. Clonal hematopoiesis and blood-cancer risk inferred from blood DNA sequence. N. Eng. J Med. https://doi.org/10.1056/nejmoa1409405 (2014). · DOI · Paper page
- Xie, M. et al. Age-related mutations associated with clonal hematopoietic expansion and malignancies. Nat Med. https://doi.org/10.1038/nm.3733 (2014). · DOI · Paper page
- Buscarlet, M. et al. Lineage restriction analyses in CHIP indicate myeloid bias for TET2 and multipotent stem cell origin for DNMT3A. Blood 132, 277–280 (2018). · DOI · Paper page
- He, Y. F. et al. Tet-mediated formation of 5-carboxylcytosine and its excision by TDG in mammalian DNA. Science. https://doi.org/10.1126/science.1210944 (2011). · DOI
- Ito, S. et al. Tet proteins can convert 5-methylcytosine to 5-formylcytosine and 5-carboxylcytosine. Science. https://doi.org/10.1126/science.1210597 (2011). · DOI · Paper page
- Quivoron, C. et al. TET2 inactivation results in pleiotropic hematopoietic abnormalities in mouse and is a recurrent event during human lymphomagenesis. Cancer Cell 20, 25–38 (2011). · DOI · Paper page
- Kunimoto, H. et al. Tet2 disruption leads to enhanced self-renewal and altered differentiation of fetal liver hematopoietic stem cells. Sci. Rep. 2, 1–10 (2012). · DOI
- Ko, M. et al. Ten-eleven-translocation 2 (TET2) negatively regulates homeostasis and differentiation of hematopoietic stem cells in mice. Proc. Natl Acad. Sci. USA 108, 14566–14571 (2011). · DOI · Paper page
- Sauvageau, G. et al. Overexpression of HOXB4 in hematopoietic cells causes the selective expansion of more primitive populations in vitro and in vivo. Genes Dev. 9, 1753–1765 (1995). · DOI
- Cusan, M. et al. Controlled stem cell amplification by HOXB4 depends on its unique proline-rich region near the N terminus. Blood. https://doi.org/10.1182/blood-2016-04-706978 (2017). · DOI
- Schiroli, G. et al. Cell of origin epigenetic priming determines susceptibility to Tet2 mutation. Nat. Commun. https://doi.org/10.1038/S41467-024-48508-6 (2024). · DOI
- Huerga Encabo, H. et al. Loss of TET2 in human hematopoietic stem cells alters the development and function of neutrophils. Cell Stem Cell 30, 781–799.e9 (2023). · DOI · Paper page
- Ackloo, S., Brown, P. J. & Müller, S. Chemical probes targeting epigenetic proteins: Applications beyond oncology. Epigenetics 12, 378–400 (2017). · DOI
- Yu, W. et al. Catalytic site remodelling of the DOT1L methyltransferase by selective inhibitors. Nat. Commun. 3, 1288 (2012). · DOI
- Stein, E. M. et al. The DOT1L inhibitor pinometostat reduces H3K79 methylation and has modest clinical activity in adult acute leukemia. Blood. https://doi.org/10.1182/blood-2017-12-818948 (2018). · DOI · Paper page
- Figueroa, M. E. et al. Leukemic IDH1 and IDH2 mutations result in a hypermethylation phenotype, disrupt TET2 function, and impair hematopoietic differentiation. Cancer Cell 18, 553–567 (2010). · DOI · Paper page
- Bernt, K. M. et al. MLL-rearranged leukemia is dependent on aberrant H3K79 methylation by DOT1L. Cancer Cell 20, 66–78 (2011). · DOI
- Cobo, I. et al. DNA methyltransferase 3 alpha and TET methylcytosine dioxygenase 2 restrain mitochondrial DNA-mediated interferon signaling in macrophages. Immunity 55, 1386–1401.e10 (2022). · DOI
- Koepp, D. M., Harper, J. W. & Elledge, S. J. How the cyclin became a cyclin: regulated proteolysis in. Cell cycle Cell 97, 431–434 (1999).
- Yokoyama, S., Takada, K., Hirasawa, M., Perera, L. P. & Hiroi, T. Transgenic mice that overexpress human IL-15 in enterocytes recapitulate both B and T cell-mediated pathologic manifestations of celiac disease. J. Clin. Immunol. 31, 1038–1044 (2011). · DOI
- Tanaka, T., Narazaki, M. & Kishimoto, T. IL-6 in inflammation, immunity, and disease. Cold Spring Harb. Perspect. Biol. https://doi.org/10.1101/CSHPERSPECT.A016295 (2014). · DOI · Paper page
- Nguyen, A. T. & Zhang, Y. The diverse functions of Dot1 and H3K79 methylation. Genes Dev. 25, 1345–1358 (2011). · DOI
- Vigon, I. et al. Molecular cloning and characterization of MPL, the human homolog of the v- mpl oncogene: Identification of a member of the hematopoietic growth factor receptor superfamily. Proc. Natl Acad. Sci. USA https://doi.org/10.1073/pnas.89.12.5640 (1992). · DOI
- Skoda, R. C. et al. Murine c-mpl: A member of the hematopoietic growth factor receptor superfamily that transduces a proliferative signal. EMBO J. https://doi.org/10.1002/j.1460-2075.1993.tb05925.x (1993). · DOI
- Takashima, S. et al. Molecular cloning and expression of a sixth type of alpha 2,8-sialyltransferase (ST8Sia VI) that sialylates O-glycans. J. Biol. Chem. 277, 24030–24038 (2002). · DOI
- Sitnicka, E. et al. The effect of thrombopoietin on the proliferation and differentiation of murine hematopoietic stem cells. Blood 87, 4998–5005 (1996). · DOI
- Yagi, M. et al. Sustained ex vivo expansion of hematopoietic stem cells mediated by thrombopoietin. Proc. Natl Acad. Sci. USA 96, 8126–8131 (1999). · DOI
- Fox, N., Priestley, G., Papayannopoulou, T. & Kaushansky, K. Thrombopoietin expands hematopoietic stem cells after transplantation. J. Clin. Invest 110, 389–394 (2002). · DOI
- Cano-Rodriguez, D. et al. Writing of H3K4Me3 overcomes epigenetic silencing in a sustained but context-dependent manner. Nat. Commun. 7, 12284 (2016). · DOI
- Katayamaa, N. et al. Role for C-MPL and its ligand thrombopoietin in early hematopoiesis. Leuk. Lymphoma 28, 51–56 (1997). · DOI
- Yoshihara, H. et al. Thrombopoietin/MPL signaling regulates hematopoietic stem cell quiescence and interaction with the osteoblastic niche. Cell Stem Cell 1, 685–697 (2007). · DOI
- Waters, N. J. et al. Exploring drug delivery for the DOT1L inhibitor pinometostat (EPZ-5676): Subcutaneous administration as an alternative to continuous IV infusion, in the pursuit of an epigenetic target. J. Controlled Release 220, 758–765 (2015). · DOI
- Satija, R., Farrell, J. A., Gennert, D., Schier, A. F. & Regev, A. Spatial reconstruction of single-cell gene expression data. Nat. Biotechnol. 33, 495–502 (2015). · DOI · Paper page
- Paul, F. et al. Transcriptional heterogeneity and lineage commitment in myeloid progenitors. Cell 163, 1663–1677 (2015). · DOI · Paper page
- Xie, J. et al. STING activation in TET2-mutated hematopoietic stem/progenitor cells contributes to the increased self-renewal and neoplastic transformation. Leukemia 37, 2457–2467 (2023). · DOI
- Li, Z. et al. Deletion of Tet2 in mice leads to dysregulated hematopoietic stem cells and subsequent development of myeloid malignancies. Blood 118, 4509 (2011). · DOI · Paper page
- Graham, S. M., Vass, J. K., Holyoake, T. L. & Graham, G. J. Transcriptional analysis of quiescent and proliferating CD34+ human hemopoietic cells from normal and chronic myeloid leukemia sources. Stem Cells 25, 3111–3120 (2007). · DOI
- Park, I. K. et al. Differential gene expression profiling of adult murine hematopoietic stem cells. Blood 99, 488–498 (2002). · DOI
- Kimura, S., Roberts, A. W., Metcalf, D. & Alexander, W. S. Hematopoietic stem cell deficiencies in mice lacking c-Mpl, the receptor for thrombopoietin. Proc. Natl Acad. Sci. 95, 1195–1200 (1998). · DOI
- Solar, G. P. et al. Role of c-mpl in early hematopoiesis. Blood 92, 4–10 (1998). · DOI
- Ostrander, E. L. et al. Divergent Effects of Dnmt3a and Tet2 mutations on hematopoietic progenitor cell fitness. Stem Cell Rep. 14, 551–560 (2020). · DOI · Paper page
- Cai, Z. et al. Inhibition of inflammatory signaling in Tet2 mutant preleukemic cells mitigates stress-induced abnormalities and clonal hematopoiesis. Cell Stem Cell 23, 833–849.e5 (2018). · DOI · Paper page
- Papathanasiou, P., Attema, J. L., Karsunky, H., Jian, X., Smale, S. T. & Weissman, I. L. Evaluation of the long-term reconstituting subset of hematopoietic stem cells with CD150. Stem Cells 27, 2498–2508 (2009). · DOI
- Ezumi, Y., Takayama, H. & Okuma, M. Thrombopoietin, c-Mpl ligand, induces tyrosine phosphorylation of Tyk2, JAK2, and STAT3, and enhances agonists-induced aggregation in platelets in vitro. FEBS Lett. https://doi.org/10.1016/0014-5793(95)01072-M (1995). · DOI
- Miyakawa, Y. et al. Thrombopoietin induces tyrosine phosphorylation of Stat3 and Stat5 in human blood platelets. Blood 87, 439–446 (1996). · DOI
- Kollmann, S. et al. A STAT5B-CD9 axis determines self-renewal in hematopoietic and leukemic stem cells. Blood 138, 2347–2359 (2021). · DOI
- Escamilla Gómez, V. et al. Ruxolitinib in refractory acute and chronic graft-versus-host disease: a multicenter survey study. BMT https://doi.org/10.1038/s41409-019-0731-x (2020). · DOI
- O’Shea, J. J., Kontzias, A., Yamaoka, K., Tanaka, Y. & Laurence, A. Janus kinase inhibitors in autoimmune diseases. Ann. Rheum. Dis. https://doi.org/10.1136/annrheumdis-2012-202576 (2013). · DOI
- Vainchenker, W. et al. JAK inhibitors for the treatment of myeloproliferative neoplasms and other disorders. F1000Res 7, 82 (2018). · DOI
- Gozgit, J. M. et al. Effects of the JAK2 inhibitor, AZ960, on Pim/BAD/BCL-xL survival signaling in the human JAK2 V617F cell line SET-2. J. Biol. Chem. https://doi.org/10.1074/jbc.M803813200 (2008). · DOI
- Wernig, G. et al. Efficacy of TG101348, a selective JAK2 inhibitor, in treatment of a murine model of JAK2V617F-induced polycythemia vera. Cancer Cell 13, 311–320 (2008). · DOI
- Mascarenhas, J. & Hoffman, R. Ruxolitinib: The first FDA approved therapy for the treatment of myelofibrosis. Clin. Cancer Res. 18, 3008–3014 (2012). · DOI
- Nakauchi, Y. et al. The cell type-specific 5hmc landscape and dynamics of healthy human hematopoiesis and TET2-mutant preleukemia. Blood Cancer Discov. 3, 346–367 (2022). · DOI · Paper page
- Jeong, J. J. et al. Cytokine-regulated phosphorylation and activation of TET2 by JAK2 in hematopoiesis. Cancer Discov. 9, 778–795 (2019). · DOI
- Abegunde, S. O., Buckstein, R., Wells, R. A. & Rauh, M. J. An inflammatory environment containing TNFα favors Tet2-mutant clonal hematopoiesis. Exp. Hematol. 59, 60–65 (2018). · DOI · Paper page
- Feng, Y. et al. Early mammalian erythropoiesis requires the Dot1L methyltransferase. Blood. https://doi.org/10.1182/blood-2010-03-276501 (2010). · DOI
- Nguyen, A. T., He, J., Taranova, O. & Zhang, Y. Essential role of DOT1L in maintaining normal adult hematopoiesis. Cell Res 21, 1370–1373 (2011). · DOI
- Kang, J. Y. et al. KDM2B is a histone H3K79 demethylase and induces transcriptional repression via sirtuin-1–mediated chromatin silencing. FASEB J. 32, 5737–5750 (2018). · DOI
- Warren, J. T. & Link, D. C. Clonal hematopoiesis and risk for hematologic malignancy. Blood 136, 1599–1605 (2020).
- Jaiswal, S. Clonal hematopoiesis and nonhematologic disorders. Blood 136, 1606–1614 (2020).
- Flores-Guzmán, P., Fernández-Sánchez, V. & Mayani, H. Concise review: ex vivo expansion of cord blood-derived hematopoietic stem and progenitor cells: basic principles, experimental approaches, and impact in regenerative medicine. Stem Cells Transl. Med. 2, 830–838 (2013). · DOI
- Dahlberg, A., Delaney, C. & Bernstein, I. D. Ex vivo expansion of human hematopoietic stem and progenitor cells. Blood 117, 6083–6090 (2011). · DOI
- Wang, Y. et al. Tracking hematopoietic precursor division ex vivo in real time. Stem Cell Res. Ther. https://doi.org/10.1186/S13287-017-0767-Z (2018). · DOI
- Bolton, K. L. et al. Cancer therapy shapes the fitness landscape of clonal hematopoiesis. Nat. Genet. 52, 1219–1226 (2020). · DOI · Paper page
- Dorsheimer, L. et al. Association of mutations contributing to clonal hematopoiesis with prognosis in chronic ischemic heart failure. JAMA Cardiol. 4, 25–33 (2019). · DOI · Paper page
- Jaiswal, S. & Libby, P. Clonal haematopoiesis: connecting ageing and inflammation in cardiovascular disease. Nat. Rev. Cardiol. 17, 137–144 (2020). · DOI · Paper page
Cited by
A scalable in vitro cell competition model identifies preleukemic super competitor clones
Cabrera-Cosme, L., Rubio-Lara, J. A., Bennett, E., Miłek, J., Baldreki, C., Dowle, A., Vijayabaskar, M. S., Davies, S. J., Taylor-Smith, E., Bain, F. M., et al. (2026) · doi:10.64898/2026.10.21.760611
Metadata
- Authors
- Yang, Y., Cathelin, S., Liu, A. C. H., Subedi, A., Maher, A., Hosseini, M., Manikoth Ayyathan, D., Vanner, R., & Chan, S. M.
- Venue
- Nature Communications
- Published
- 2025-03-10
- Volume
- 16
- Issue
- 1
- ISSN
- 2041-1723
- PMC
- PMC11894142
- Cited by
- 14
- References
- 8
- Language
- en
- Licence
- Funders
- Leukemia and Lymphoma Society of Canada
- University of Toronto
- Gouvernement du Canada | Canadian Institutes of Health Research
About these checks
Registry, retraction, Cites and statistics results are computed, not judged, with one exception: a printed reference that no index lists is read once by a model before it counts as a citation error. Claims are extracted by a model and kept only when their quote appears verbatim in the text; each cited source is then checked, with a model’s help, for whether it says what the claim relies on. Those verdicts can be wrong — read the claim’s quote and the cited source before relying on one.
Statistics and arithmetic are recomputed, not judged.
Confidence bands are shown only for fields calibrated on our annotated test set. None is calibrated yet, so no band is shown.
What counts as a claim ›How we measure confidence ›How we check this ›
Are you an author, or do you see a problem with this page? Request a review
