Cited by 81

The DOI matches its Crossref record; 16 of the 16 references it cites were found in a registry or an index.

Loss of TET2 in human hematopoietic stem cells alters the development and function of neutrophils

Huerga Encabo, Hector, Aramburu, Iker Valle, Garcia-Albornoz, Manuel, Piganeau, Marion, Wood, Henry, Song, Anna, Ferrelli, Alessandra, Sharma, Aneesh, Minutti, Carlos M., Domart, Marie-Charlotte, Papazoglou, Despoina, Gurashi, Kristian, Llorian Sopena, Miriam, Goldstone, Robert, Fallesen, Todd, Wang, Qian, Ariza-McNaughton, Linda, Wiseman, Daniel H., Batta, Kiran, Gupta, Rajeev, Papayannopoulos, Venizelos, Bonnet, Dominique·2023·Cell Stem Cell

Overview

The claims and statistics of this paper haven’t been checked yet.

Run the check — free, no account needed. It reads the open-access text and checks the sources it cites.

A few free checks a day · papers already verified open instantly · results are public

Integrity signals

Registry

Crossref · 10.1016/j.stem.2023.05.004

Cites

16 of 16 references verified0 citation errors · 0 not checkable

Statistics

Figures

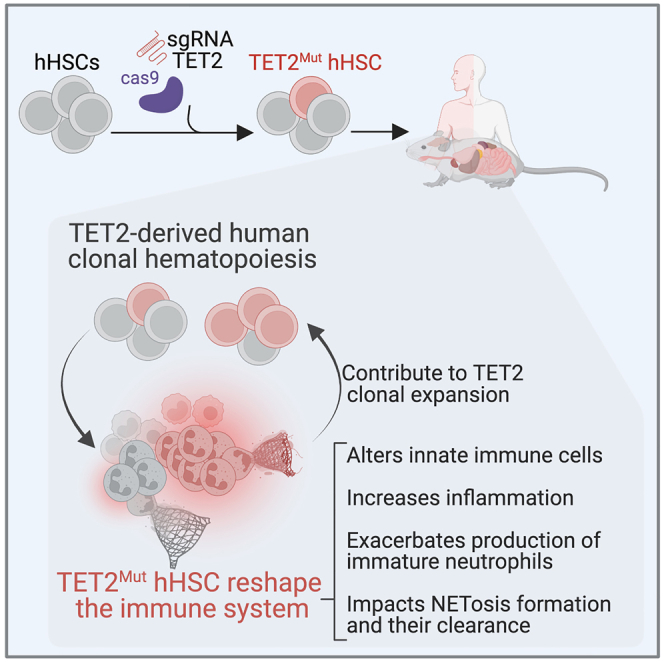
Graphical abstract
Graphical abstract CC BY · PubMed Central
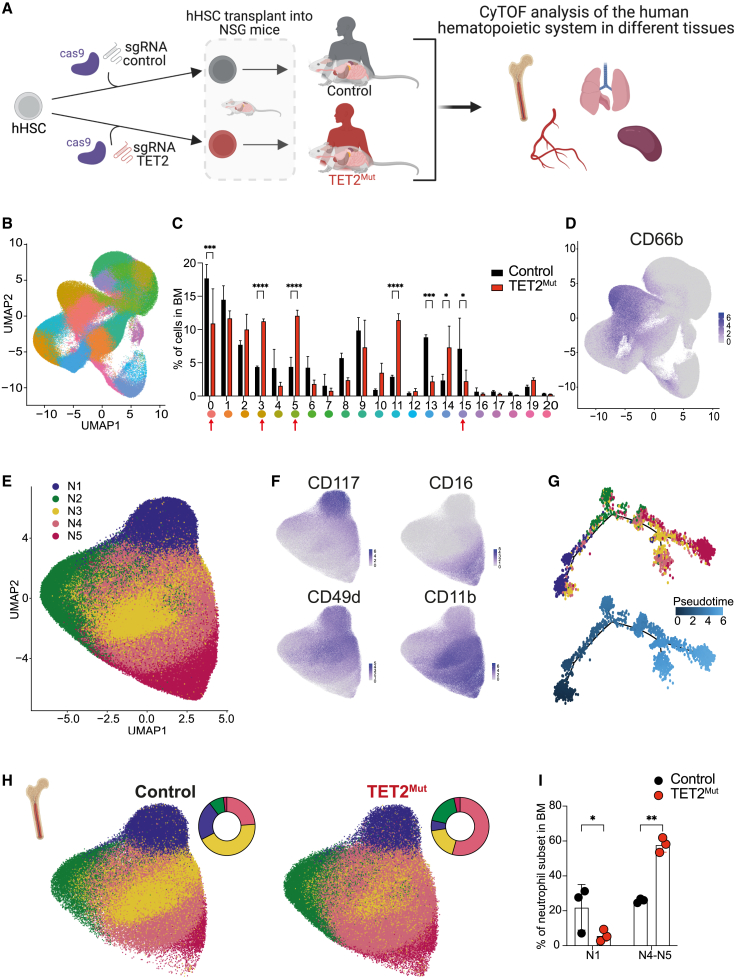
Figure 1 Identification of human neutrophil heterogeneity derived from TET2Mut hHSPCs in bone marrow and peripheral tissues of humanized mice (A) Schematic representation of the design to study the impact of TET2 loss in hHSPCs in the reconstitution of the human immune system in different tissues of NSG mice. Created with BioRender. (B) Uniform manifold approximation and projection (UMAP) dimensionality reduction of human hematopoietic cells isolated from bone marrow of mice engrafted with wild-type human HSCs (hHSPCs). 1.3 million cells are represented into 21 clusters. (C) Frequencies of the 21 clusters identified in the bone marrow of mice reconstituted with wild-type (black bars) or TET2 mutant (red bars) hHSPC (data showing mean and SD from 3 biological replicates). Two-way ANOVA test used for significance, ∗p < 0.05; ∗∗p < 0.01; ∗∗∗p < 0.005; ∗∗∗∗p < 0.001. (D) Single-cell expression of CD66b used to define clusters containing granulocytes. See Figure S1A. Clusters 0, 3, 5, and 15 were selected for downstream analysis of neutrophil heterogeneity. (E) UMAP dimensionality reduction of 365 thousand cells to define the 5 neutrophil subsets (labeled as N1–N5). (F) Single-cell expression of progenitor markers CD117 and CD49d and maturation markers CD16 and CD11b. (G) Pseudo-time trajectory to determine the neutrophil development across N1–N5 subsets. A sub-setting of 500 cells per cluster was obtained to perform the pseudo-time analysis. (H) Comparison of the neutrophil heterogeneity in the bone marrow derived from control (148,464 cells) and TET2 mutant (152,708) hHSPCs by UMAP and pie-chart representing the percentage of each subset. (I) Frequencies of N1–N3 neutrophils and N4–N5 neutrophils in the bone marrow of mice reconstituted with wild-type (black dots) or TET2 mutant (red dots) hHSPC (each dot represents one biological replicate). n = 3 mice. Two-way ANOVA test used for significance, ∗p < 0.05; ∗∗p < 0.01; ∗∗∗p < 0.005; ∗∗∗∗p < 0.001.
Figure 1 Identification of human neutrophil heterogeneity derived from TET2Mut hHSPCs in bone marrow and peripheral tissues of humanized mice (A) Schematic representation of the design to study the impact of TET2 loss in hHSPCs in the reconstitution of the human immune system in different tissues of NSG mice. Created with BioRender. (B) Uniform manifold approximation and projection (UMAP) dimensionality reduction of human hematopoietic cells isolated from bone marrow of mice engrafted with wild-type human HSCs (hHSPCs). 1.3 million cells are represented into 21 clusters. (C) Frequencies of the 21 clusters identified in the bone marrow of mice reconstituted with wild-type (black bars) or TET2 mutant (red bars) hHSPC (data showing mean and SD from 3 biological replicates). Two-way ANOVA test used for significance, ∗p < 0.05; ∗∗p < 0.01; ∗∗∗p < 0.005; ∗∗∗∗p < 0.001. (D) Single-cell expression of CD66b used to define clusters containing granulocytes. See Figure S1A. Clusters 0, 3, 5, and 15 were selected for downstream analysis of neutrophil heterogeneity. (E) UMAP dimensionality reduction of 365 thousand cells to define the 5 neutrophil subsets (labeled as N1–N5). (F) Single-cell expression of progenitor markers CD117 and CD49d and maturation markers CD16 and CD11b. (G) Pseudo-time trajectory to determine the neutrophil development across N1–N5 subsets. A sub-setting of 500 cells per cluster was obtained to perform the pseudo-time analysis. (H) Comparison of the neutrophil heterogeneity in the bone marrow derived from control (148,464 cells) and TET2 mutant (152,708) hHSPCs by UMAP and pie-chart representing the percentage of each subset. (I) Frequencies of N1–N3 neutrophils and N4–N5 neutrophils in the bone marrow of mice reconstituted with wild-type (black dots) or TET2 mutant (red dots) hHSPC (each dot represents one biological replicate). n = 3 mice. Two-way ANOVA test used for significance, ∗p < 0.05; ∗∗p < 0.01; ∗∗∗p < 0.005; ∗∗∗∗p < 0.001.CC BY · PubMed Central
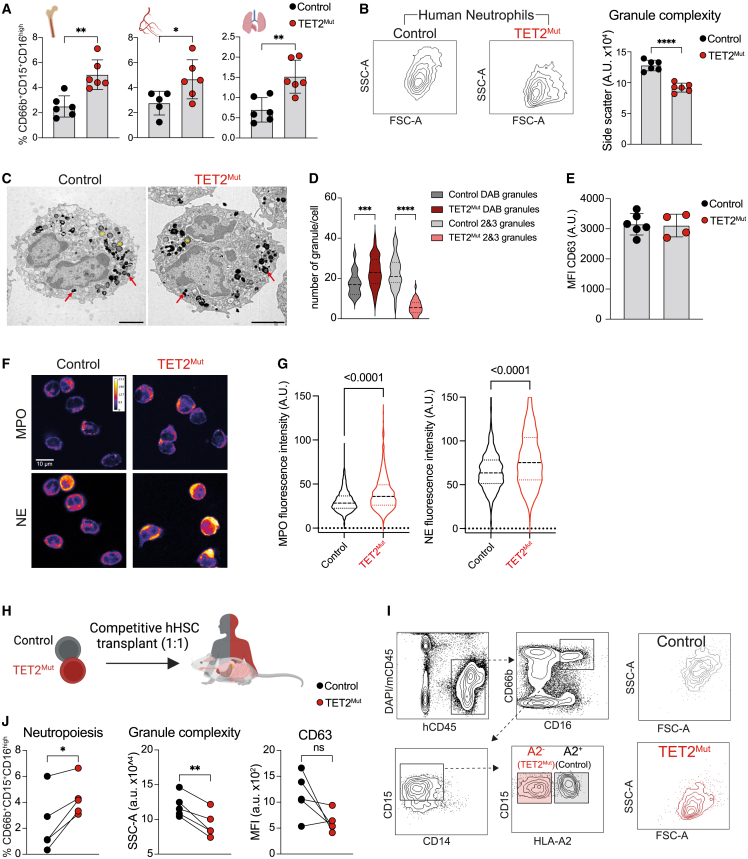
Figure 2 Neutrophils derived from TET2Mut hHSPCs have reduced granule complexity (A) Percentage of CD66b+CD15+CD16high cells within human hematopoietic system in bone marrow, blood, and lung of mice engrafted with control (black) or TET2Mut (red) hHSPCs (n = 6 mice, data representative of 3 independent experiments, each performed with hHSPCs from different human donors). Each dot represents one humanized mouse and error bars: mean ± SEM. Unpaired t test used for significance, ∗p < 0.05; ∗∗p < 0.01. (B) Representative side-scatter plots of mature neutrophils and quantification of side-scatter area (a.u., arbitrary units acquired from the analyzer). n = 6 mice, data representative of 3 independent experiments, each performed with hHSPCs from different human donors. Each dot represents one humanized mouse and error bars: mean ± SEM. Unpaired t test used for significance, ∗p < 0.05; ∗∗p < 0.01. (C and D) Representative transmission electron microscopy (TEM) images of DAB-stained mature neutrophils sorted from bone marrow of humanized mice as indicated in (A). Red arrows show examples of primary (DAB-positive) granules, yellow stars secondary/tertiary (DAB-negative) granules. Scale bars, 2 μm. (D) Quantification of primary and secondary/tertiary granules. Data from 3 mice engrafted with control (gray) and 3 mice engrafted TET2Mut (red/pink) HSPCs, at least 10 cells from each humanized mouse were analyzed (control n = 37, TET2Mut = 40). Violin plots showing median and quartiles. One-way ANOVA test used for significance, ∗∗∗p < 0.001; ∗∗∗∗p < 0.0001. (E) Mean fluorescent intensity (MFI) of CD63 in mature neutrophils (a.u., arbitrary units, raw data from the analyzer). Data from 1 experiment (control n = 6, TET2Mut = 4). Each dot represents one humanized mouse and error bars: mean ± SEM. (F and G) Immunocytochemistry staining of MPO and neutrophil elastase (NE) in control and TET2Mut neutrophils. Fire lookup table, scale bars, 10 μm. (G) Quantification of signal per cell n = 3–4 mice per group. Violin plots showing median and quartiles. Unpaired t test used for significance. (H and I) Schema (H) and flow gating strategy (I) to identify human neutrophils in chimeric mice engrafted with a 1:1 mix with control (black) or TET2Mut (red) hHSCs. Schema created with BioRender. (J) Percentage (right panel), SSC (center) and CD63-MFI (right) of control or TET2Mut neutrophils within the same chimeric mouse. n = 6 mice, data representative of 3 experiments (CD63-MFI was evaluated in 1 chimeric mice experiment). Paired t test was used for significance, ns, no-significance, ∗p < 0.05, ∗∗p < 0.01.
Figure 2 Neutrophils derived from TET2Mut hHSPCs have reduced granule complexity (A) Percentage of CD66b+CD15+CD16high cells within human hematopoietic system in bone marrow, blood, and lung of mice engrafted with control (black) or TET2Mut (red) hHSPCs (n = 6 mice, data representative of 3 independent experiments, each performed with hHSPCs from different human donors). Each dot represents one humanized mouse and error bars: mean ± SEM. Unpaired t test used for significance, ∗p < 0.05; ∗∗p < 0.01. (B) Representative side-scatter plots of mature neutrophils and quantification of side-scatter area (a.u., arbitrary units acquired from the analyzer). n = 6 mice, data representative of 3 independent experiments, each performed with hHSPCs from different human donors. Each dot represents one humanized mouse and error bars: mean ± SEM. Unpaired t test used for significance, ∗p < 0.05; ∗∗p < 0.01. (C and D) Representative transmission electron microscopy (TEM) images of DAB-stained mature neutrophils sorted from bone marrow of humanized mice as indicated in (A). Red arrows show examples of primary (DAB-positive) granules, yellow stars secondary/tertiary (DAB-negative) granules. Scale bars, 2 μm. (D) Quantification of primary and secondary/tertiary granules. Data from 3 mice engrafted with control (gray) and 3 mice engrafted TET2Mut (red/pink) HSPCs, at least 10 cells from each humanized mouse were analyzed (control n = 37, TET2Mut = 40). Violin plots showing median and quartiles. One-way ANOVA test used for significance, ∗∗∗p < 0.001; ∗∗∗∗p < 0.0001. (E) Mean fluorescent intensity (MFI) of CD63 in mature neutrophils (a.u., arbitrary units, raw data from the analyzer). Data from 1 experiment (control n = 6, TET2Mut = 4). Each dot represents one humanized mouse and error bars: mean ± SEM. (F and G) Immunocytochemistry staining of MPO and neutrophil elastase (NE) in control and TET2Mut neutrophils. Fire lookup table, scale bars, 10 μm. (G) Quantification of signal per cell n = 3–4 mice per group. Violin plots showing median and quartiles. Unpaired t test used for significance. (H and I) Schema (H) and flow gating strategy (I) to identify human neutrophils in chimeric mice engrafted with a 1:1 mix with control (black) or TET2Mut (red) hHSCs. Schema created with BioRender. (J) Percentage (right panel), SSC (center) and CD63-MFI (right) of control or TET2Mut neutrophils within the same chimeric mouse. n = 6 mice, data representative of 3 experiments (CD63-MFI was evaluated in 1 chimeric mice experiment). Paired t test was used for significance, ns, no-significance, ∗p < 0.05, ∗∗p < 0.01.CC BY · PubMed Central
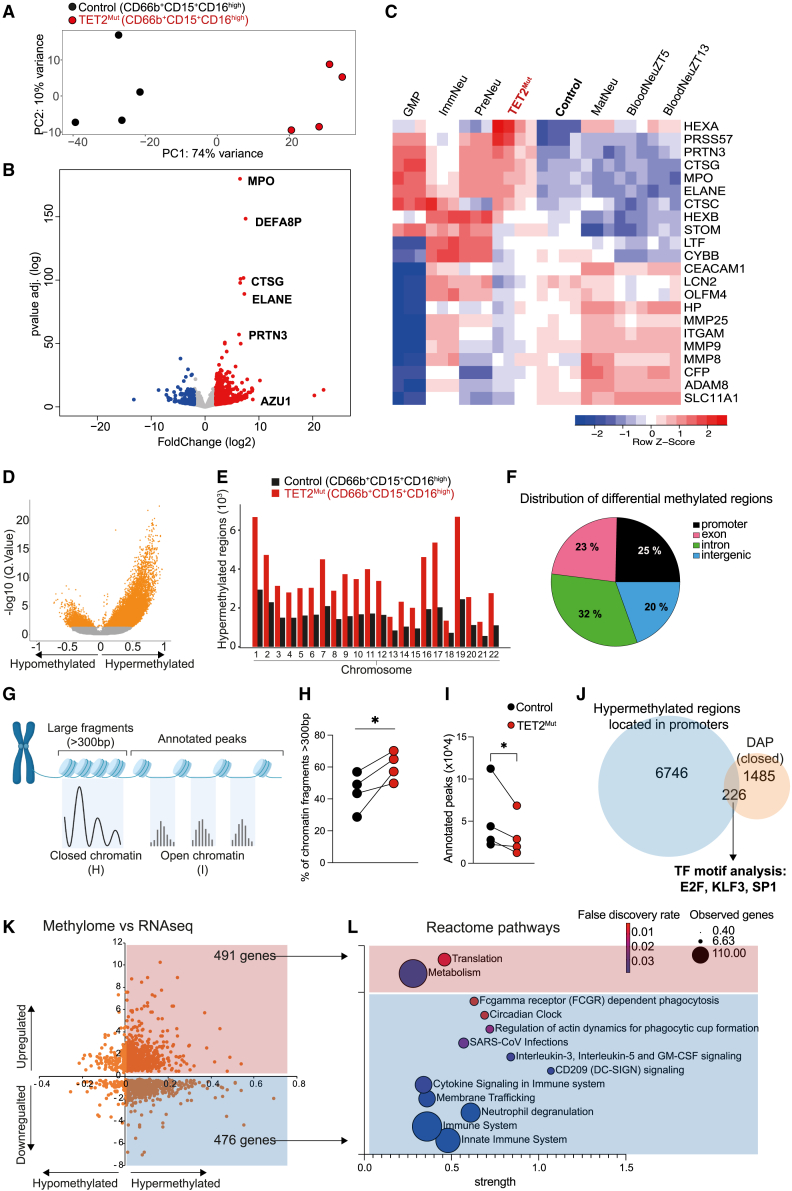
Figure 3 TET2Mut neutrophils are characterized by distinctive epigenome, chromatin architecture, and transcriptome signatures (A) RNA-sequencing principal component analysis of control and TET2Mut sorted neutrophils (CD66b+CD15+CD16high) (n = 4 mice). (B) Volcano plot showing significantly (p value adjusted < 0.05) downregulated (blue dots) or upregulated (red dots) genes in TET2Mut neutrophils. See Table S2. (C) Heatmap representing the expression of genes associated with primary, secondary, and tertiary granule formation. The expression of these genes in our control and TET2Mut neutrophils was compared with the expression in the different neutrophil subsets identified in GSE109467. (D) Volcano plot of differentially methylated CpG bases. Orange colored dots indicate adjusted p value < 0.05. (E) Bar plot showing the distribution of the differentially methylated regions across the chromosomes. (F) Distribution of the differentially methylated regions according to their location in promoter, exon, intron, or intergenic regions. See Table S3. (G) ATAC-seq schematic representation of the distinguishable closed and open chromatin regions. For this experiment we used and compared control and TET2Mut neutrophils sorted from the same mouse engrafted with a mix of wild-type and TET2-mutant hHSPCs. (H) Comparison of the percentage of large chromatin fragments (>300 bp) between control and TET2Mut neutrophils from the same mouse. Paired t test used for significance, ∗p < 0.05. See Table S3. (I) Comparison of annotated peaks between control and TET2Mut neutrophils from the same mouse. Paired t test used for significance, ∗p < 0.05. See Table S3. (J) Venn diagram showing that 226 gene promoter regions were found both hypermethylated and less accessible in the differential accessible peak (DAP) analysis. These promoter regions were enriched in binding motifs associated with E2F, KLF3, or SP1 transcription factors. See Table S3. (K) Overlap of differentially expressed genes identified in the RNA-seq analysis and genes containing differentially methylated promoter identified in the methylome sequencing. Numbers in the corners indicate the number of genes differentially regulated and containing hypermethylated CpG sites in the promoters. See Table S3. (L) Selection of differentially regulated pathways in reactome using the genes containing hypermethylated CpGs in the promoters that were upregulated (in red) or downregulated (blue) in the RNA-seq. See Table S3 for complete list of pathways.
Figure 3 TET2Mut neutrophils are characterized by distinctive epigenome, chromatin architecture, and transcriptome signatures (A) RNA-sequencing principal component analysis of control and TET2Mut sorted neutrophils (CD66b+CD15+CD16high) (n = 4 mice). (B) Volcano plot showing significantly (p value adjusted < 0.05) downregulated (blue dots) or upregulated (red dots) genes in TET2Mut neutrophils. See Table S2. (C) Heatmap representing the expression of genes associated with primary, secondary, and tertiary granule formation. The expression of these genes in our control and TET2Mut neutrophils was compared with the expression in the different neutrophil subsets identified in GSE109467. (D) Volcano plot of differentially methylated CpG bases. Orange colored dots indicate adjusted p value < 0.05. (E) Bar plot showing the distribution of the differentially methylated regions across the chromosomes. (F) Distribution of the differentially methylated regions according to their location in promoter, exon, intron, or intergenic regions. See Table S3. (G) ATAC-seq schematic representation of the distinguishable closed and open chromatin regions. For this experiment we used and compared control and TET2Mut neutrophils sorted from the same mouse engrafted with a mix of wild-type and TET2-mutant hHSPCs. (H) Comparison of the percentage of large chromatin fragments (>300 bp) between control and TET2Mut neutrophils from the same mouse. Paired t test used for significance, ∗p < 0.05. See Table S3. (I) Comparison of annotated peaks between control and TET2Mut neutrophils from the same mouse. Paired t test used for significance, ∗p < 0.05. See Table S3. (J) Venn diagram showing that 226 gene promoter regions were found both hypermethylated and less accessible in the differential accessible peak (DAP) analysis. These promoter regions were enriched in binding motifs associated with E2F, KLF3, or SP1 transcription factors. See Table S3. (K) Overlap of differentially expressed genes identified in the RNA-seq analysis and genes containing differentially methylated promoter identified in the methylome sequencing. Numbers in the corners indicate the number of genes differentially regulated and containing hypermethylated CpG sites in the promoters. See Table S3. (L) Selection of differentially regulated pathways in reactome using the genes containing hypermethylated CpGs in the promoters that were upregulated (in red) or downregulated (blue) in the RNA-seq. See Table S3 for complete list of pathways.CC BY · PubMed Central
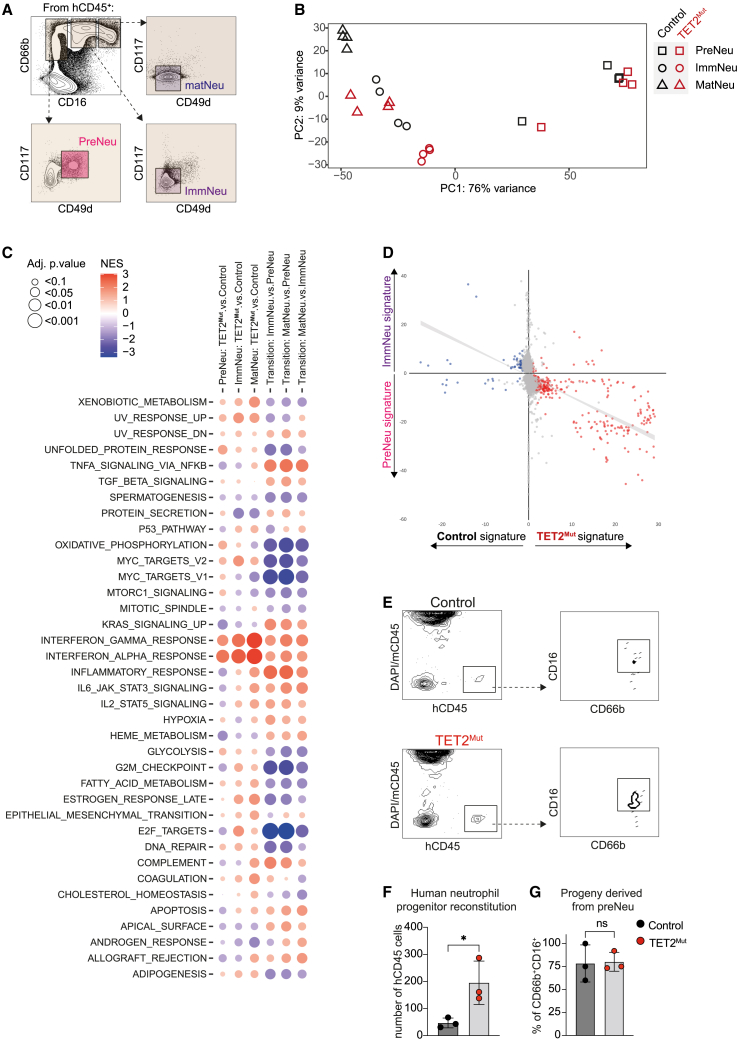
Figure 4 TET2 mutations alter the transcriptome of different neutrophil developmental stages and increase neutrophil progenitor potential (A) Representative sorting strategy to isolate from bone marrow human CD45+ cells: preNeu (CD66b+CD16−CD117+CD49d+), immNeu (CD66b+CD16midCD117−CD49d−), and matNeu (CD66b+CD16highCD117+CD49d+). (B) RNA-sequencing principal component analysis of the different neutrophil populations from mice reconstituted with control and TET2Mut hHSPCs (n = 4 mice.). (C) Gene-set enrichment analysis using Hallmark database for the different comparisons displayed in the columns. See Table S4. (D) Scatterplots comparing the fold changes of genes with adjusted p values of ≤0.05 in the preNeu vs. immNeu (y axis) comparison with the fold changes of genes with adjusted p values of ≤0.05 that appear downregulated (blue) or upregulated (red) in TET2Mut immNeu (x axis). (E–G) Representative density plots from the secondary recipient mice engrafted with control or TET2Mut neutrophil progenitors (E). Number of human CD45 cells (F) and percentage of CD66b+CD16+ (G) in reconstituted secondary recipient mice. Each dot represents one secondary recipient mouse. 3 secondary recipient mice per group, each received the neutrophil progenitors from different primary humanized mouse, and error bars: mean ± SEM. Unpaired t test used for significance, ∗p < 0.05.
Figure 4 TET2 mutations alter the transcriptome of different neutrophil developmental stages and increase neutrophil progenitor potential (A) Representative sorting strategy to isolate from bone marrow human CD45+ cells: preNeu (CD66b+CD16−CD117+CD49d+), immNeu (CD66b+CD16midCD117−CD49d−), and matNeu (CD66b+CD16highCD117+CD49d+). (B) RNA-sequencing principal component analysis of the different neutrophil populations from mice reconstituted with control and TET2Mut hHSPCs (n = 4 mice.). (C) Gene-set enrichment analysis using Hallmark database for the different comparisons displayed in the columns. See Table S4. (D) Scatterplots comparing the fold changes of genes with adjusted p values of ≤0.05 in the preNeu vs. immNeu (y axis) comparison with the fold changes of genes with adjusted p values of ≤0.05 that appear downregulated (blue) or upregulated (red) in TET2Mut immNeu (x axis). (E–G) Representative density plots from the secondary recipient mice engrafted with control or TET2Mut neutrophil progenitors (E). Number of human CD45 cells (F) and percentage of CD66b+CD16+ (G) in reconstituted secondary recipient mice. Each dot represents one secondary recipient mouse. 3 secondary recipient mice per group, each received the neutrophil progenitors from different primary humanized mouse, and error bars: mean ± SEM. Unpaired t test used for significance, ∗p < 0.05.CC BY · PubMed Central
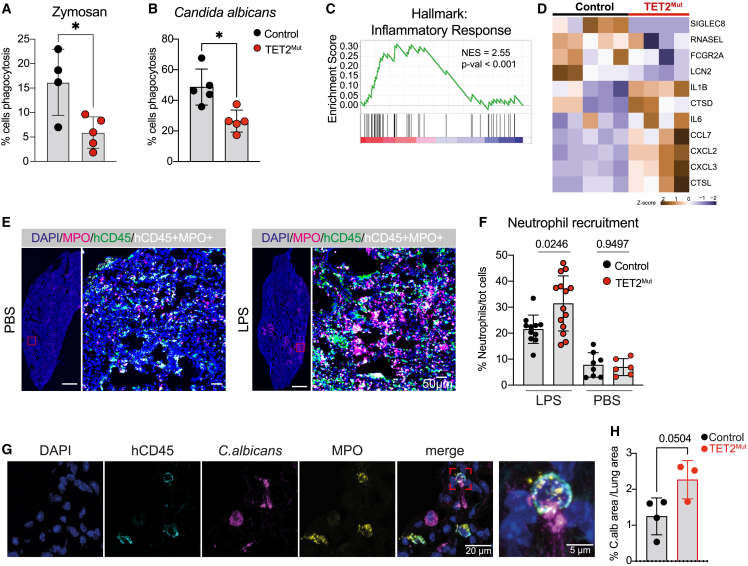
Figure 5 TET2Mut neutrophils show exacerbated inflammation and recruitment to sites of infection (A and B) Percentage of control or TET2Mut human neutrophils undergoing phagocytosis of zymosan 488 beads (A) or yeast C. albicans (B) (n = 4–5 per group, representative of 3 independent experiments). Mann-Whitney statistical test used for significance, ∗p < 0.05. (C) Gene-set enrichment analysis (GSEA) showing upregulation of inflammatory response pathway using the Hallmark database. See Table S5 for complete list of pathways. (D) Heatmap of selected genes differentially expressed (p value < 0.05) in TET2Mut neutrophils after LPS stimulation (3 h, 1 μg/mL). See Table S5 for complete list of differentially expressed genes. (E) Immunohistochemistry image of a lung section from a mouse engrafted with control hHSPCs challenged with PBS (top row) or LPS (bottom row) intranasally. Overview of a control lung section (left) with DAPI (blue) and MPO (magenta) staining, scale bars, 100 μm. Magnification of a region of interest of the lung with DAPI (blue), human CD45 (green), MPO (magenta), and cells containing CD45 and MPO signal (white) scale bars, 50 μm. (F) Quantification of percentage of neutrophil infiltration (%MPO+ cells) normalized to the total number of cells in the tissue. Each dot represents a lung section. 3–4 sections were used per lung (n = 3–4 mice in LPS group and n = 2–3 mice in PBS group). Mann-Whitney test used for significance. (G) Confocal immunohistochemistry images of a lung section from a mouse engrafted with control hHSPCs challenged with C. albicans showing human CD45+ MPO+ neutrophils attached to a C. albicans hyphae and phagocytosing a C. albicans yeast with MPO colocalized. DAPI (blue), hCD45 (cyan), C. albicans (magenta), and MPO (yellow). Scale bars, 20 and 5 μm. (H) Quantification of the percentage of Candida albicans signal over the total lung area in control and TET2Mut mice. Mean of 2–3 sections per mouse, unpaired t test used for significance.
Figure 5 TET2Mut neutrophils show exacerbated inflammation and recruitment to sites of infection (A and B) Percentage of control or TET2Mut human neutrophils undergoing phagocytosis of zymosan 488 beads (A) or yeast C. albicans (B) (n = 4–5 per group, representative of 3 independent experiments). Mann-Whitney statistical test used for significance, ∗p < 0.05. (C) Gene-set enrichment analysis (GSEA) showing upregulation of inflammatory response pathway using the Hallmark database. See Table S5 for complete list of pathways. (D) Heatmap of selected genes differentially expressed (p value < 0.05) in TET2Mut neutrophils after LPS stimulation (3 h, 1 μg/mL). See Table S5 for complete list of differentially expressed genes. (E) Immunohistochemistry image of a lung section from a mouse engrafted with control hHSPCs challenged with PBS (top row) or LPS (bottom row) intranasally. Overview of a control lung section (left) with DAPI (blue) and MPO (magenta) staining, scale bars, 100 μm. Magnification of a region of interest of the lung with DAPI (blue), human CD45 (green), MPO (magenta), and cells containing CD45 and MPO signal (white) scale bars, 50 μm. (F) Quantification of percentage of neutrophil infiltration (%MPO+ cells) normalized to the total number of cells in the tissue. Each dot represents a lung section. 3–4 sections were used per lung (n = 3–4 mice in LPS group and n = 2–3 mice in PBS group). Mann-Whitney test used for significance. (G) Confocal immunohistochemistry images of a lung section from a mouse engrafted with control hHSPCs challenged with C. albicans showing human CD45+ MPO+ neutrophils attached to a C. albicans hyphae and phagocytosing a C. albicans yeast with MPO colocalized. DAPI (blue), hCD45 (cyan), C. albicans (magenta), and MPO (yellow). Scale bars, 20 and 5 μm. (H) Quantification of the percentage of Candida albicans signal over the total lung area in control and TET2Mut mice. Mean of 2–3 sections per mouse, unpaired t test used for significance.CC BY · PubMed Central
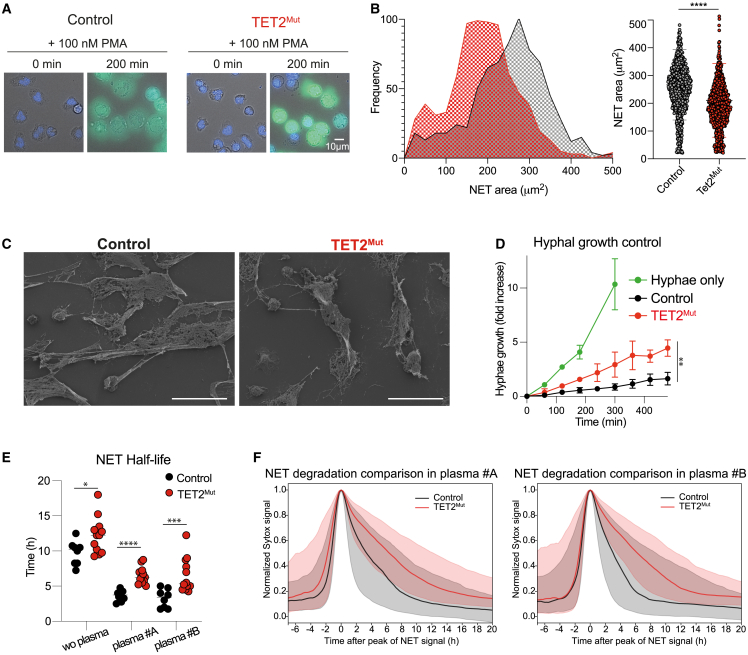
Figure 6 NETs produced by neutrophils derived from TET2Mut HSCs are more compact and difficult to be degraded (A) Representative magnification images of wide-field fluorescence microscopy from time-lapse imaging of PMA-stimulated control and TET2Mut neutrophils at time point 0 and 200 min. Nucleus are stained with DAPI and NETs are stained with sytox green. Scale bars, 10 μm. (B) Frequency versus NET area plot displaying the distribution of NET areas of control and TET2Mut neutrophils quantified at time point 200 min (left panel). Distribution of NET area of individual cells in control (gray) and TET2Mut (red) neutrophils (right panel). n = 3 per group, representative of 4 independent experiments. Mann-Whitney statistical test used for significance, ∗∗∗∗p < 0.0001. (C) Scanning electron microscopy images of NETs formed upon 100 nM PMA stimulation from control or TET2Mut neutrophils. Scale bars, 30 μm. (D) Hyphal growth fold increase over time of C. albicans hyphae only (green line), hyphae co-cultured with control neutrophils (black line), and TET2Mut neutrophils (red line). n = 3 per group, Wilcoxon matched pair signed rank test, ∗p < 0.05; ∗∗p < 0.01. (E) NET half-life values from NET traces obtained by gathering the signal over time of 1,000 randomly sampled pixels previously classified as NET by the pixROI method, median traces were calculated, and the half-life values of the median traces per field of view corresponding with the traces shown in Figure S6H and (F). Mann-Whitney statistical analysis, ∗p < 0.05; ∗∗p < 0.01; ∗∗∗p < 0.001; ∗∗∗∗p < 0.0001. (F) Comparison of NET degradation profiles for control and TET2Mut neutrophils in the presence of different human plasma. Median curves (solid lines) of netotic pixel signals aligned and normalized to their peak as classified by the pixROI method. Shaded regions are bounded by the Q1 and Q3 curves corresponding to the 25% and 75% quartiles. The specific times in plasma #A (left panel) were 210 min (Q1 = 75 min; Q3 = 495 min) for the control NETs and 390 min (Q1 = 180 min; Q3 = 735 min) for the TET2Mut NETs; and for plasma #B (right panel) were 195 min (Q1 = 90 min; Q3 = 525 min) for the control NETs and 390 min (Q1 = 225 min; Q3 = 690 min) for the TET2Mut NETs. The curves are computed on signals gathering 1,000 randomly sampled pixels for all videos corresponding to the mouse type and experimental condition.
Figure 6 NETs produced by neutrophils derived from TET2Mut HSCs are more compact and difficult to be degraded (A) Representative magnification images of wide-field fluorescence microscopy from time-lapse imaging of PMA-stimulated control and TET2Mut neutrophils at time point 0 and 200 min. Nucleus are stained with DAPI and NETs are stained with sytox green. Scale bars, 10 μm. (B) Frequency versus NET area plot displaying the distribution of NET areas of control and TET2Mut neutrophils quantified at time point 200 min (left panel). Distribution of NET area of individual cells in control (gray) and TET2Mut (red) neutrophils (right panel). n = 3 per group, representative of 4 independent experiments. Mann-Whitney statistical test used for significance, ∗∗∗∗p < 0.0001. (C) Scanning electron microscopy images of NETs formed upon 100 nM PMA stimulation from control or TET2Mut neutrophils. Scale bars, 30 μm. (D) Hyphal growth fold increase over time of C. albicans hyphae only (green line), hyphae co-cultured with control neutrophils (black line), and TET2Mut neutrophils (red line). n = 3 per group, Wilcoxon matched pair signed rank test, ∗p < 0.05; ∗∗p < 0.01. (E) NET half-life values from NET traces obtained by gathering the signal over time of 1,000 randomly sampled pixels previously classified as NET by the pixROI method, median traces were calculated, and the half-life values of the median traces per field of view corresponding with the traces shown in Figure S6H and (F). Mann-Whitney statistical analysis, ∗p < 0.05; ∗∗p < 0.01; ∗∗∗p < 0.001; ∗∗∗∗p < 0.0001. (F) Comparison of NET degradation profiles for control and TET2Mut neutrophils in the presence of different human plasma. Median curves (solid lines) of netotic pixel signals aligned and normalized to their peak as classified by the pixROI method. Shaded regions are bounded by the Q1 and Q3 curves corresponding to the 25% and 75% quartiles. The specific times in plasma #A (left panel) were 210 min (Q1 = 75 min; Q3 = 495 min) for the control NETs and 390 min (Q1 = 180 min; Q3 = 735 min) for the TET2Mut NETs; and for plasma #B (right panel) were 195 min (Q1 = 90 min; Q3 = 525 min) for the control NETs and 390 min (Q1 = 225 min; Q3 = 690 min) for the TET2Mut NETs. The curves are computed on signals gathering 1,000 randomly sampled pixels for all videos corresponding to the mouse type and experimental condition.CC BY · PubMed Central
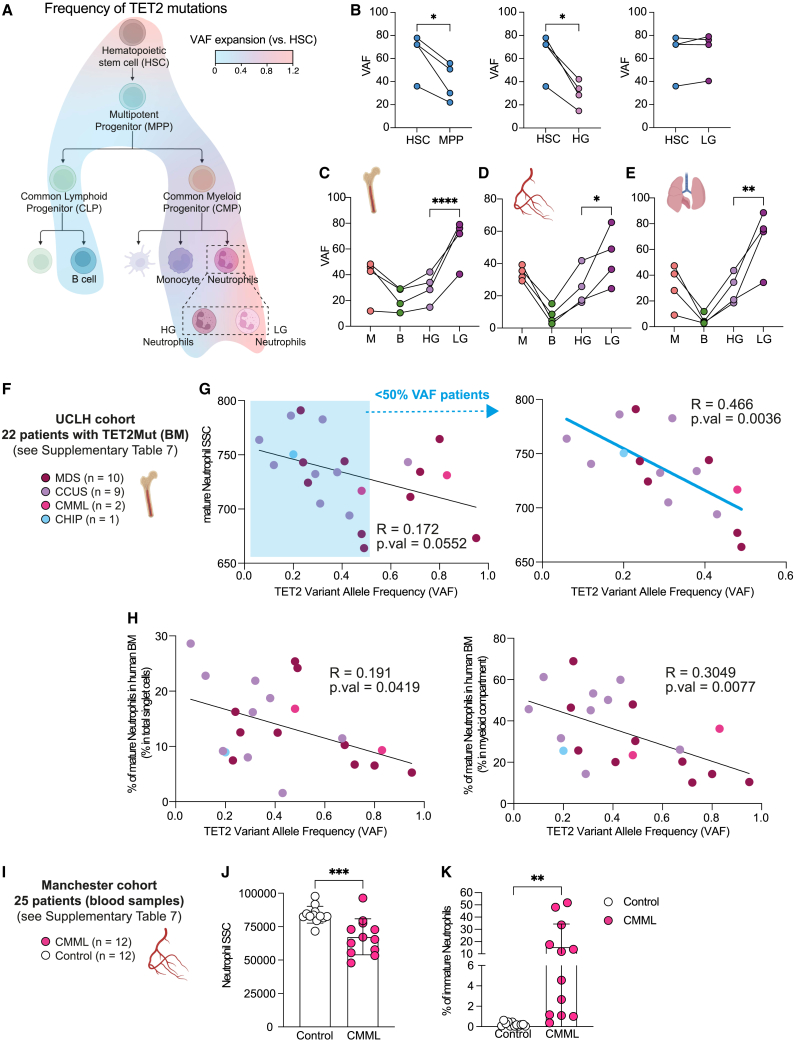
Figure 7 TET2-derived human clonal hematopoiesis is associated with the appearance of low-granule neutrophils (A) Overlayed heatmap into the hematopoietic tree showing the fold expansion of TET2 mutations from HSCs. The following cell populations were analyzed (HSCs, MPP, CLP, CMP, GMP, B cells, monocytes, and HG and LN neutrophils). Data representative of 4 humanized mice. See Figure S7A for sorting strategy and Figure S7B for raw data of VAF for each cell population in each humanized mice. (B) Comparison of the VAF between HSC and MPP (left panel), high granule (HG) neutrophils(center), and low-granule (LG) neutrophils (right). Each line of connected dots represents one humanized mouse. Paired t test used for significance, ∗p < 0.05. (C–E) Percentage of TET2 mutations in different immune cell populations from bone marrow (C), blood (D), and lung (E). Monocytes (M), B cells (B), high granule (HG) neutrophils, and low-granule (LG) neutrophils were sorted from 4 humanized mice engrafted with hHSCs from different human donors, each line of connected dots represents one mouse. Two-way ANOVA test used for significance, ∗p < 0.05; ∗∗p < 0.01; ∗∗∗∗p < 0.001. (F) UCLH cohort consisted of BM aspirates for routine diagnostic purposes at University College London Hospitals (UCLH). 22 patients with hematological disorder diagnosed were identified with mutations of TET2 but who had no other mutations. (G) Correlation between the median side scatter (SSC) of bone marrow mature neutrophils and the TET2 variant allele frequency (VAF) of these 22 patients (left panel) or the correlation for the patients with less than 50% TET2 VAF (right panel). See Figure S7C for gating strategy. Significant correlation was measured by linear regression analysis. (H) Correlation between the percentage of bone marrow mature neutrophils within total BM cells (left panel) or within the myeloid compartment (right panel) and the TET2 variant allele frequency (VAF) of these 22 patients. See Figure S7C. Significant correlation was measured by linear regression analysis. (I) Manchester cohort consisted of peripheral blood samples from CMML patients (n = 12) or healthy volunteers (n = 12) obtained from the Manchester Cancer Research Centre Tissue Biobank. (J) Side-scatter of neutrophils isolated by immunomagnetic negative isolation from peripheral blood of healthy volunteers or CMML patients. See Figure S7D. (K) Percentage of the immature neutrophil fraction (CD66b+CD16−/low) within the neutrophil population isolated from peripheral blood. See Figure S7D.
Figure 7 TET2-derived human clonal hematopoiesis is associated with the appearance of low-granule neutrophils (A) Overlayed heatmap into the hematopoietic tree showing the fold expansion of TET2 mutations from HSCs. The following cell populations were analyzed (HSCs, MPP, CLP, CMP, GMP, B cells, monocytes, and HG and LN neutrophils). Data representative of 4 humanized mice. See Figure S7A for sorting strategy and Figure S7B for raw data of VAF for each cell population in each humanized mice. (B) Comparison of the VAF between HSC and MPP (left panel), high granule (HG) neutrophils(center), and low-granule (LG) neutrophils (right). Each line of connected dots represents one humanized mouse. Paired t test used for significance, ∗p < 0.05. (C–E) Percentage of TET2 mutations in different immune cell populations from bone marrow (C), blood (D), and lung (E). Monocytes (M), B cells (B), high granule (HG) neutrophils, and low-granule (LG) neutrophils were sorted from 4 humanized mice engrafted with hHSCs from different human donors, each line of connected dots represents one mouse. Two-way ANOVA test used for significance, ∗p < 0.05; ∗∗p < 0.01; ∗∗∗∗p < 0.001. (F) UCLH cohort consisted of BM aspirates for routine diagnostic purposes at University College London Hospitals (UCLH). 22 patients with hematological disorder diagnosed were identified with mutations of TET2 but who had no other mutations. (G) Correlation between the median side scatter (SSC) of bone marrow mature neutrophils and the TET2 variant allele frequency (VAF) of these 22 patients (left panel) or the correlation for the patients with less than 50% TET2 VAF (right panel). See Figure S7C for gating strategy. Significant correlation was measured by linear regression analysis. (H) Correlation between the percentage of bone marrow mature neutrophils within total BM cells (left panel) or within the myeloid compartment (right panel) and the TET2 variant allele frequency (VAF) of these 22 patients. See Figure S7C. Significant correlation was measured by linear regression analysis. (I) Manchester cohort consisted of peripheral blood samples from CMML patients (n = 12) or healthy volunteers (n = 12) obtained from the Manchester Cancer Research Centre Tissue Biobank. (J) Side-scatter of neutrophils isolated by immunomagnetic negative isolation from peripheral blood of healthy volunteers or CMML patients. See Figure S7D. (K) Percentage of the immature neutrophil fraction (CD66b+CD16−/low) within the neutrophil population isolated from peripheral blood. See Figure S7D.CC BY · PubMed Central

Verification

Claims the paper makes

The claims and statistics of this paper haven’t been checked yet.

Run the check — free, no account needed. It reads the open-access text and checks the sources it cites.

A few free checks a day · papers already verified open instantly · results are public

Claims other papers make about this one

Each is checked against this paper’s own text: does it say what the citing paper says it does?

Self-check

Percentages, sums and reported differences re-computed from the paper’s own numbers.

The self-check needs the paper’s full text.

Citations

Cites

Show all 16 references

Research works printed but not linked: 69

  1. Dancey, 1976, Neutrophil kinetics in man, J. Clin. Invest., 58, 705, 10.1172/JCI108517 · DOI
  2. Dinh, 2020, Coexpression of CD71 and CD117 identifies an early unipotent neutrophil progenitor population in human bone marrow, Immunity, 53, 10.1016/j.immuni.2020.07.017 · DOI
  3. Zhu, 2018, Identification of an early unipotent neutrophil progenitor with pro-tumoral activity in mouse and human bone marrow, Cell Rep., 24, 10.1016/j.celrep.2018.07.097 · DOI
  4. Ng, 2019, Heterogeneity of neutrophils, Nat. Rev. Immunol., 19, 255, 10.1038/s41577-019-0141-8 · DOI
  5. Evrard, 2018, Developmental analysis of bone marrow neutrophils reveals populations specialized in expansion, trafficking, and effector functions, Immunity, 48, 10.1016/j.immuni.2018.02.002 · DOI
  6. Chan, 2013, Role of DNMT3A, TET2, and IDH1/2 mutations in pre-leukemic stem cells in acute myeloid leukemia, Int. J. Hematol., 98, 648, 10.1007/s12185-013-1407-8 · DOI
  7. Steensma, 2015, Clonal hematopoiesis of indeterminate potential and its distinction from myelodysplastic syndromes, Blood, 126, 9, 10.1182/blood-2015-03-631747 · DOI · Paper page
  8. Abegunde, 2018, An inflammatory environment containing TNFα favors Tet2-mutant clonal hematopoiesis, Exp. Hematol., 59, 60, 10.1016/j.exphem.2017.11.002 · DOI · Paper page
  9. Bolton, 2021, Clonal hematopoiesis is associated with risk of severe Covid-19, Nat. Commun., 12, 5975, 10.1038/s41467-021-26138-6 · DOI
  10. Miller, 2022, Association of clonal hematopoiesis with chronic obstructive pulmonary disease, Blood, 139, 357, 10.1182/blood.2021013531 · DOI · Paper page
  11. Döring, 2015, Neutrophils in atherosclerosis: from mice to man, Arterioscler. Thromb. Vasc. Biol., 35, 288, 10.1161/ATVBAHA.114.303564 · DOI
  12. Döring, 2020, Neutrophil extracellular traps participate in cardiovascular diseases: recent experimental and clinical insights, Circ. Res., 126, 1228, 10.1161/CIRCRESAHA.120.315931 · DOI
  13. Warnatsch, 2016, 349, 316
  14. Grabcanovic-Musija, 2015, Neutrophil extracellular trap (NET) formation characterises stable and exacerbated COPD and correlates with airflow limitation, Respir. Res., 16, 59, 10.1186/s12931-015-0221-7 · DOI
  15. Papayannopoulos, 2011, Neutrophil elastase enhances sputum solubilization in cystic fibrosis patients receiving DNase therapy, PLoS One, 6, 10.1371/journal.pone.0028526 · DOI
  16. Khandpur, 2013, NETs are a source of citrullinated autoantigens and stimulate inflammatory responses in rheumatoid arthritis, Sci. Transl. Med., 5, 10.1126/scitranslmed.3005580 · DOI
  17. Metzler, 2011, Myeloperoxidase is required for neutrophil extracellular trap formation: implications for innate immunity, Blood, 117, 953, 10.1182/blood-2010-06-290171 · DOI
  18. Jiménez-Alcázar, M., Rangaswamy, C., Panda, R., Bitterling, J., Simsek, Y.J., Long, A.T., Bilyy, R., Krenn, V., Renné, C., Renné, T., et al. (2017). Jiménez-Alcázar, M., Rangaswamy, C., Panda, R., Bitterling, J., Simsek, Y.J., Long, A.T., Bilyy, R., Krenn, V., Renné, C., Renné, T., et al.. (2017). Host DNases prevent vascular occlusion by neutrophil extracellular traps. Science 358, 1202–1206. 10.1126/science.aam8897. · DOI
  19. Fuchs, 2010, Extracellular DNA traps promote thrombosis, Proc. Natl. Acad. Sci. USA, 107, 15880, 10.1073/pnas.1005743107 · DOI
  20. Cook, 2020, Clonal hematopoiesis and inflammation: partners in leukemogenesis and comorbidity, Exp. Hematol., 83, 85, 10.1016/j.exphem.2020.01.011 · DOI
  21. Hidalgo, 2019, Leducq transatlantic network on clonal hematopoiesis and atherosclerosis, Circ. Res., 124, 481, 10.1161/CIRCRESAHA.119.314677 · DOI
  22. Wunderlich, 2018, Improved multilineage human hematopoietic reconstitution and function in NSGS mice, PLoS One, 13, 10.1371/journal.pone.0209034 · DOI
  23. McIntosh, 2015, Nonirradiated NOD,B6.SCID Il2rγ-/- Kit(W41/W41) (NBSGW) mice support multilineage engraftment of human hematopoietic cells, Stem Cell Rep., 4, 171, 10.1016/j.stemcr.2014.12.005 · DOI
  24. Parmley, 1987, Peroxidase-containing microgranules in human neutrophils: physical, morphological, cytochemical, and secretory properties, Blood, 70, 1630, 10.1182/blood.V70.5.1630.1630 · DOI
  25. Lévy, 2021, CD177, a specific marker of neutrophil activation, is associated with coronavirus disease 2019 severity and death, iScience, 24, 10.1016/j.isci.2021.102711 · DOI
  26. Källquist, 2008, The tetraspanin CD63 is involved in granule targeting of neutrophil elastase, Blood, 112, 3444, 10.1182/blood-2007-10-116285 · DOI
  27. Lizcano, 2017, Erythrocyte sialoglycoproteins engage Siglec-9 on neutrophils to suppress activation, Blood, 129, 3100, 10.1182/blood-2016-11-751636 · DOI
  28. Montaldo, 2022, Cellular and transcriptional dynamics of human neutrophils at steady state and upon stress, Nat. Immunol., 23, 1470, 10.1038/s41590-022-01311-1 · DOI
  29. Perez, 2020, Immunogenomic identification and characterization of granulocytic myeloid-derived suppressor cells in multiple myeloma, Blood, 136, 199, 10.1182/blood.2019004537 · DOI
  30. Wu, 2017, TET-mediated active DNA demethylation: mechanism, function and beyond, Nat. Rev. Genet., 18, 517, 10.1038/nrg.2017.33 · DOI · Paper page
  31. Buitrago, 2021, Impact of DNA methylation on 3D genome structure, Nat. Commun., 12, 3243, 10.1038/s41467-021-23142-8 · DOI
  32. Khoyratty, 2021, Distinct transcription factor networks control neutrophil-driven inflammation, Nat. Immunol., 22, 1093, 10.1038/s41590-021-00968-4 · DOI
  33. Grassi, 2018, Dynamics of transcription regulation in human bone marrow myeloid differentiation to mature blood neutrophils, Cell Rep., 24, 2784, 10.1016/j.celrep.2018.08.018 · DOI
  34. Kunimoto, 2012, Tet2 disruption leads to enhanced self-renewal and altered differentiation of fetal liver hematopoietic stem cells, Sci. Rep., 2, 273, 10.1038/srep00273 · DOI
  35. Nakauchi, 2022, The cell type–specific 5hmC landscape and dynamics of healthy human hematopoiesis and TET2-mutant preleukemia, Blood Cancer Discov., 3, 346, 10.1158/2643-3230.BCD-21-0143 · DOI · Paper page
  36. Papayannopoulos, 2010, Neutrophil elastase and myeloperoxidase regulate the formation of neutrophil extracellular traps, J. Cell Biol., 191, 677, 10.1083/jcb.201006052 · DOI · Paper page
  37. Urban, 2006, Neutrophil extracellular traps capture and kill Candida albicans yeast and hyphal forms, Cell. Microbiol., 8, 668, 10.1111/j.1462-5822.2005.00659.x · DOI
  38. Branzk, 2014, Neutrophils sense microbe size and selectively release neutrophil extracellular traps in response to large pathogens, Nat. Immunol., 15, 1017, 10.1038/ni.2987 · DOI · Paper page
  39. Urban, 2009, Neutrophil extracellular traps contain calprotectin, a cytosolic protein complex involved in host defense against Candida albicans, PLoS Pathog., 5, 10.1371/journal.ppat.1000639 · DOI
  40. Papayannopoulos, 2018, Neutrophil extracellular traps in immunity and disease, Nat. Rev. Immunol., 18, 134, 10.1038/nri.2017.105 · DOI
  41. Ko, 2011, Ten-eleven-translocation 2 (TET2) negatively regulates homeostasis and differentiation of hematopoietic stem cells in mice, Proc. Natl. Acad. Sci. USA, 108, 14566, 10.1073/pnas.1112317108 · DOI · Paper page
  42. Caiado, 2021, Inflammation as a regulator of hematopoietic stem cell function in disease, aging, and clonal selection, J. Exp. Med., 218, 1, 10.1084/jem.20201541 · DOI · Paper page
  43. Mian, 2021, Advances in human immune system mouse models for studying human hematopoiesis and cancer immunotherapy, Front. Immunol., 11, 10.3389/fimmu.2020.619236 · DOI
  44. Abarrategi, 2018, Modeling the human Bone Marrow niche in mice: From host bone marrow engraftment to bioengineering approaches, J Exp Med., 215, 729, 10.1084/jem.20172139 · DOI
  45. Minoda, 2017, Human CD141+ dendritic cell and CD1c+ dendritic cell undergo concordant early genetic programming after activation in humanized mice in vivo, Front. Immunol., 8, 1419, 10.3389/fimmu.2017.01419 · DOI
  46. Evren, 2021, Distinct developmental pathways from blood monocytes generate human lung macrophage diversity, Immunity, 54, 10.1016/j.immuni.2020.12.003 · DOI
  47. Rao, 2021, Dissecting ELANE neutropenia pathogenicity by human HSC gene editing, Cell Stem Cell, 28, 10.1016/j.stem.2020.12.015 · DOI
  48. Porwit, 2014, 28, 1793
  49. Bento, 2017, The use of flow cytometry in myelodysplastic syndromes: a review, Front. Oncol., 7, 270, 10.3389/fonc.2017.00270 · DOI
  50. Dawoud, 2020, Clonal myelopoiesis in the UK Biobank cohort: ASXL1 mutations are strongly associated with smoking, Leukemia, 34, 2660, 10.1038/s41375-020-0896-8 · DOI
  51. Kar, 2022, Genome-wide analyses of 200,453 individuals yield new insights into the causes and consequences of clonal hematopoiesis, Nat. Genet., 54, 1155, 10.1038/s41588-022-01121-z · DOI · Paper page
  52. Banks, 2021, Tet proteins regulate neutrophil granulation in zebrafish through demethylation of socs3b mRNA, Cell Rep., 34, 10.1016/j.celrep.2020.108632 · DOI · Paper page
  53. Ostrander, 2020, Divergent effects of Dnmt3a and Tet2 mutations on hematopoietic progenitor cell fitness, Stem Cell Rep., 14, 551, 10.1016/j.stemcr.2020.02.011 · DOI · Paper page
  54. Ito, 2019, Non-catalytic roles of Tet2 are essential to regulate hematopoietic stem and progenitor cell homeostasis, Cell Rep., 28, 10.1016/j.celrep.2019.07.094 · DOI · Paper page
  55. Ballesteros, 2020, Co-option of neutrophil fates by tissue environments, Cell, 183, 10.1016/j.cell.2020.10.003 · DOI
  56. Tsourouktsoglou, 2020, Histones, DNA, and citrullination promote neutrophil extracellular trap inflammation by regulating the localization and activation of TLR4, Cell Rep., 31, 10.1016/j.celrep.2020.107602 · DOI
  57. Hoenderdos, 2013, The neutrophil in chronic obstructive pulmonary disease?, Am. J. Respir. Cell Mol. Biol., 48, 531, 10.1165/rcmb.2012-0492TR · DOI
  58. Dicker, 2018, Neutrophil extracellular traps are associated with disease severity and microbiota diversity in patients with chronic obstructive pulmonary disease, J. Allergy Clin. Immunol., 141, 117, 10.1016/j.jaci.2017.04.022 · DOI
  59. Cimmino, 2017, Restoration of TET2 function blocks aberrant self-renewal and leukemia progression, Cell, 170, 10.1016/j.cell.2017.07.032 · DOI · Paper page
  60. Huerga Encabo, 2021, Infecting human hematopoietic stem and progenitor cells with SARS-CoV-2, Star Protoc., 2, 10.1016/j.xpro.2021.100903 · DOI
  61. Lindeboom, 2016, The rules and impact of nonsense-mediated mRNA decay in human cancers, Nat. Genet., 48, 1112, 10.1038/ng.3664 · DOI
  62. Hu, 2013, Crystal structure of TET2-DNA complex: insight into TET-mediated 5mC oxidation, Cell, 155, 1545, 10.1016/j.cell.2013.11.020 · DOI
  63. Gupta, 2020, Increased Complement Receptor-3 levels in monocytes and granulocytes distinguish COVID-19 patients with pneumonia from those with mild symptoms, Int. J. Infect. Dis., 99, 381, 10.1016/j.ijid.2020.08.004 · DOI
  64. Bagwell, 2020, Automated data cleanup for mass cytometry, Cytometry A, 97, 184, 10.1002/cyto.a.23926 · DOI
  65. Chevrier, 2018, Compensation of signal spillover in suspension and imaging mass cytometry, Cell Syst., 6
  66. Corces, 2017, An improved ATAC-seq protocol reduces background and enables interrogation of frozen tissues, Nat. Methods, 14, 959, 10.1038/nmeth.4396 · DOI · Paper page
  67. Berg, 2019, Ilastik: interactive machine learning for (bio)image analysis, Nat. Methods, 16, 1226, 10.1038/s41592-019-0582-9 · DOI
  68. Stirling, 2021, CellProfiler 4: improvements in speed, utility and usability, BMC Bioinformatics, 22, 433, 10.1186/s12859-021-04344-9 · DOI
  69. Meechan, 2022, Crosshair, semi-automated targeting for electron microscopy with a motorised ultramicrotome, eLife, 11, 1, 10.7554/eLife.80899 · DOI

Cited by

See all 81

Metadata

Authors
Huerga Encabo, H., Aramburu, I. V., Garcia-Albornoz, M., Piganeau, M., Wood, H., Song, A., Ferrelli, A., Sharma, A., Minutti, C. M., Domart, M.-C., Papazoglou, D., Gurashi, K., Llorian Sopena, M., Goldstone, R., Fallesen, T., Wang, Q., Ariza-McNaughton, L., Wiseman, D. H., Batta, K., Gupta, R., Papayannopoulos, V., & Bonnet, D.
Venue
Cell Stem Cell
Publisher
Elsevier BV
Published
2023-06
Volume
30
Issue
6
Pages
781-799.e9
ISSN
1934-5909
Cited by
81
References
16
Language
en
Funders
  • Kay Kendall Leukaemia Fund (KKL1397)
  • Wellcome Trust
  • Cancer Research UK (CC1045, CC1129)
  • MRC
  • Francis Crick Institute

About these checks

Registry, retraction, Cites and statistics results are computed, not judged, with one exception: a printed reference that no index lists is read once by a model before it counts as a citation error. Claims are extracted by a model and kept only when their quote appears verbatim in the text; each cited source is then checked, with a model’s help, for whether it says what the claim relies on. Those verdicts can be wrong — read the claim’s quote and the cited source before relying on one.

Statistics and arithmetic are recomputed, not judged.

Confidence bands are shown only for fields calibrated on our annotated test set. None is calibrated yet, so no band is shown.

What counts as a claim ›How we measure confidence ›How we check this ›

Are you an author, or do you see a problem with this page? Request a review

How to cite

Cite CoChat for the checks on this page, and the paper for its own findings.

This page
CoChat. (2026). Citation check: Loss of TET2 in human hematopoietic stem cells alters the development and function of neutrophils. https://app.cochat.ai/papers/10.1016/j.stem.2023.05.004
The paper
Huerga Encabo, H., Aramburu, I. V., Garcia-Albornoz, M., Piganeau, M., Wood, H., Song, A., Ferrelli, A., Sharma, A., Minutti, C. M., Domart, M.-C., Papazoglou, D., Gurashi, K., Llorian Sopena, M., Goldstone, R., Fallesen, T., Wang, Q., Ariza-McNaughton, L., Wiseman, D. H., Batta, K., . . . Bonnet, D. (2023). Loss of TET2 in human hematopoietic stem cells alters the development and function of neutrophils. Cell Stem Cell. https://doi.org/10.1016/j.stem.2023.05.004