Student or educator? Sign up with your school email and get 6 months of Pro free.
Cited by 13Ion Transport and Channel RegulationIon channel regulation and functionDrug Transport and Resistance Mechanisms

The DOI matches its Crossref record; 58 of the 58 references it cites were found in a registry or an index.

Synergistic activation of the human phosphate exporter XPR1 by KIDINS220 and inositol pyrophosphate

Open access
Zuo, Peng, Wang, Weize, Dai, Zonglin, Zheng, Jiye, Yu, Shang, Wang, Guangxi, Yin, Yue, Liang, Ling, Yin, Yuxin·2025·Nature Communications

Published version of a preprint

Abstract

Abstract Inorganic phosphate (Pi) is fundamental to life, and its intracellular concentration must be tightly regulated to prevent toxicity. XPR1, the only known phosphate exporter, plays a crucial role in maintaining this delicate balance. However, the mechanisms underlying the function and regulation of XPR1 remain elusive until now. Here we present cryo-electron microscopy structures of the human XPR1-KIDINS220 complex in both substrate-free closed states and substrate-bound outward-open states, as well as the structure of an XPR1 mutant alone in a substrate-bound inward-facing state. In the presence of inositol hexaphosphate (InsP6) and phosphate, the XPR1-KIDINS220 complex adopts an outward-open conformation. InsP6 binds both the SPX domain and the peripheral juxtamembrane regions of XPR1, indicative of an active phosphate-export state. Conversely, in the absence of either phosphate or InsP6, the complex assumes a closed state, where the extracellular half of transmembrane 9 occupies the outward cavity, and a C-terminal plug-in loop blocks the intracellular cavity. Notably, XPR1 without KIDINS220 adopts a closed state despite the presence of phosphate and InsP6. The functional mutagenesis experiments further demonstrate that InsP6, whose concentrations fluctuate in response to Pi availability, functions synergistically with KIDINS220 to regulate the phosphate export activity of XPR1. These findings not only elucidate the intricate mechanisms of cellular phosphate regulation but also hold promise for the development of targeted therapies for ovarian cancer, where XPR1 plays a significant role.

Overview

The claims and statistics of this paper haven’t been checked yet.

Run the check — free, no account needed. It reads the open-access text and checks the sources it cites.

A few free checks a day · papers already verified open instantly · results are public

Integrity signals

Registry

Crossref · 10.1038/s41467-025-58200-y

Cites

58 of 58 references verified0 citation errors · 0 not checkable

Statistics

Figures

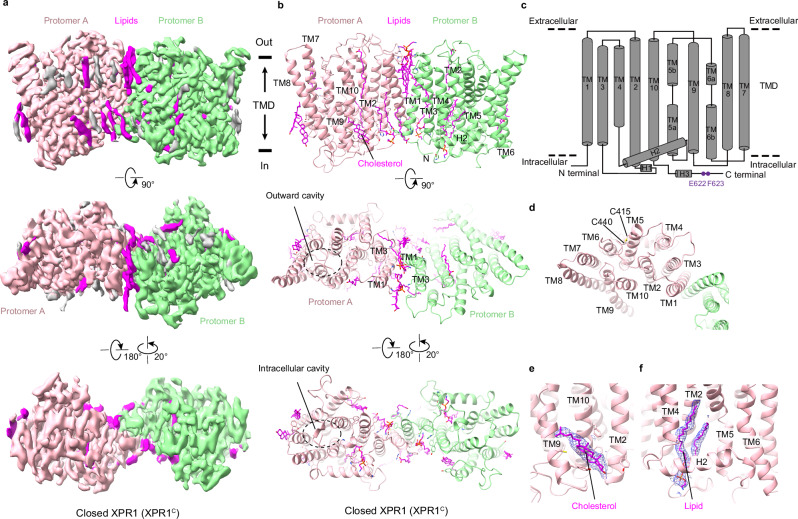
Fig. 1 Structure of human XPR1 in the closed state. Cryo-EM maps (a) and structural models (b) of the closed state XPR1 (XPR1C) from the side view, extracellular view, and intracellular view. The two protomers are colored light pink and light green. Lipids are shown in magenta. The approximate boundaries of the phospholipid bilayer are indicated as thick black lines. The outward cavity and intracellular cavity are labeled from the extracellular view and intracellular view in (b). c Schematic diagram of the secondary structure features of XPR1’s TMD. The Glu622/Phe623 motif near the C-terminal of XPR1 is labeled in purple. d The potential disulfide bond between C415 and C440. e Cryo-EM density map of the cholesterol at the pocket formed by TM2, TM9, and TM10, which is shown as blue meshes. f Cryo-EM density map of the lipid at the pocket formed by TM2, TM4, H2, and TM5, which is shown as blue meshes.
Fig. 1 Structure of human XPR1 in the closed state. Cryo-EM maps (a) and structural models (b) of the closed state XPR1 (XPR1C) from the side view, extracellular view, and intracellular view. The two protomers are colored light pink and light green. Lipids are shown in magenta. The approximate boundaries of the phospholipid bilayer are indicated as thick black lines. The outward cavity and intracellular cavity are labeled from the extracellular view and intracellular view in (b). c Schematic diagram of the secondary structure features of XPR1’s TMD. The Glu622/Phe623 motif near the C-terminal of XPR1 is labeled in purple. d The potential disulfide bond between C415 and C440. e Cryo-EM density map of the cholesterol at the pocket formed by TM2, TM9, and TM10, which is shown as blue meshes. f Cryo-EM density map of the lipid at the pocket formed by TM2, TM4, H2, and TM5, which is shown as blue meshes.CC BY-NC-ND · PubMed Central
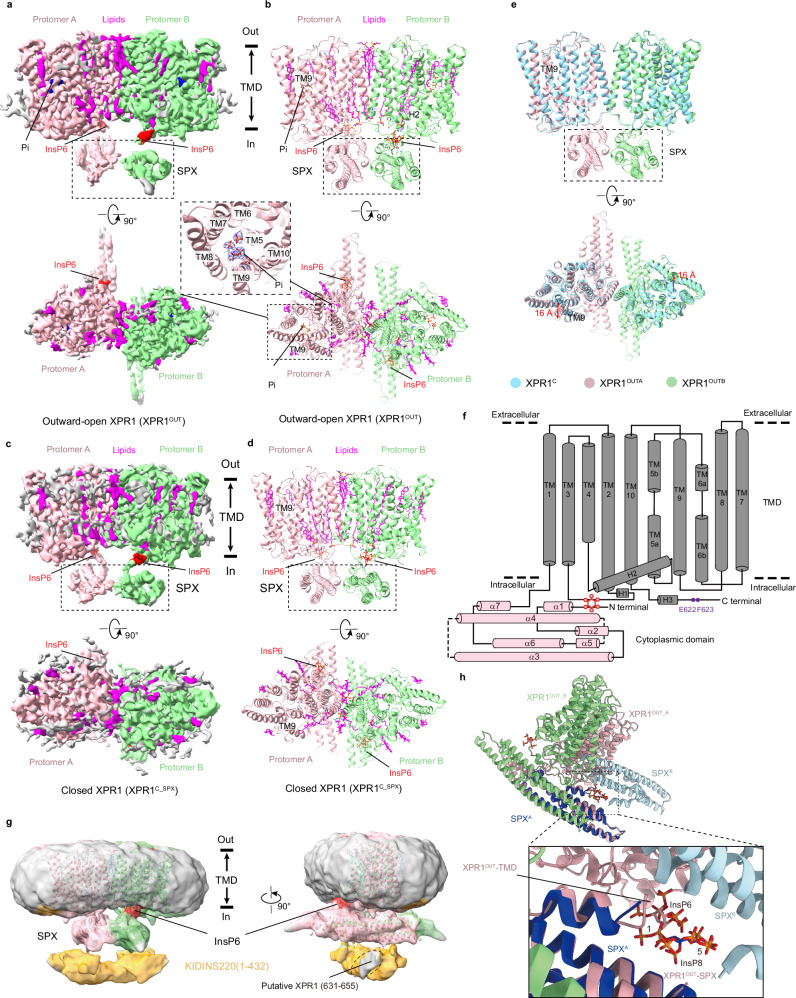
Fig. 2 Structure of human XPR1 in the outward-open state. Cryo-EM maps (a) and structural models (b) of the outward-open state XPR1 (XPR1OUT) from the side view and extracellular view. The two protomers of XPR1, lipids, and InsP6 molecules are colored light pink, light green, magenta, and red, respectively. The densities of the Pi are shown as blue meshes as an insert. Cryo-EM maps (c) and structural models (d) of the closed state XPR1 with SPX (XPR1C_SPX) from the side view and extracellular view. The color schemes are the same as in (a, b). e Structural comparison of XPR1C (cyan) and XPR1OUT (light pink and light green), superimposed based on the TMDs. f Schematic diagram of the secondary structure features of full-length XPR1OUT. The TMD and the SPX domains are presented in gray and pink. The Glu622/Phe623 motif near the C-terminal of XPR1 is labeled in purple. InsP6 is labeled in red. g Schematic diagram of the binding between KIDINS220 (1–432) and XPR1 in the outward-open state conformation. The XPR1OUT atomic model was superimposed into the XPR1OUT state density map after an additional two rounds of 3D classification at a low counter level. The two protomers of XPR1. and InsP6 molecules are presented in light pink, light green, and red, respectively. The cryo-EM density maps of XPR1 and KIDINS220 at low counter level are shown in transparent mode and colored gray and orange, respectively. The binding pattern is based on the Alphafold2 prediction result presented in Supplementary Fig. 1a, b. h Superimposition of our XPR1OUT structure with the previously reported XPR1-SPX-1,5-InsP8 crystal structure by aligning one of the SPX domains. The InsP6 molecules and the protomer of XPR1OUT_A were colored in light pink and the protomer of XPR1OUT_B in light green. The InsP8 molecule and the SPXA protomer of the XPR1-SPX-1,5-InsP8 complex were colored in dark blue, and the SPXB protomer in light blue.
Fig. 2 Structure of human XPR1 in the outward-open state. Cryo-EM maps (a) and structural models (b) of the outward-open state XPR1 (XPR1OUT) from the side view and extracellular view. The two protomers of XPR1, lipids, and InsP6 molecules are colored light pink, light green, magenta, and red, respectively. The densities of the Pi are shown as blue meshes as an insert. Cryo-EM maps (c) and structural models (d) of the closed state XPR1 with SPX (XPR1C_SPX) from the side view and extracellular view. The color schemes are the same as in (a, b). e Structural comparison of XPR1C (cyan) and XPR1OUT (light pink and light green), superimposed based on the TMDs. f Schematic diagram of the secondary structure features of full-length XPR1OUT. The TMD and the SPX domains are presented in gray and pink. The Glu622/Phe623 motif near the C-terminal of XPR1 is labeled in purple. InsP6 is labeled in red. g Schematic diagram of the binding between KIDINS220 (1–432) and XPR1 in the outward-open state conformation. The XPR1OUT atomic model was superimposed into the XPR1OUT state density map after an additional two rounds of 3D classification at a low counter level. The two protomers of XPR1. and InsP6 molecules are presented in light pink, light green, and red, respectively. The cryo-EM density maps of XPR1 and KIDINS220 at low counter level are shown in transparent mode and colored gray and orange, respectively. The binding pattern is based on the Alphafold2 prediction result presented in Supplementary Fig. 1a, b. h Superimposition of our XPR1OUT structure with the previously reported XPR1-SPX-1,5-InsP8 crystal structure by aligning one of the SPX domains. The InsP6 molecules and the protomer of XPR1OUT_A were colored in light pink and the protomer of XPR1OUT_B in light green. The InsP8 molecule and the SPXA protomer of the XPR1-SPX-1,5-InsP8 complex were colored in dark blue, and the SPXB protomer in light blue.CC BY-NC-ND · PubMed Central
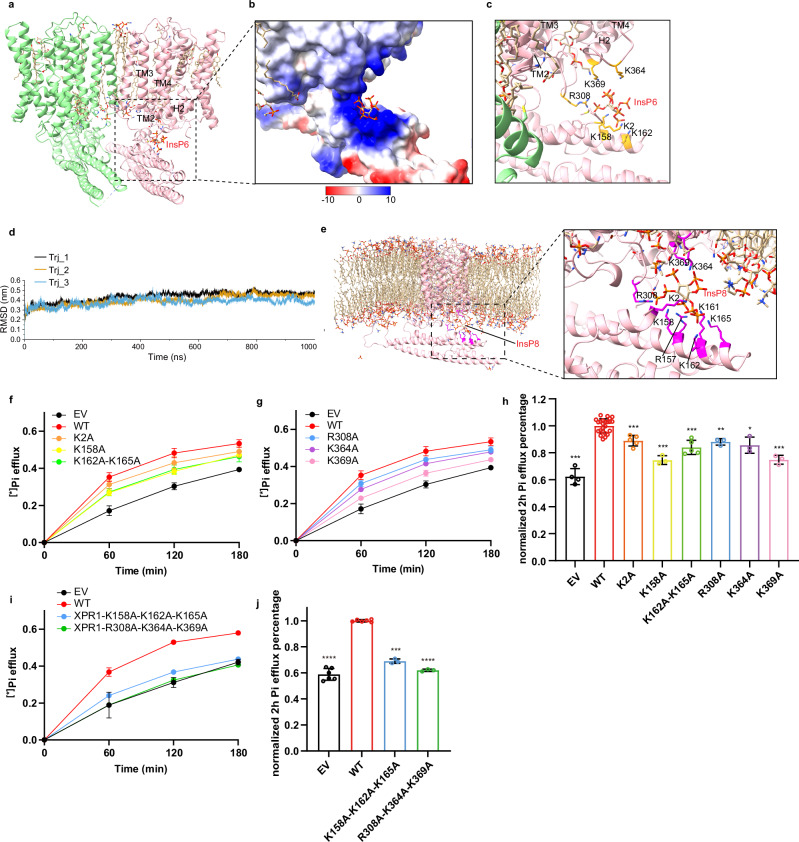
Fig. 3 Inositol pyrophosphate bound to the SPX domain and peripheric juxtamembrane sides. a One InsP6 molecule bound to an XPR1 protomer is presented in stick representation, and the lipid molecules are shown likewise, with carbon backbones colored in yellow. b The electrostatic surface around InsP6. InsP6 molecule is displayed as sticks. c Interactions between InsP6 and the surrounding residues from the SPX domain and the TMD. d The r.m.s.d. of backbone of XPR1 during 1000 ns simulation. The r.m.s.d. values of three replicates are overlaid and plotted separately. e The binding configurations of InsP8 in three trajectories extracted from one of 1000 ns simulations. Interactions between InsP8 and the surrounding residues (magenta) from the SPX domain and TMD are shown in sticks. 32Pi efflux of EV, WT-XPR1, and XPR1 mutants in the InsP6 binding pocket at the SPX domain (f) or TMD (g). The numbers of biologically independent experiments are identical with (h). h 32P efflux percentages of EV and XPR1 mutants in (f, g) at 2 h normalized against WT-XPR1. From left to right: n = 4, 24, 5, 3, 5, 3, 3, and 3 biologically independent experiments; P values are 4 × 10⁻⁴, 1, 1 × 10⁻³, 6 × 10⁻⁴, 1 × 10⁻³, 1.1 × 10⁻³, 0.0428, and 8 × 10⁻⁴. i 32Pi efflux of EV, WT-XPR1, and XPR1 triple-mutation mutants in the InsP6 binding pocket at the SPX domain or TMD. The numbers of biologically independent experiments are identical with (j). j 32P efflux percentages of EV and XPR1 mutants in (i) at 2 h normalized against WT-XPR1. From left to right: n = 6, 6, 3, and 3 biologically independent experiments; P values are <1 × 10⁻⁴, 1, 2 × 10⁻⁴, and <1 × 10⁻⁴. Data are shown as mean ± s.d. in (f–j). P values (ns ≥ 0.05, *P < 0.05, **P < 0.01, ***P < 1 × 10⁻³, ****P < 1 × 10⁻⁴) were obtained by two-tailed unpaired t-test with Welch’s correction in (h, j).
Fig. 3 Inositol pyrophosphate bound to the SPX domain and peripheric juxtamembrane sides. a One InsP6 molecule bound to an XPR1 protomer is presented in stick representation, and the lipid molecules are shown likewise, with carbon backbones colored in yellow. b The electrostatic surface around InsP6. InsP6 molecule is displayed as sticks. c Interactions between InsP6 and the surrounding residues from the SPX domain and the TMD. d The r.m.s.d. of backbone of XPR1 during 1000 ns simulation. The r.m.s.d. values of three replicates are overlaid and plotted separately. e The binding configurations of InsP8 in three trajectories extracted from one of 1000 ns simulations. Interactions between InsP8 and the surrounding residues (magenta) from the SPX domain and TMD are shown in sticks. 32Pi efflux of EV, WT-XPR1, and XPR1 mutants in the InsP6 binding pocket at the SPX domain (f) or TMD (g). The numbers of biologically independent experiments are identical with (h). h 32P efflux percentages of EV and XPR1 mutants in (f, g) at 2 h normalized against WT-XPR1. From left to right: n = 4, 24, 5, 3, 5, 3, 3, and 3 biologically independent experiments; P values are 4 × 10⁻⁴, 1, 1 × 10⁻³, 6 × 10⁻⁴, 1 × 10⁻³, 1.1 × 10⁻³, 0.0428, and 8 × 10⁻⁴. i 32Pi efflux of EV, WT-XPR1, and XPR1 triple-mutation mutants in the InsP6 binding pocket at the SPX domain or TMD. The numbers of biologically independent experiments are identical with (j). j 32P efflux percentages of EV and XPR1 mutants in (i) at 2 h normalized against WT-XPR1. From left to right: n = 6, 6, 3, and 3 biologically independent experiments; P values are <1 × 10⁻⁴, 1, 2 × 10⁻⁴, and <1 × 10⁻⁴. Data are shown as mean ± s.d. in (f–j). P values (ns ≥ 0.05, *P < 0.05, **P < 0.01, ***P < 1 × 10⁻³, ****P < 1 × 10⁻⁴) were obtained by two-tailed unpaired t-test with Welch’s correction in (h, j).CC BY-NC-ND · PubMed Central
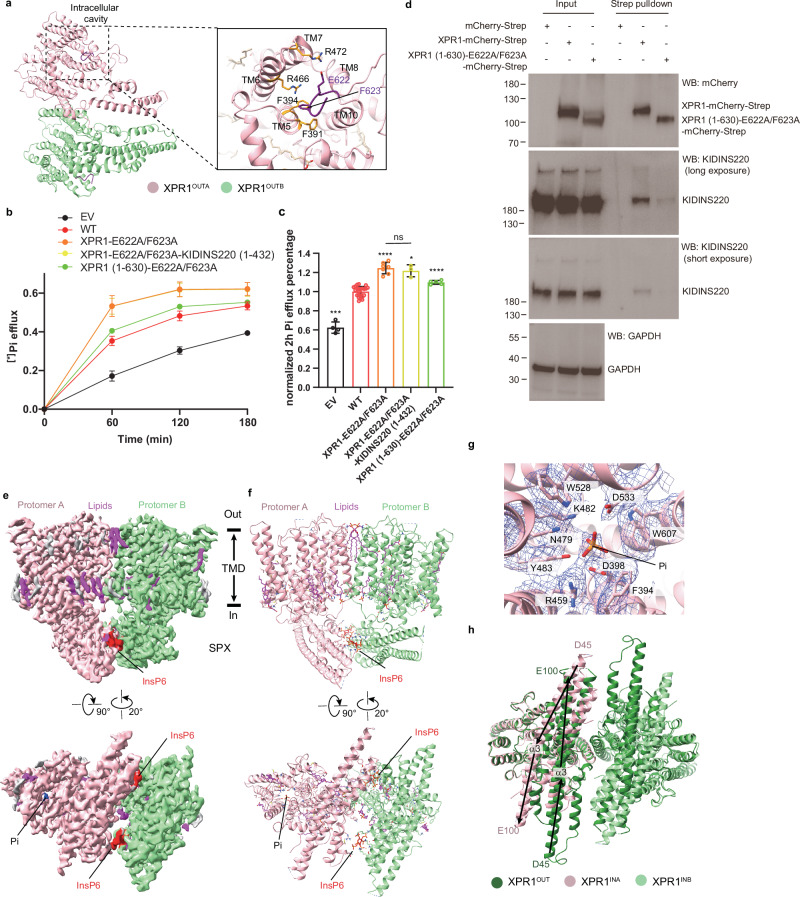
Fig. 4 The C-terminal Glu622/Phe623 motif blocks the intracellular cavity. a The Glu622/Phe623 motif and the cavity-forming helices from the TMD, i.e., TMs 5, 6, 7, 8, and 10. The Glu622/Phe623 motif is colored in purple. Putative interactive residues are displayed as sticks. b 32Pi efflux of EV, WT-XPR1 and XPR1 mutants in the C-terminal plug-in loop. The numbers of biologically independent experiments are identical to (c). c 32P efflux percentages of EV and XPR1 mutants in (b) at 2 h normalized against WT-XPR1. From left to right: n = 4, 24, 7, 3, and 5 biologically independent experiments. P values are 4 × 10⁻⁴, 1, <1 × 10⁻⁴, 0.0191, and <1 × 10⁻⁴. Data are shown as mean ± s.d. in (b, c). P values were obtained by a two-tailed unpaired t-test with Welch’s correction in (c). d Western blot analysis of the binding capacity between endogenous KIDINS220 and over-expressed WT-XPR1 or XPR1 (1–630)-E622A/F623A in HEK293T cells using co-immunoprecipitation. n = 1 experiment representative of n = 2 independent transfections. Cryo-EM maps (e) and structural models (f) of the inward-facing XPR1-E622A/F623A mutant (XPR1IN) from side view and intracellular view. The color schemes are the same as in Figs. 2a, b. g The densities of Pi and the surrounding residues at the intracellular cavity are shown as blue meshes. h Structural comparison of XPR1OUT (green) and XPR1IN (light pink and light green), superimposed based on the TMD. The directions of the α3 helix backbones are indicated by arrows. The amino acid residues at the N- and C- ends of the α3 helices are labeled. Taking the α3 helix as an example, the SPX domain rotates nearly 180°.
Fig. 4 The C-terminal Glu622/Phe623 motif blocks the intracellular cavity. a The Glu622/Phe623 motif and the cavity-forming helices from the TMD, i.e., TMs 5, 6, 7, 8, and 10. The Glu622/Phe623 motif is colored in purple. Putative interactive residues are displayed as sticks. b 32Pi efflux of EV, WT-XPR1 and XPR1 mutants in the C-terminal plug-in loop. The numbers of biologically independent experiments are identical to (c). c 32P efflux percentages of EV and XPR1 mutants in (b) at 2 h normalized against WT-XPR1. From left to right: n = 4, 24, 7, 3, and 5 biologically independent experiments. P values are 4 × 10⁻⁴, 1, <1 × 10⁻⁴, 0.0191, and <1 × 10⁻⁴. Data are shown as mean ± s.d. in (b, c). P values were obtained by a two-tailed unpaired t-test with Welch’s correction in (c). d Western blot analysis of the binding capacity between endogenous KIDINS220 and over-expressed WT-XPR1 or XPR1 (1–630)-E622A/F623A in HEK293T cells using co-immunoprecipitation. n = 1 experiment representative of n = 2 independent transfections. Cryo-EM maps (e) and structural models (f) of the inward-facing XPR1-E622A/F623A mutant (XPR1IN) from side view and intracellular view. The color schemes are the same as in Figs. 2a, b. g The densities of Pi and the surrounding residues at the intracellular cavity are shown as blue meshes. h Structural comparison of XPR1OUT (green) and XPR1IN (light pink and light green), superimposed based on the TMD. The directions of the α3 helix backbones are indicated by arrows. The amino acid residues at the N- and C- ends of the α3 helices are labeled. Taking the α3 helix as an example, the SPX domain rotates nearly 180°.CC BY-NC-ND · PubMed Central
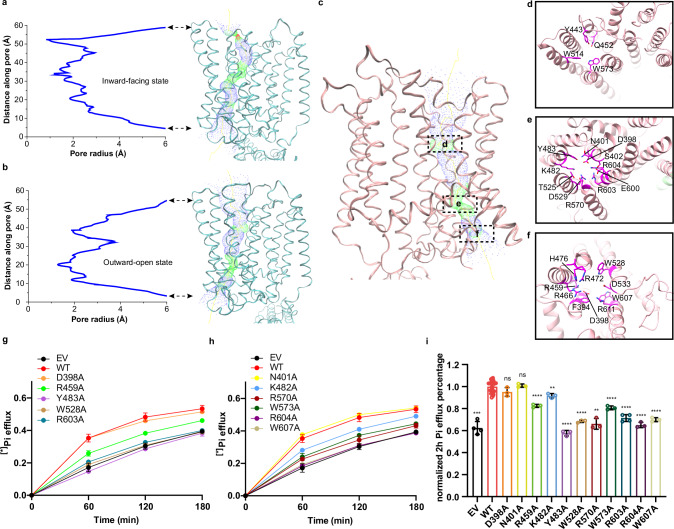
Fig. 5 Putative phosphate ion pore. Plots of the pore radius as a function of the pore axis of XPR1IN (a) and XPR1OUT (b). The pore-lining surfaces were calculated using the program HOLE257 and depicted on ribbon models of the XPR1IN (a) and XPR1OUT (b). c The phosphate ion transport pore of XPR1OUT. The critical regions of the pore are labeled with dotted boxes. The extracellular views (d, e) and intracellular view (f) of the cross sections through the ion-transporting pore at indicated positions in (c). The ribbon is colored as in (c). The conserved pore-lining residues are shown in sticks and colored in magenta. g, h 32Pi efflux of EV, WT-XPR1 and XPR1 mutants in the phosphate ion transport pores. The numbers of biologically independent experiments are identical with (i). i 32P efflux percentages of EV and XPR1 mutants in (g, h) at 2 h normalized against WT-XPR1. From left to right: n = 4, 24, 3, 3, 3, 3, 3, 3, 3, 3, 4, 3, and 3 biologically independent experiments. P values are 4 × 10⁻⁴, 1, 0.1552, 0.5686, <1 × 10⁻⁴, 1.4 × 10⁻³, <1 × 10⁻⁴, <1 × 10⁻⁴, 2.8 × 10⁻³, <1 × 10⁻⁴, <1 × 10⁻⁴, <1 × 10⁻⁴, and <1 × 10⁻⁴. Data are shown as mean ± s.d. in (g–i). P values were obtained by a two-tailed unpaired t-test with Welch’s correction in (i).
Fig. 5 Putative phosphate ion pore. Plots of the pore radius as a function of the pore axis of XPR1IN (a) and XPR1OUT (b). The pore-lining surfaces were calculated using the program HOLE257 and depicted on ribbon models of the XPR1IN (a) and XPR1OUT (b). c The phosphate ion transport pore of XPR1OUT. The critical regions of the pore are labeled with dotted boxes. The extracellular views (d, e) and intracellular view (f) of the cross sections through the ion-transporting pore at indicated positions in (c). The ribbon is colored as in (c). The conserved pore-lining residues are shown in sticks and colored in magenta. g, h 32Pi efflux of EV, WT-XPR1 and XPR1 mutants in the phosphate ion transport pores. The numbers of biologically independent experiments are identical with (i). i 32P efflux percentages of EV and XPR1 mutants in (g, h) at 2 h normalized against WT-XPR1. From left to right: n = 4, 24, 3, 3, 3, 3, 3, 3, 3, 3, 4, 3, and 3 biologically independent experiments. P values are 4 × 10⁻⁴, 1, 0.1552, 0.5686, <1 × 10⁻⁴, 1.4 × 10⁻³, <1 × 10⁻⁴, <1 × 10⁻⁴, 2.8 × 10⁻³, <1 × 10⁻⁴, <1 × 10⁻⁴, <1 × 10⁻⁴, and <1 × 10⁻⁴. Data are shown as mean ± s.d. in (g–i). P values were obtained by a two-tailed unpaired t-test with Welch’s correction in (i).CC BY-NC-ND · PubMed Central
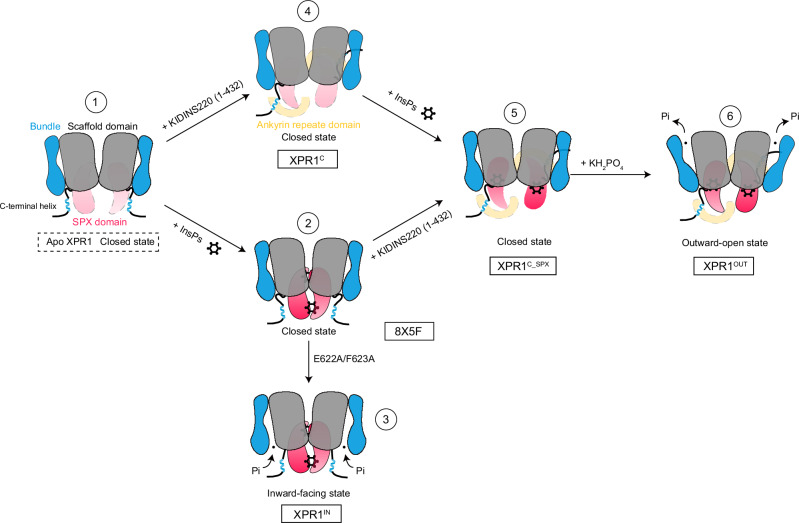
Fig. 6 Putative activation model for the InsPs and KIDINS220 modulated phosphate exporter in XPR1. A schematic representation of the proposed XPR1 activation mechanism. Under non-activating conditions, the TMD is locked in a closed state (State 1). When KIDINS220 is absent, elevated InsPs in the cytoplasm bind between the two SPX domains of XPR1, locking XPR1 in a closed conformation (State 2). Mutation of the Glu622/Phe623 motif which blocks the intracellular cavity induces XPR1 to transition to an inward-facing conformation (State 3). In the first three states, the flexible C-terminal helix (631–655) resides near the SPX domain. In the presence of KIDINS220, the C-terminal helix binds with KIDINS220 (1–432) and induces a further conformational change of the SPX domain possibly due to steric hindrance. Although the dynamics of the SPX domain are too strong to observe its specific orientation, subsequent results indicate that its conformation undergoes a 180° flip compared to State 2, with XPR1 still remaining in a closed conformation (State 4). InsPs bind at the interface between the SPX domain and the TMD, maintaining XPR1 in a closed conformation. However, this binding enhances the dynamics of the Glu622/Phe623 motif, thereby eliminating one of the barriers to activation (State 5). Upon the introduction of substrate phosphate ions, they promptly bind to XPR1, thereby inducing the conformational alteration of XPR1 into an outward-open state. This conformational change, in turn, promotes the export of these phosphate ions (State 6). Although the two halves of the XPR1 dimer in different states were depicted with the same behavior in our figure drawing, we hypothesize that their actual functional states might not be in synchronization. States 3–6 were observed in this study. State 2 is derived from PDB ID: 8X5F and State 1 is hypothesized. Created in BioRender. Zuo, P. (2025) https://BioRender.com/v23k582.
Fig. 6 Putative activation model for the InsPs and KIDINS220 modulated phosphate exporter in XPR1. A schematic representation of the proposed XPR1 activation mechanism. Under non-activating conditions, the TMD is locked in a closed state (State 1). When KIDINS220 is absent, elevated InsPs in the cytoplasm bind between the two SPX domains of XPR1, locking XPR1 in a closed conformation (State 2). Mutation of the Glu622/Phe623 motif which blocks the intracellular cavity induces XPR1 to transition to an inward-facing conformation (State 3). In the first three states, the flexible C-terminal helix (631–655) resides near the SPX domain. In the presence of KIDINS220, the C-terminal helix binds with KIDINS220 (1–432) and induces a further conformational change of the SPX domain possibly due to steric hindrance. Although the dynamics of the SPX domain are too strong to observe its specific orientation, subsequent results indicate that its conformation undergoes a 180° flip compared to State 2, with XPR1 still remaining in a closed conformation (State 4). InsPs bind at the interface between the SPX domain and the TMD, maintaining XPR1 in a closed conformation. However, this binding enhances the dynamics of the Glu622/Phe623 motif, thereby eliminating one of the barriers to activation (State 5). Upon the introduction of substrate phosphate ions, they promptly bind to XPR1, thereby inducing the conformational alteration of XPR1 into an outward-open state. This conformational change, in turn, promotes the export of these phosphate ions (State 6). Although the two halves of the XPR1 dimer in different states were depicted with the same behavior in our figure drawing, we hypothesize that their actual functional states might not be in synchronization. States 3–6 were observed in this study. State 2 is derived from PDB ID: 8X5F and State 1 is hypothesized. Created in BioRender. Zuo, P. (2025) https://BioRender.com/v23k582.CC BY-NC-ND · PubMed Central

Verification

Claims the paper makes

The claims and statistics of this paper haven’t been checked yet.

Run the check — free, no account needed. It reads the open-access text and checks the sources it cites.

A few free checks a day · papers already verified open instantly · results are public

Self-check

Percentages, sums and reported differences re-computed from the paper’s own numbers.

The self-check needs the paper’s full text.

Citations

Cites

Show all 58 references

Metadata

Authors
Zuo, P., Wang, W., Dai, Z., Zheng, J., Yu, S., Wang, G., Yin, Y., Liang, L., & Yin, Y.
Affiliations
Peking University (CN)
Corresponding author
  • Yin, Yue
  • Liang, Ling
Venue
Nature Communications
Published
2025-03-24
Volume
16
Issue
1
Pages
2879-2879
ISSN
2041-1723 (ISSN-L)
OpenAlex
W4408788073
Cited by
13
References
58
Citations by year
2026: 7 · 2025: 6
FWCI
3.91
Type
journal article
Language
en
Open access
Licence
Locations
  • Nature Communications (publishedVersion, cc-by-nc-nd)
  • bioRxiv (Cold Spring Harbor Laboratory) (acceptedVersion)
  • PubMed Central (publishedVersion, cc-by-nc-nd)
  • PubMed (publishedVersion)
  • RePEc: Research Papers in Economics (submittedVersion)
  • DOAJ (DOAJ: Directory of Open Access Journals) (submittedVersion, cc-by-sa)
Funders
National Natural Science Foundation of China (82030081, 32171224)
Topics
  • Life Sciences › Biochemistry, Genetics and Molecular Biology › Molecular Biology › Ion Transport and Channel Regulation
  • Life Sciences › Biochemistry, Genetics and Molecular Biology › Molecular Biology › Ion channel regulation and function
  • Health Sciences › Medicine › Oncology › Drug Transport and Resistance Mechanisms
Keywords
XPR1, Kidins220, phytic acid, inositol pyrophosphates, SPX domain, juxtamembrane region, inorganic phosphate homeostasis, cryo-EM structure
MeSH terms
Protein Domains, Xenotropic and Polytropic Retrovirus Receptor, Humans, Inositol Phosphates, Membrane Proteins, Models, Molecular, Phosphates, Phytic Acid, Protein Binding, Protein Conformation, Cryoelectron Microscopy, Receptors, G-Protein-Coupled, HEK293 Cells

About these checks

Registry, retraction, Cites and statistics results are computed, not judged, with one exception: a printed reference that no index lists is read once by a model before it counts as a citation error. Claims are extracted by a model and kept only when their quote appears verbatim in the text; each cited source is then checked, with a model’s help, for whether it says what the claim relies on. Those verdicts can be wrong — read the claim’s quote and the cited source before relying on one.

Statistics and arithmetic are recomputed, not judged.

Confidence bands are shown only for fields calibrated on our annotated test set. None is calibrated yet, so no band is shown.

What counts as a claim ›How we measure confidence ›How we check this ›

Are you an author, or do you see a problem with this page? Request a review

Data sources

Bibliographic data: Semantic Scholar, OpenAlex, Crossref.

Contains information from the Semantic Scholar Academic Graph Datasets, made available under the ODC Attribution License (ODC-BY 1.0).

Semantic Scholar’s data is described in: Kinney, R., et al. (2023). The Semantic Scholar Open Data Platform. arXiv:2301.10140.