

The DOI matches its Crossref record; 8 of the 8 references it cites were found in a registry or an index.
Inhibition of tau neuronal internalization using anti-tau single domain antibodies
Abstract
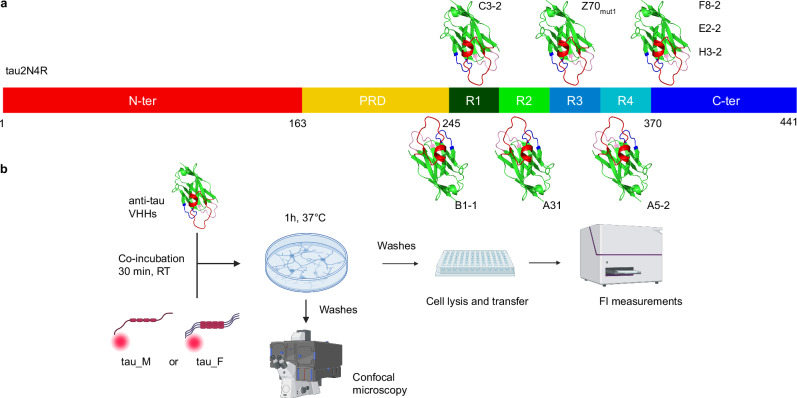
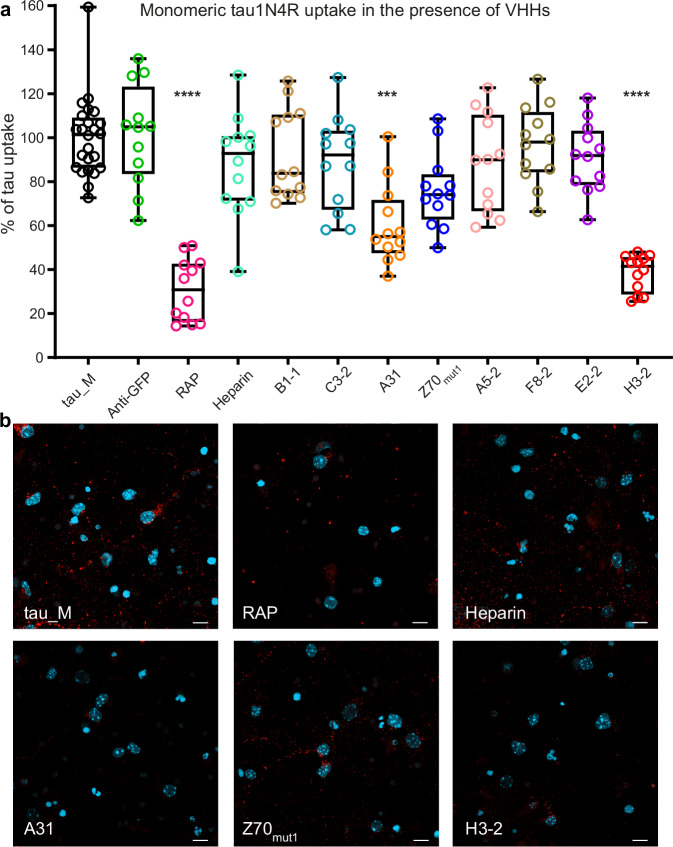
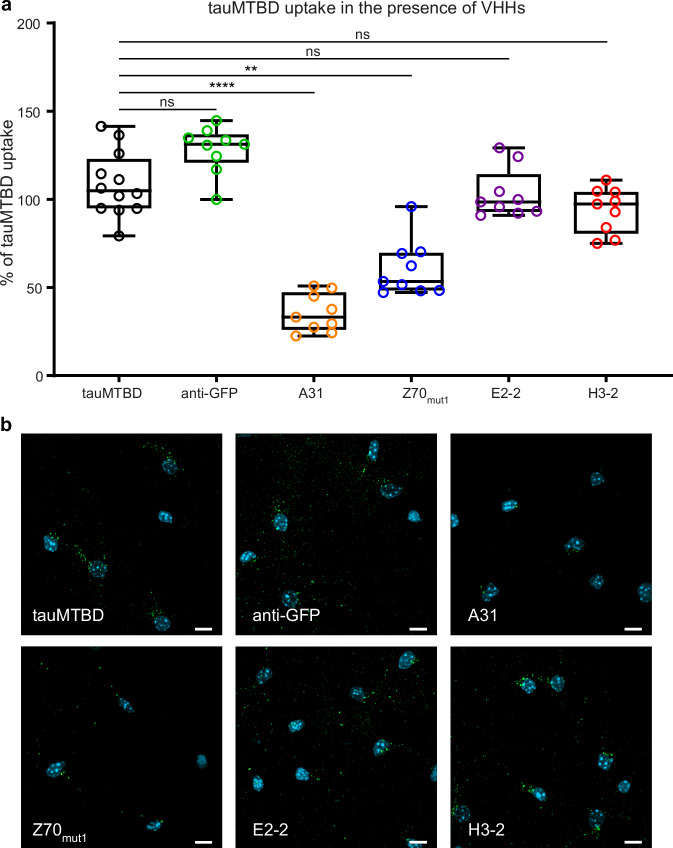
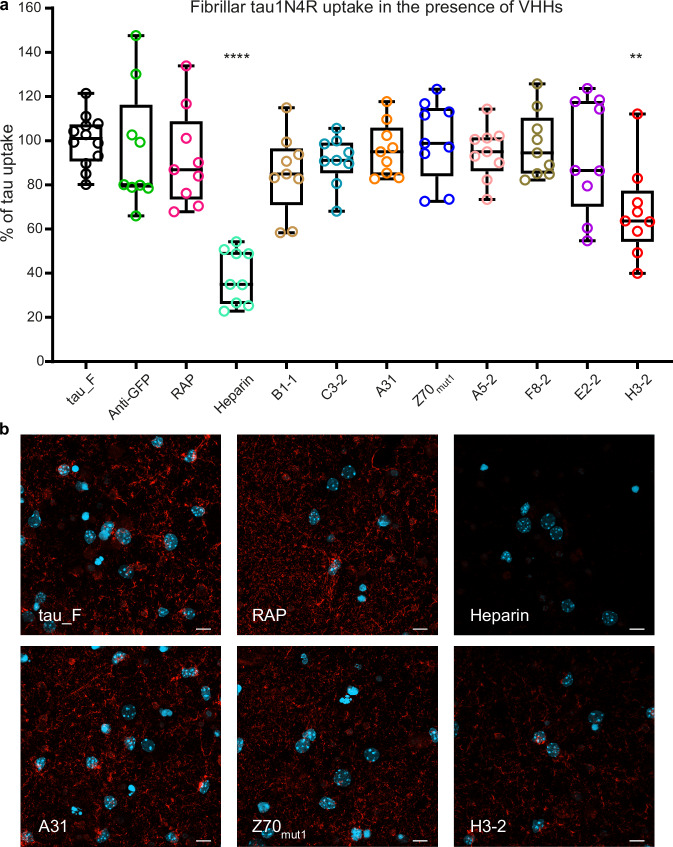
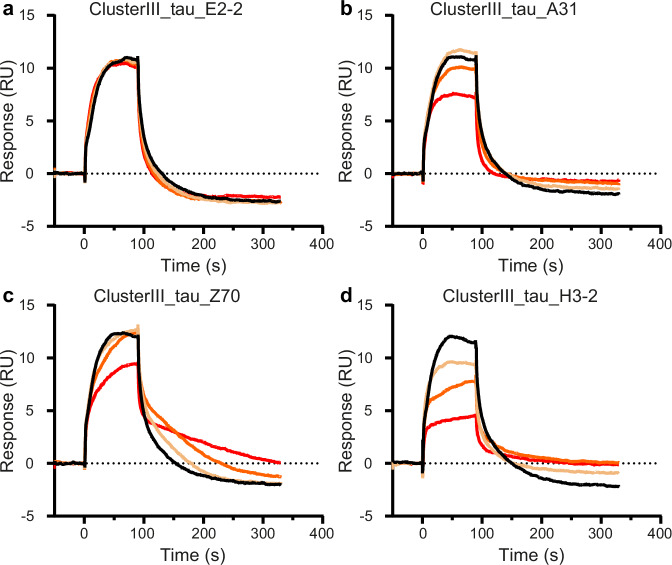
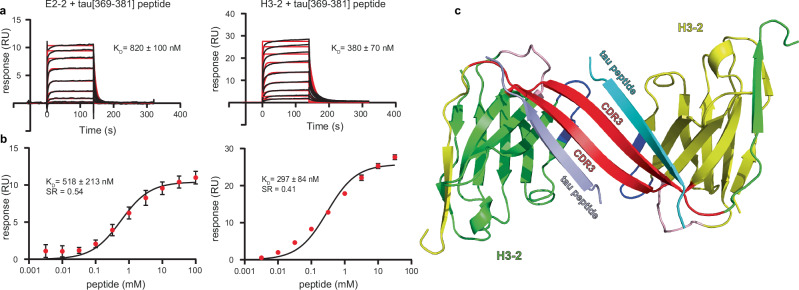
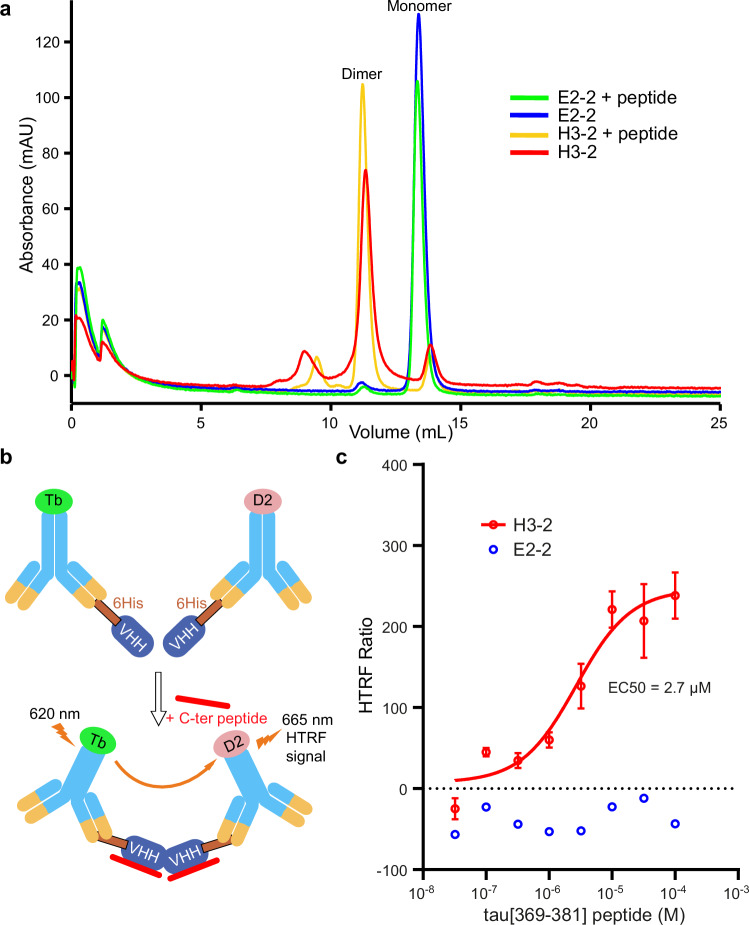
In Alzheimer’s disease, tau pathology spreads across brain regions as the disease progresses. Intracellular tau can be released and taken up by nearby neurons. We evaluated single domain anti-tau antibodies, also called VHHs, as inhibitors of tau internalization. We identified three VHH inhibitors of tau uptake: A31, H3-2, and Z70 mut1. These VHHs compete with the membrane protein LRP1, a major receptor mediating neuronal uptake of tau. A31 and Z70 mut1 bind to microtubule binding domain repeats, which are involved in the interaction with LRP1. VHH H3-2 is the only VHH from our library that reduces the internalization of both monomeric tau and tau fibrils. VHH H3-2 binds a C-terminal tau epitope with high affinity. Its three-dimensional structure in complex with a tau peptide reveals a unique binding mode as a VHH-swapped dimer. These anti-tau VHHs are interesting tools to study tau prion-like propagation in tauopathies and potentially develop novel biotherapies.
Overview
The claims and statistics of this paper haven’t been checked yet.
Run the check — free, no account needed. It reads the open-access text and checks the sources it cites.
Integrity signals
Registry
Cites
Statistics
Figures
Verification
Claims the paper makes
The claims and statistics of this paper haven’t been checked yet.
Run the check — free, no account needed. It reads the open-access text and checks the sources it cites.
Claims other papers make about this one
Each is checked against this paper’s own text: does it say what the citing paper says it does?
In the citing paper
“Our previous studies have shown that these VHHs interact with short tau epitopes.[19][20][21]”
From A Proline-Rich-Domain-Binding Single Domain Antibody Selectively Inhibits RNA-Induced Phase Separation of Tau (2026) · cites this paper as [20]
In the citing paper
“Single-cycle kinetics (SCK) experiments confirmed the VHH B1-1 binding to tauF3 (KD = 210 nM), consistent with the KD measured using tau2N4R (KD = 289 nM).20”
From A Proline-Rich-Domain-Binding Single Domain Antibody Selectively Inhibits RNA-Induced Phase Separation of Tau (2026) · cites this paper as [20]
Self-check
Percentages, sums and reported differences re-computed from the paper’s own numbers.
The self-check needs the paper’s full text.
Citations
Cites
Heparan sulfate proteoglycans mediate internalization and propagation of specific proteopathic seeds
Holmes, B. B., DeVos, S. L., Kfoury, N., Li, M., Jacks, R., Yanamandra, K., Ouidja, M. O., Brodsky, F. M., Marasa, J., Bagchi, D. P., et al. (2013) · Proceedings of the National Academy of Sciences · doi:10.1073/pnas.1301440110 · Cited by 859
The release and trans-synaptic transmission of Tau via exosomes
Wang, Y., Balaji, V., Kaniyappan, S., Krüger, L., Irsen, S., Tepper, K., Chandupatla, R., Maetzler, W., Schneider, A., Mandelkow, E., et al. (2017) · Molecular Neurodegeneration · doi:10.1186/s13024-016-0143-y · Cited by 674
LRP1 is a master regulator of tau uptake and spread
Rauch, J. N., Luna, G., Guzman, E., Audouard, M., Challis, C., Sibih, Y. E., Leshuk, C., Hernandez, I., Wegmann, S., Hyman, B. T., et al. (2020) · Nature · doi:10.1038/s41586-020-2156-5 · Cited by 541
Mirbaha, H., Holmes, B. B., Sanders, D. W., Bieschke, J., & Diamond, M. I. (2015) · Journal of Biological Chemistry · doi:10.1074/jbc.m115.652693 · Cited by 215
Extracellular Monomeric Tau Protein Is Sufficient to Initiate the Spread of Tau Protein Pathology
Michel, C. H., Kumar, S., Pinotsi, D., Tunnacliffe, A., St. George-Hyslop, P., Mandelkow, E., Mandelkow, E.-M., Kaminski, C. F., & Kaminski Schierle, G. S. (2014) · Journal of Biological Chemistry · doi:10.1074/jbc.m113.515445 · Cited by 165
Cooper, J. M., Lathuiliere, A., Migliorini, M., Arai, A. L., Wani, M. M., Dujardin, S., Muratoglu, S. C., Hyman, B. T., & Strickland, D. K. (2021) · Journal of Biological Chemistry · doi:10.1016/j.jbc.2021.100715 · Cited by 122
Galas, M.-C., Dourlen, P., Bégard, S., Ando, K., Blum, D., Hamdane, M., & Buée, L. (2006) · Journal of Biological Chemistry · doi:10.1074/jbc.m601849200 · Cited by 97
Molecular basis of β-amyloid oligomer recognition with a conformational antibody fragment
Morgado, I., Wieligmann, K., Bereza, M., Rönicke, R., Meinhardt, K., Annamalai, K., Baumann, M., Wacker, J., Hortschansky, P., Malešević, M., et al. (2012) · Proceedings of the National Academy of Sciences · doi:10.1073/pnas.1206433109 · Cited by 80
Research works printed but not linked: 58
- Glynn, C., Rodriguez, J. A. & Hyman, B. T. The structural line between prion and ‘prion-like’: Insights from prion protein and tau. Curr. Opin. Neurobiol. 86, 102857 (2024). · DOI
- Zampar, S., Di Gregorio, S. E., Grimmer, G., Watts, J. C. & Ingelsson, M. ‘Prion-like’ seeding and propagation of oligomeric protein assemblies in neurodegenerative disorders. Front. Neurosci. 18, 1436262 (2024). · DOI
- Vazquez-Sanchez, S. et al. Frontotemporal dementia-like disease progression elicited by seeded aggregation and spread of FUS. Mol. Neurodegener. 19, 46 (2024). · DOI
- Pongrácová, E., Buratti, E. & Romano, M. Prion-like Spreading of Disease in TDP-43 Proteinopathies. Brain Sci. 14, 1132 (2024). · DOI
- Neupane, K. et al. Direct observation of prion-like propagation of protein misfolding templated by pathogenic mutants. Nat. Chem. Biol. 20, 1220–1226 (2024). · DOI
- Tullo, S. et al. Neuroanatomical and cognitive biomarkers of alpha-synuclein propagation in a mouse model of synucleinopathy prior to onset of motor symptoms. J. Neurochem. 168, 1546–1564 (2024). · DOI
- Mudher, A. et al. What is the evidence that tau pathology spreads through prion-like propagation? Acta Neuropathol. Commun. 5, 99 (2017). · DOI · Paper page
- Colin, M. et al. From the prion-like propagation hypothesis to therapeutic strategies of anti-tau immunotherapy. Acta Neuropathol 139, 3–25 (2020). · DOI · Paper page
- De La-Rocque, S., Moretto, E., Butnaru, I. & Schiavo, G. Knockin’ on heaven’s door: Molecular mechanisms of neuronal tau uptake. J. Neurochem. 156, 563–588 (2021). · DOI
- Rauch, J. N. et al. Tau Internalization is Regulated by 6-O Sulfation on Heparan Sulfate Proteoglycans (HSPGs). Sci. Rep. 8, 6382 (2018). · DOI · Paper page
- Stopschinski, B. E. et al. Specific glycosaminoglycan chain length and sulfation patterns are required for cell uptake of tau versus α-synuclein and β-amyloid. J. Biol. Chem. 293, 10826–10840 (2018). · DOI · Paper page
- Marvian, A. T. et al. Distinct regulation of Tau Monomer and aggregate uptake and intracellular accumulation in human neurons. Mol. Neurodegener. 19, 100 (2024). · DOI
- Hamers-Casterman, C. et al. Naturally occurring antibodies devoid of light chains. Nature 363, 446–448 (1993). · DOI · Paper page
- Monté, D. et al. Crystal structure of human Mediator subunit MED23. Nat. Commun. 9, 3389 (2018). · DOI
- Rasmussen, S. G. F. et al. Crystal structure of the β2Adrenergic receptor-Gs protein complex. Nature 477, 549–555 (2011). · DOI · Paper page
- Robertson, M. J. et al. Structure determination of inactive-state GPCRs with a universal nanobody. Nat. Struct. Mol. Biol. 29, 1188–1195 (2022). · DOI
- D’Huyvetter, M. et al. Phase I trial of 131I-GMIB-Anti-HER2-VHH1, a new promising candidate for HER2-targeted radionuclide therapy in Breast cancer patients. J. Nucl. Med. 62, 1097–1105 (2021). · DOI
- Duray, E. et al. A non-internalised CD38-binding radiolabelled single-domain antibody fragment to monitor and treat multiple myeloma. J. Hematol. Oncol. 14, 183 (2021). · DOI
- De Genst, E. J. et al. Structure and properties of a complex of α-synuclein and a single-domain camelid antibody. J. Mol. Biol 402, 326–343 (2010). · DOI
- Guilliams, T. et al. Nanobodies raised against monomeric α-synuclein distinguish between fibrils at different maturation stages. J. Mol. Biol. 425, 2397–2411 (2013). · DOI
- Marino, M. et al. AAV‐mediated delivery of an anti‐BACE1 VHH alleviates pathology in an Alzheimer’s disease model. EMBO Mol. Med. 14, e09824 (2022). · DOI
- Li, T. et al. Camelid single-domain antibodies: A versatile tool for in vivo imaging of extracellular and intracellular brain targets. J. Control. Release 243, 1–10 (2016). · DOI
- Abskharon, R. et al. Structure-based design of nanobodies that inhibit seeding of Alzheimer’s patient-extracted tau fibrils. Proc. Natl. Acad. Sci. USA 120, e2300258120 (2023). · DOI
- Jiang, Y. et al. Single-domain antibody-based noninvasive in vivo imaging of α-synuclein or tau pathology. Sci. Adv. 9, eadf3775 (2023). · DOI
- Dupré, E. et al. Single domain antibody fFragments as new tools for the detection of neuronal tau protein in cells and in mice studies. ACS Chem. Neurosci. 10, 3997–4006 (2019). · DOI
- Danis, C. et al. Inhibition of Tau seeding by targeting Tau nucleation core within neurons with a single domain antibody fragment. Mol. Ther. 30, 1484–1499 (2022). · DOI · Paper page
- Mortelecque, J. et al. A selection and optimization strategy for single-domain antibodies targeting the PHF6 linear peptide within the tau intrinsically disordered protein. J. Biol. Chem. 300, 107163 (2024). · DOI · Paper page
- Benn, J. et al. Aggregate-selective removal of pathological tau by clustering-activated degraders. Science 385, 1009–1016 (2024). · DOI
- De Genst, E. et al. Strong in vivo maturation compensates for structurally restricted H3 loops in antibody repertoires. J. Biol. Chem. 280, 14114–14121 (2005). · DOI
- Evans, L. D. et al. Extracellular monomeric and aggregated tau efficiently enter human neurons through overlapping but distinct pathways. Cell Rep. 22, 3612–3624 (2018). · DOI
- Calafate, S., Flavin, W., Verstreken, P. & Moechars, D. Loss of bin1 promotes the propagation of tau pathology. Cell Rep. 17, 931–940 (2016). · DOI · Paper page
- Falcon, B., Noad, J., McMahon, H., Randow, F. & Goedert, M. Galectin-8-mediated selective autophagy protects against seeded tau aggregation. J. Biol. Chem. 293, 2438–2451 (2018). · DOI
- Cooper, J. M. et al. SORL1 is a receptor for tau that promotes tau seeding. J. Biol. Chem. 300, 107313 (2024). · DOI · Paper page
- Dujardin, S. et al. Ectosomes: a new mechanism for non-exosomal secretion of tau protein. PloS ONE 9, e100760 (2014). · DOI
- Bespalov, A., Courade, J.-P., Khiroug, L., Terstappen, G. C. & Wang, Y. A call for better understanding of target engagement in Tau antibody development. Drug Discov. Today 27, 103338 (2022). · DOI
- Mukadam, A. S. et al. Cytosolic antibody receptor TRIM21 is required for effective tau immunotherapy in mouse models. Science 379, 1336–1341 (2023). · DOI
- Gaikwad, S. et al. Nasal tau immunotherapy clears intracellular tau pathology and improves cognitive functions in aged tauopathy mice. Sci. Transl. Med. 16, eadj5958 (2024). · DOI
- McEwan, W. A. et al. Cytosolic Fc receptor TRIM21 inhibits seeded tau aggregation. Proc. Natl. Acad. Sci. USA 114, 574–579 (2017). · DOI · Paper page
- Rose, K. et al. Tau fibrils induce nanoscale membrane damage and nucleate cytosolic tau at lysosomes. Proc. Natl. Acad. Sci. USA 121, e2315690121 (2024). · DOI
- Mirbaha, H. et al. Inert and seed-competent tau monomers suggest structural origins of aggregation. ELife 7, e36584 (2018). · DOI
- Despres, C. et al. Major differences between the self-assembly and seeding behavior of heparin-induced and in vitro phosphorylated tau and their modulation by potential inhibitors. ACS Chem. Biol. 14, 1363–1379 (2019). · DOI
- Zhang, W. et al. Heparin-induced tau filaments are polymorphic and differ from those in Alzheimer’s and Pick’s diseases. ELife 8, e43584 (2019). · DOI · Paper page
- Sibille, N. et al. Structural impact of heparin binding to full-length Tau as studied by NMR spectroscopy. Biochemistry 45, 12560–12572 (2006). · DOI
- Peyvandi, F. et al. Caplacizumab for acquired thrombotic thrombocytopenic purpura. N. Engl. J. Med. 374, 511–522 (2016). · DOI
- Oyama, S. et al. A novel anti-TNF-α drug ozoralizumab rapidly distributes to inflamed joint tissues in a mouse model of collagen induced arthritis. Sci. Rep. 12, 18102 (2022). · DOI
- Wu, X. & Rapoport, T. A. Cryo-EM structure determination of small proteins by nanobody-binding scaffolds (Legobodies). Proc. Natl. Acad. Sci. USA 118, e2115001118 (2021). · DOI
- McArthur, N. et al. Development of a pan-tau multivalent nanobody that binds tau aggregation motifs and recognizes pathological tau aggregates. Biotechnol. Prog. 40, e3463 (2024). · DOI
- Albert, M. et al. Prevention of tau seeding and propagation by immunotherapy with a central tau epitope antibody. Brain J. Neurol. 142, 1736–1750 (2019). · DOI
- Courade, J.-P. et al. Epitope determines efficacy of therapeutic anti-Tau antibodies in a functional assay with human Alzheimer Tau. Acta Neuropathol. 136, 729–745 (2018). · DOI
- Moutel, S. et al. NaLi-H1: A universal synthetic library of humanized nanobodies providing highly functional antibodies and intrabodies. ELife 5, e16228 (2016). · DOI
- Moreira, G. G. et al. Dynamic interactions and Ca2+-binding modulate the holdase-type chaperone activity of S100B preventing tau aggregation and seeding. Nat. Commun. 12, 6292 (2021). · DOI · Paper page
- Danis, C. et al. Nuclear magnetic resonance spectroscopy for the identification of multiple phosphorylations of intrinsically disordered proteins. J. Vis. Exp. https://doi.org/10.3791/55001 (2016). · DOI
- Lee, W., Rahimi, M., Lee, Y. & Chiu, A. POKY: a software suite for multidimensional NMR and 3D structure calculation of biomolecules. Bioinformatics 37, 3041–3042 (2021). · DOI
- Hunter, J. D. Matplotlib: A 2D graphics environment. Comput. Sci. Eng. 9, 90–95 (2007). · DOI · Paper page
- Karlsson, R., Katsamba, P. S., Nordin, H., Pol, E. & Myszka, D. G. Analyzing a kinetic titration series using affinity biosensors. Anal. Biochem. 349, 136–147 (2006). · DOI · Paper page
- Vagin, A. & Teplyakov, A. Molecular replacement with MOLREP. Acta Crystallogr. D Biol. Crystallogr. 66, 22–25 (2010). · DOI
- Murshudov, G. N. et al. REFMAC5 for the refinement of macromolecular crystal structures. Acta Crystallogr. D Biol. Crystallogr. 67, 355–367 (2011). · DOI
- Emsley, P., Lohkamp, B., Scott, W. G. & Cowtan, K. Features and development of Coot. Acta Crystallogr. D Biol. Crystallogr. 66, 486–501 (2010). · DOI · Paper page
Cited by
Thiou, S., Martin, L., Manousaki, E., Nguyen, M., Mortelecque, J., Heidsieck, L., Cantrelle, F.-X., Blum, D., Buée-Scherrer, V., Buée, L., et al. (2026) · ACS Chemical Neuroscience · doi:10.1021/acschemneuro.6c00110 · Cited by 1
Self-citation
Metadata
- Authors
- Danis, C., Dupré, E., Bouillet, T., Denéchaud, M., Lefebvre, C., Nguyen, M., Mortelecque, J., Cantrelle, F.-X., Rain, J.-C., Hanoulle, X., Colin, M., Buée, L., & Landrieu, I.
- Venue
- Nature Communications
- Published
- 2025-04-02
- Volume
- 16
- Issue
- 1
- ISSN
- 2041-1723
- PMC
- PMC11965310
- Cited by
- 21
- References
- 8
- Language
- en
- Funders
- Agence Nationale de la Recherche (ANR-11-LABX-01, ANR-18-CE44-0016, ANR-22-CE92-0061)
- European Commission (GA101119596)
- Association France Alzheimer (6433)
- The Rainwater Charitable Foundation & Alzheimer’s Association
About these checks
Registry, retraction, Cites and statistics results are computed, not judged, with one exception: a printed reference that no index lists is read once by a model before it counts as a citation error. Claims are extracted by a model and kept only when their quote appears verbatim in the text; each cited source is then checked, with a model’s help, for whether it says what the claim relies on. Those verdicts can be wrong — read the claim’s quote and the cited source before relying on one.
Statistics and arithmetic are recomputed, not judged.
Confidence bands are shown only for fields calibrated on our annotated test set. None is calibrated yet, so no band is shown.
What counts as a claim ›How we measure confidence ›How we check this ›
Are you an author, or do you see a problem with this page? Request a review
How to cite
Cite CoChat for the checks on this page, and the paper for its own findings.
- This page
- CoChat. (2026). Citation check: Inhibition of tau neuronal internalization using anti-tau single domain antibodies. https://app.cochat.ai/papers/10.1038/s41467-025-58383-4
- The paper
- Danis, C., Dupré, E., Bouillet, T., Denéchaud, M., Lefebvre, C., Nguyen, M., Mortelecque, J., Cantrelle, F.-X., Rain, J.-C., Hanoulle, X., Colin, M., Buée, L., & Landrieu, I. (2025). Inhibition of tau neuronal internalization using anti-tau single domain antibodies. Nature Communications. https://doi.org/10.1038/s41467-025-58383-4
Data sources
Bibliographic data: Semantic Scholar, OpenAlex, Crossref.
Contains information from the Semantic Scholar Academic Graph Datasets, made available under the ODC Attribution License (ODC-BY 1.0).
Semantic Scholar’s data is described in: Kinney, R., et al. (2023). The Semantic Scholar Open Data Platform. arXiv:2301.10140.
