

The DOI matches its Crossref record; 43 of the 44 references it cites were found in a registry or an index; 8 of the 17 sources its claims cite were checked for support.
Yoked surface codes
Open accessAbstract
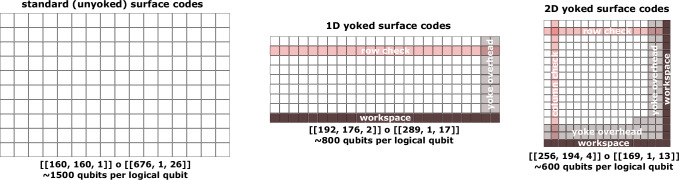
Abstract One of the biggest obstacles to building a large scale quantum computer is the high qubit cost of protecting quantum information. For two-dimensional architectures, the surface code has long been the leading candidate quantum memory, but can require upwards of a thousand physical qubits per logical qubit to reach algorithmically-relevant logical error rates. In this work, we introduce a hierarchical memory formed from surface codes concatenated into high-density parity check codes. These yoked surface codes are arrayed in a rectangular grid, with parity checks (yokes) measured along each row, and optionally along each column, using lattice surgery. Our construction assumes no additional connectivity beyond a nearest-neighbor square qubit grid operating at a physical error rate of 10 −3 . At algorithmically-relevant logical error rates, yoked surface codes use as few as one-third the number of physical qubits per logical qubit as standard surface codes, enabling moderate-overhead fault-tolerant quantum memories in two dimensions.
Overview
CoChat Summary
## TL;DR
The paper introduces yoked surface codes, a hierarchical memory that concatenates surface codes with simple parity-check outer codes arranged on a grid. At a physical error rate of \(10^{-3}\), the authors estimate these codes can cut qubit overhead to as little as one-third of standard surface codes at algorithmically relevant logical error rates.
## Key findings
- Yoked surface codes use row parity checks in 1D and row-plus-column parity checks in 2D, with no connectivity beyond a nearest-neighbor square qubit grid.
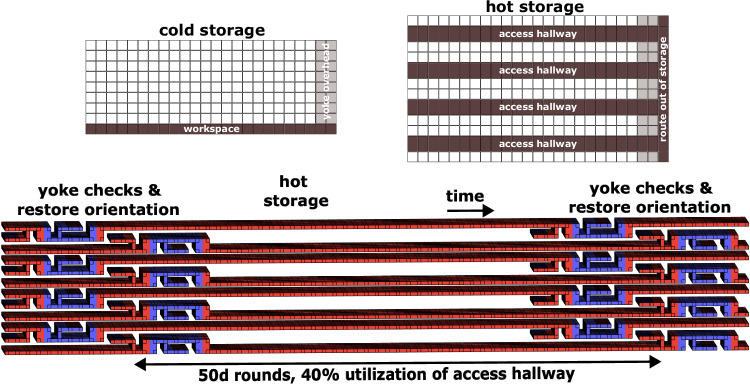
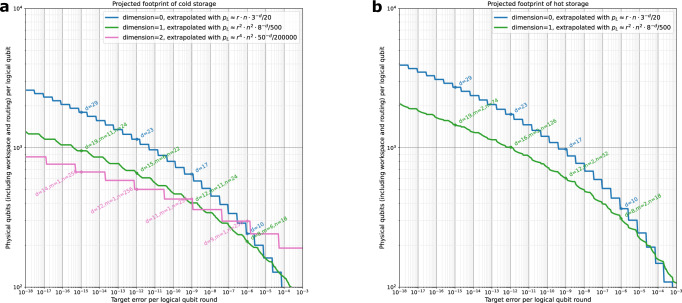
- The paper estimates that, in the teraquop regime at physical error rate \(10^{-3}\), yoked surface codes achieve nearly 3× as many logical qubits per physical qubit as standard surface codes for cold storage (2D), and nearly 2× as many for hot storage (1D).
- The abstract states these codes can use as few as one-third the number of physical qubits per logical qubit as standard surface codes at algorithmically relevant logical error rates.
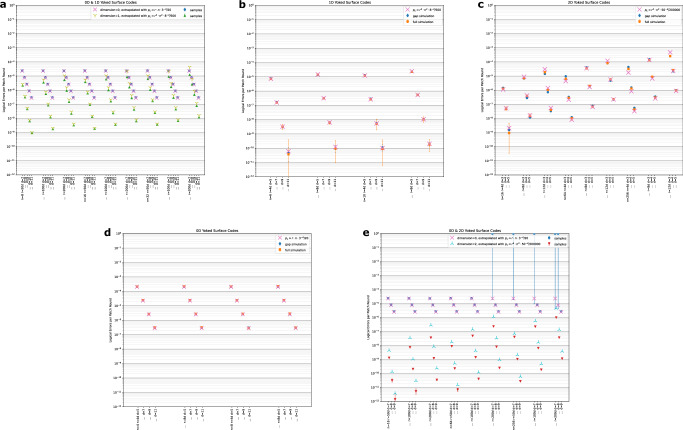
- The authors report that their simulations at \(10^{-3}\) show good agreement for 0D and 1D and fairly good agreement in 2D, while noting that in one benchmark a standard uniform depolarizing model suggests approximately 350 physical qubits per logical qubit versus 500 under their SI1000 model.
## Methods
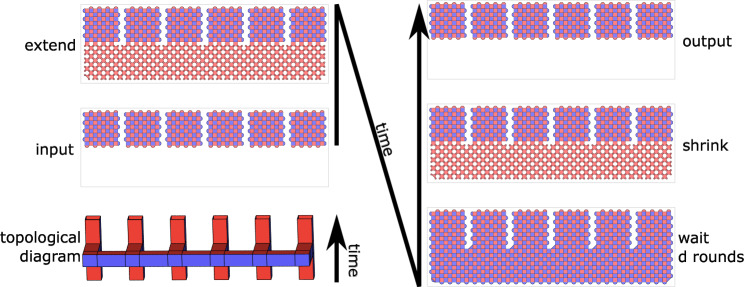
- Design: a hierarchical memory made by concatenating surface codes into outer quantum parity-check codes (“yokes”) measured using lattice surgery.
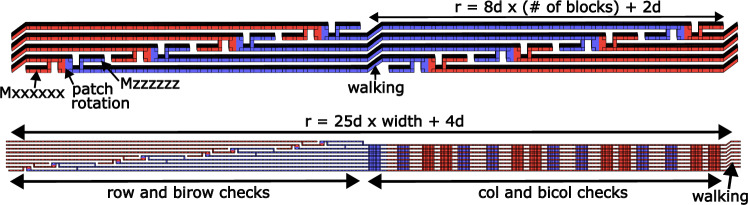
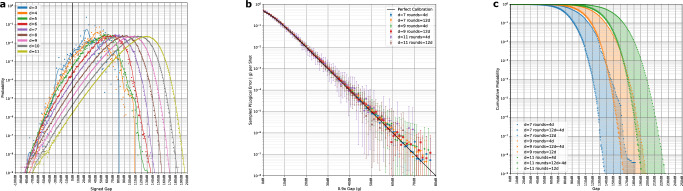
- Data/sample: simulations of inner surface-code experiments and outer-code decoding, including gap distributions from \(10^9\) shots, inner rounds up to \(10d\) for calibration, and phenomenological simulations up to 200d rounds between checks and 256 surface code patches.
- Main analysis: they use correlated minimum-weight perfect matching, complementary gaps as decoder edge weights, and heuristic/path-counting scaling laws validated against circuit-level and phenomenological simulations.
## Limitations
- The paper explicitly says the savings are shown through extrapolations and that full-scale simulations are needed to verify the precise overhead saved.
- It states that the estimates are conservative because of hook-error suppression and scaling approximations, so the reported overheads may be improvable.
- Evident from the text: the main benchmarks are based on a specific noise model (SI1000 at \(10^{-3}\)) and the authors acknowledge limited noise-strength diversity, so generality beyond these settings is not directly established.
Model-written summary. Check it against the paper before relying on it.
Integrity signals
Registry
Cites
Statistics
Figures
Verification
Claims the paper makes
5 Valid · 0 Not valid · 7 Not checked · 44 Own results and interpretations
The cited sources support only part of this claim — read each source’s verdict below.
In the paper
“At an error rate of 10−3, it can take 1000–2000 physical qubits per logical qubit for the surface code to reach error rates low enough to run classically intractable algorithms1–5.”
§ Yoked surface codes > Introduction
What the sources say
- Partly supportedcites [1] Fowler, A. G., Mariantoni, M., Martinis, J. M. & Cleland, A. N. Surface codes: Towards practical large-scale quantum computation. Phys. Rev. A 86, 032324 (2012). sourceExperimental — accuracy not yet measured
The statistical-model section (p. 12) says that at a physical error rate around 10^-3, a logical qubit needs 10^3–10^4 physical qubits to reach error rates sufficient for Shor’s algorithm. That supports the claim’s general point, but not its narrower 1,000–2,000-qubit estimate; the paper’s factoring example uses about 14,500 physical qubits per computational logical qubit (Background, p. 2). (LLM, conf=0.87)
- Not checked — no full text of the sourcecites [2] Shor, P. W. Algorithms for quantum computation: Discrete logarithms and factoring. In: Foundations of Computer Science, 1994 Proceedings, 35th Annual Symposium on, 124–134 (IEEE, 1994). source
- Supportedcites [3] Gidney, C. & Ekerå, M. How to factor 2048 bit rsa integers in 8 hours using 20 million noisy qubits. Quantum 5, 433 (2021). source
Section 2.14 (Physical qubit count) states that, at code distance 27 for factoring a 2048-bit RSA integer, each logical qubit covers 1,568 physical qubits. Sections 2.13 and 2.16 connect that code distance and surface-code error correction to the assumed physical gate error rate of 10^-3. This supports the claim as an example of what such a computation can require. (LLM, conf=0.92)
- Partly supportedcites [4] Häner, T., Jaques, S., Naehrig, M., Roetteler, M. & Soeken, M. Improved quantum circuits for elliptic curve discrete logarithms. In: Post-Quantum Cryptography: 11th International Conference, PQCrypto 2020, vol. 12100, 425 (Springer Nature, 2020). sourceExperimental — accuracy not yet measured
The Introduction (p. 1) reports that 2,330 logical qubits could translate into 6.77 × 10^7 physical qubits under plausible assumptions about physical error rates. The Preliminaries (p. 2) also describe surface-code overhead. Neither passage supports the specified 10^-3 physical error rate or the estimate of 1,000–2,000 physical qubits per logical qubit. (LLM, conf=0.76)
- Partly supportedcites [5] Litinski, D. How to compute a 256-bit elliptic curve private key with only 50 million toffoli gates. Preprint at https://arxiv.org/abs/2306.08585 (2023). sourceExperimental — accuracy not yet measured
Sections 2.1 and 2.2 use code distances of 28 and 24 for the paper’s key-breaking computation; section 2.1 says a circuit-based logical qubit uses 2d² physical qubits, yielding 1,568 and 1,152 qubits respectively. The Overview of results specifies a physical error rate of 10% of the surface-code threshold, but our copy does not equate that assumption with 10^-3. Thus the qubit range is supported, while the claimed physical error rate is not established by this source. (LLM, conf=0.84)
plainstates a cause- Asserted: passes — The authors put it forward as true.
- Checkable: passes — It can be checked against evidence.
- Load-bearing: passes — The paper’s conclusions depend on it.
- Based: passes — The paper gives a reason why it holds.
- Partly supported
A result the paper states — it cites no source for it, so there is none to check. The quote shows it is in the paper.
In the paper
“We find that these constructions can use as few as one-third as many physical qubits as standard surface codes under the same connectivity constraints.”
- Also stated in: § Abstract · plain
“At algorithmically-relevant logical error rates, yoked surface codes use as few as one-third the number of physical qubits per logical qubit as standard surface codes, enabling moderate-overhead fault-tolerant quantum memories in two dimensions.”
§ Yoked surface codes > Introduction
plainstates a cause- Asserted: passes — The authors put it forward as true.
- Checkable: passes — It can be checked against evidence.
- Load-bearing: passes — The paper’s conclusions depend on it.
- Based: passes — The paper gives a reason why it holds.
- Rests on an assumption not shown here.
- Also stated in: § Abstract · plain
A result the paper reports from its own data — it cites no other source for it, so there is none to check. The quote shows it is in the paper.
In the paper
“Note that, relative to the 3−d error suppression factor of the standard surface code, the error suppression factors in 1D (2D) of 8−d (50−d) fall short of the optimal 9−d (81−d) projected from doubling (quadrupling) the code distance.”
§ Yoked surface codes > Results > Numerics
plainstates an association- Asserted: passes — The authors put it forward as true.
- Checkable: passes — It can be checked against evidence.
- Load-bearing: passes — The paper’s conclusions depend on it.
- Based: passes — The paper gives a reason why it holds.
A result the paper reports from its own data — it cites no other source for it, so there is none to check. The quote shows it is in the paper.
In the paper
“In Fig. 7, we see that the gap distributions take a smooth, simple form after an initially noisy start at low distance, likely due to finite-size effects.”
§ Yoked surface codes > Results > Complementary gaps
hedgedstates a possible cause- Asserted: passes — The authors put it forward as true.
- Checkable: passes — It can be checked against evidence.
- Load-bearing: passes — The paper’s conclusions depend on it.
- Based: passes — The paper gives a reason why it holds.
A result the paper reports from its own data — it cites no other source for it, so there is none to check. The quote shows it is in the paper.
In the paper
“In order to flexibly choose the inner code distance, code block size, and number of code blocks to meet a target logical error rate, our simulations validate simple, heuristic scaling laws that we can use to estimate the logical error per patch-round.”
§ Yoked surface codes > Results > Scaling approximations
plainstates an association- Asserted: passes — The authors put it forward as true.
- Checkable: passes — It can be checked against evidence.
- Load-bearing: passes — The paper’s conclusions depend on it.
- Based: passes — The paper gives a reason why it holds.
27 more claims
Create a free account to see all 56 claims and to verify the 8 references still open.
- Probably not a substantial claim. 6
- It may state two separate claims as one. 18
- The quote only partly states this claim. 1
Citations
Cites
Algorithms for quantum computation: discrete logarithms and factoring
Shor, P. W. (2002) · Proceedings 35th Annual Symposium on Foundations of Computer Science · doi:10.1109/sfcs.1994.365700 · Cited by 8,713
Surface codes: Towards practical large-scale quantum computation
Fowler, A. G., Mariantoni, M., Martinis, J. M., & Cleland, A. N. (2012) · Physical Review A · doi:10.1103/physreva.86.032324 · Cited by 3,059 · cited 2×
“At an error rate of 10 − 3 , it can take 1000 – 2000 physical qubits per logical qubit for the surface code to reach error rates low enough to run classically intractable algorithms 1 – 5 .”
How to factor 2048 bit RSA integers in 8 hours using 20 million noisy qubits
Gidney, C., & Ekerå, M. (2021) · Quantum · doi:10.22331/q-2021-04-15-433 · Cited by 830
Self-citationSurface code quantum computing by lattice surgery
Horsman, D., Fowler, A. G., Devitt, S., & Meter, R. V. (2012) · New Journal of Physics · doi:10.1088/1367-2630/14/12/123011 · Cited by 598 · cited 1×
“Originally, lattice surgery was thought of as being built out of parity measurements 26,31 , but another useful perspective is to view lattice surgery as an instantiation of the ZX calculus 32 .”
Simple quantum error-correcting codes
Steane, A. M. (1996) · Physical Review A · doi:10.1103/physreva.54.4741 · Cited by 522 · cited 2×
“In particular, for 1D and square 2D codes, we obtain families of [[ n , n − 2, 2]] 29 and [[ n 2 , n 2 − 4 n + 2, 4]] codes, respectively.”
High-threshold and low-overhead fault-tolerant quantum memory
Bravyi, S., Cross, A. W., Gambetta, J. M., Maslov, D., Rall, P., & Yoder, T. J. (2024) · Nature · doi:10.1038/s41586-024-07107-7 · Cited by 456
Stim: a fast stabilizer circuit simulator
Gidney, C. (2021) · Quantum · doi:10.22331/q-2021-07-06-497 · Cited by 415
Self-citationConstant-overhead fault-tolerant quantum computation with reconfigurable atom arrays
Xu, Q., Ataides, J. P. B., Pattison, C. A., Raveendran, N., Bluvstein, D., Wurtz, J., Vasic, B. V., Lukin, M. D., Jiang, L., & Zhou, H. (2024) · Nature Physics · doi:10.1038/s41567-024-02479-z · Cited by 412
A Game of Surface Codes: Large-Scale Quantum Computing with Lattice Surgery
Litinski, D. (2019) · Quantum · doi:10.22331/q-2019-03-05-128 · Cited by 408
Tillich, J.-P., & Zemor, G. (2014) · IEEE Transactions on Information Theory · doi:10.1109/tit.2013.2292061 · Cited by 288
Cited by
Quantum error correction below the surface code threshold
Collaborators, G. Q. A. A., Acharya, R., Abanin, D. A., Aghababaie-Beni, L., Aleiner, I., Andersen, T. I., Ansmann, M., Arute, F., Arya, K., Asfaw, A., et al. (2025) · Nature · doi:10.1038/s41586-024-08449-y · Cited by 778
Self-citationLearning high-accuracy error decoding for quantum processors
Bausch, J., Senior, A. W., Heras, F. J. H., Edlich, T., Davies, A., Newman, M., Jones, C., Satzinger, K., Niu, M. Y., Blackwell, S., et al. (2024) · Nature · doi:10.1038/s41586-024-08148-8 · Cited by 106
“The probabilistic output can be used as soft information in hierarchical decoding schemes 50,51 , or as a confidence measure to discard the least confident samples (Fig.”
Self-citationAkahoshi, Y., Toshio, R., Fujisaki, J., Oshima, H., Sato, S., & Fujii, K. (2025) · PRX Quantum · doi:10.1103/93zr-1ykb · Cited by 48
Grand Challenge of Quantum Applications
Babbush, R., King, R., Boixo, S., Huggins, W. J., Khattar, T., Low, G. H., McClean, J. R., O’Brien, T. E., & Rubin, N. C. (2026) · PRX Quantum · doi:10.1103/6r9l-lynr · Cited by 70
Low-Overhead Magic State Distillation with Color Codes
Lee, S.-H., Thomsen, F., Fazio, N., Brown, B. J., & Bartlett, S. D. (2025) · PRX Quantum · doi:10.1103/ch5r-cnfq · Cited by 49
Metadata
- Authors
- Gidney, C., Newman, M., Brooks, P., & Jones, C.
- Affiliations
- Google (United States) (US)
- Corresponding author
- Newman, Michael
- ORCID
- Newman, Michael
- Venue
- Nature Communications
- Published
- 2025-05-14
- Volume
- 16
- Issue
- 1
- Pages
- 4498-4498
- ISSN
- 2041-1723 (ISSN-L)
- PMC
- PMC12078507
- OpenAlex
- W4410357503
- Cited by
- 85
- References
- 44
- Citations by year
- 2026: 56 · 2025: 21
- FWCI
- 19.80
- Type
- journal article
- Language
- en
- Open access
- gold
- doi.org
- Licence
- cc-by
- creativecommons.org/licenses/by/4.0 (tdm)
- creativecommons.org/licenses/by/4.0 (vor)
- Locations
- Nature Communications (publishedVersion, cc-by)
- PubMed Central (publishedVersion, cc-by)
- PubMed (publishedVersion)
- arXiv (Cornell University) (submittedVersion)
- RePEc: Research Papers in Economics (submittedVersion)
- DOAJ (DOAJ: Directory of Open Access Journals) (submittedVersion, cc-by-sa)
- arXiv (Cornell University)
- Topics
- Physical Sciences › Computer Science › Artificial Intelligence › Quantum Computing Algorithms and Architecture
- Physical Sciences › Physics and Astronomy › Atomic and Molecular Physics, and Optics › Quantum Information and Cryptography
- Physical Sciences › Physics and Astronomy › Atomic and Molecular Physics, and Optics › Quantum many-body systems
- Keywords
- surface code, fault-tolerant quantum memory, lattice surgery, logical error rate, concatenated codes, quantum error correction
About these checks
Registry, retraction, Cites and statistics results are computed, not judged, with one exception: a printed reference that no index lists is read once by a model before it counts as a citation error. Claims are extracted by a model and kept only when their quote appears verbatim in the text; each cited source is then checked, with a model’s help, for whether it says what the claim relies on. Those verdicts can be wrong — read the claim’s quote and the cited source before relying on one.
The claim verdicts this report counts are experimental: their accuracy is not yet measured.
A language model drew the claims from the paper on 2026-10-10, under version 3 of the claim definition (model deepseek-v4.1-flash, prompt extract-v3).
A second model labelled each claim on 2026-10-10 (model jev-1.13-20260917, definition revision gold-guideline-v0.2).
Cited sources are checked with a language model’s help (gpt-6-sol).
Statistics and arithmetic are recomputed, not judged.
Confidence bands are shown only for fields calibrated on our annotated test set. None is calibrated yet, so no band is shown.
What counts as a claim ›How we measure confidence ›How we check this ›
Are you an author, or do you see a problem with this page? Request a review
How to cite
Cite CoChat for the checks on this page, and the paper for its own findings.
- This page
- CoChat. (2026). Citation check: Yoked surface codes. https://app.cochat.ai/papers/10.1038/s41467-025-59714-1
- The paper
- Gidney, C., Newman, M., Brooks, P., & Jones, C. (2025). Yoked surface codes. Nature Communications. https://doi.org/10.1038/s41467-025-59714-1
Data sources
Bibliographic data: Semantic Scholar, OpenAlex, Crossref.
Contains information from the Semantic Scholar Academic Graph Datasets, made available under the ODC Attribution License (ODC-BY 1.0).
Semantic Scholar’s data is described in: Kinney, R., et al. (2023). The Semantic Scholar Open Data Platform. arXiv:2301.10140.
